
 ?Mathematical formulae have been encoded as MathML and are displayed in this HTML version using MathJax in order to improve their display. Uncheck the box to turn MathJax off. This feature requires Javascript. Click on a formula to zoom.
Abstract
The first aim of the present study is to investigate the feasibility of the biogas production potential from Spent Mushroom Compost. Hence, its secondary aim is to study the replacement of this energy with the fossil energy source and its impact on the reduction of greenhouse gases emission. The production potential of biogas was evaluated in a laboratory-scale Open Outlet Flow Batch Type Anaerobic digester. Setups of biogas production were set at temperatures of 35°C and 55°C. Results indicate that the cumulative production of biogas at 55°C was more than that at 35°C (364.8 and 314.11 L/kg.VS, respectively). The energy required for 1 ton of spent mushroom compost in one period of production was 204.24–5.35T kW.h/ton. The amount of energy produced in a period of biogas production was calculated to be 277.95 kW.h/ton at 35°C and 322.84 kW.h/ton at 55°C. Results show that the total produced spent mushroom compost of the country is equal to 414,491.7 tons per year. Accordingly, the potential of methane production was calculated to be 8690.8 × 103 m3 per year. It can also reduce 0.02% of the total annual production of CO2 in Iran.
List of symbols
| AD | = | Anaerobic digestion |
| APHA | = | American Public Health Association |
| GHG | = | Greenhouse gases |
| OOFBTA | = | Open outlet flow batch type anaerobic |
| SMC | = | Spent mushroom compost |
| TS | = | Total solid (%) |
| Ta | = | Ambient temperature |
| Tin | = | Initial temperature |
| Ts | = | the inside temperature |
| VS | = | Total volatile solids (%) |
1. Introduction
Iran is rich in fossil fuels such as coal, oil, and natural gas. After fossil fuels, biomass is the fourth largest sustainable energy source in Iran and across the world. The biomass resources include a wide range of organic materials that are mainly divided into six groups: (1) wood, (2) wastes collected from forest, and the agriculture, horticulture, and food industries, (3) municipal solid wastes, (4) wastewater, (5) livestock wastes, and (6) sewage and organic waste of industries. Direct usage of these resources can produce heat and, in the case of using them to produce biofuel such as biogas, which can be used in motor-generators to produce electricity. Iran, on one hand, benefits from non-renewable fossil fuel resources such as oil and gas. On the other hand, the country also benefits from its limitless potential for sustainable energy sources such as solar, geothermal, wind, hydrogen and biomass (Fardad et al., Citation2018). In fact, renewable energy sources are becoming more popular by the day. The human population will soon be deprived of non-renewable energy sources. Perishable materials and solid wastes (biomass) are abundant and the operation of the biogas system is quite simple. Therefore, many countries, including China, Germany, and Sweden have appealed for more production of bioenergy (Abdoli & Pazekey, Citation2012; Najafi, Faizollahzadeh Ardabili, Mosavi, Shamshirband, & Rabczuk, Citation2018).
In today’s world, fossil fuels reign over the global energy systems. But, due to the reduction of resources of non-renewable energy, and the pollution and environmental damage that has been caused, the world is turning towards renewable energy sources (Afsharzade et al., Citation2016) (Najafi & Faizollahzadeh Ardabili, Citation2018). In this study, Figure indicates the total energy consumption in Iran and across the world (Hamzeh, Ashori, Mirzaei, Abdulkhani, & Molaei, Citation2011; Mostafaeipour & Abarghooei, Citation2008; Najafi, Ghobadian, Tavakoli, & Yusaf, Citation2009). Natural gas has the highest rate of energy consumption among other energy resources in Iran, and oil has the highest rate of energy consumption across the world.
Figure 1. The total energy consumption in Iran and world.
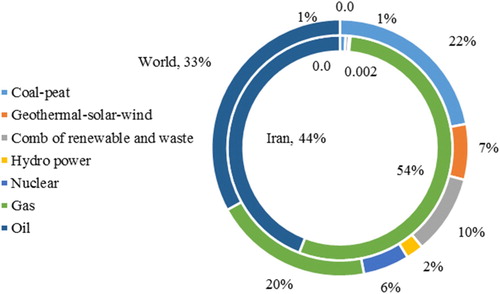
Allocation of 54% and 44% of energy to oil and natural gas has made Iran one of the countries that take advantage of its natural energy resources (Moghaddam, Mousavi, Nasiri, Moallemi, & Yousefdehi, Citation2011). Heavy dependence on fossil fuel has caused an energy crisis. All current trends indicate towards the depletion of fossil fuel resources (Nabavi-Pelesaraei, Bayat, Hosseinzadeh-Bandbafha, Afrasyabi, & Chau, Citation2017). Therefore, future generations will be facing a severe shortage of energy supply. Using fossil fuel for economic activities – from manufacturing to agricultural industries – led to GHG emissions from almost all regions of the world (Ben Jebli & Ben Youssef, Citation2015). Iran, in addition to having different sources of fossil energy, also has various renewable energy resources (Bahrami & Abbaszadeh, Citation2016). Such resources that have been discussed by researchers include solar energy (Afsharzade et al., Citation2016), wind energy (Mostafaeipour & Abarghooei, Citation2008), hydropower energy (Derakhshan & Nourbakhsh, Citation2008; Ghorashi & Rahimi, Citation2011), biomass (Afazeli, Jafari, Rafiee, & Nosrati, Citation2014; Noorollahi, Kheirrouz, Asl, Yousefi, & Hajinezhad, Citation2015), and geothermal energy (Bahrami & Abbaszadeh, Citation2013; Noorollahi, Yousefi, Ehara, & Itoi, Citation2008).
Nowadays, a lot of attention is directed towards renewable energies. The reason for this is that, on the one hand, fossil fuel resources are limited and, on the other hand, renewable energy resources such as putrescible liquid and solid wastes are abundant (Afazeli et al., Citation2014). Reports show that countries such as Germany, Sweden, China, and India are using renewable energy for supplying a part of their required energy (Afazeli et al., Citation2014). In addition to the mentioned issues, various studies indicate that there is a direct relationship between the use of renewable energy and reduction of GHG emissions (Agostini et al., Citation2015, Citation2016; Liu et al., Citation2012; Uusitalo et al., Citation2014). The primary aim of biogas production is the reduction of GHG in the energy sector (Reinelt, Liebetrau, & Nelles, Citation2016). Several studies have been conducted on the relation of biogas production and GHG reduction. Carbon dioxide (CO2) is the most significant among all greenhouse gases emitted during the production of fossil-based energy (Li, Baležentis, Makutėnienė, Streimikiene, & Kriščiukaitienė, Citation2016). Liu et al. (Citation2012) have studied the feasibility of developing anaerobic digestion (AD) for municipal biomass waste (MBW) in China that was focused on biogas production and GHG reduction. They reported that GHG reduction is an important environmental benefit derived from MBW digestion.
In a study conducted by Zhang and Chen (Citation2016), an LCA model was proposed to characterize direct and embodied carbon emission and mitigation of a typical household biogas project. Results show that the household biogas projects are a good way to reduce carbon emission. In another study, Uusitalo et al. (Citation2014) have studied the GHG emission from transportation with the basis of biogas fuel and compared it with the electricity and heat production and composting of feedstock transportation. They used the LCA method and reported that using biogas in the transportation sector reduces GHG emissions compared to fossil-based transportation fuels in all studied cases. Also, biogas production and its use in producing electricity and heat also reduces GHG emission compared to the composting of feedstock. Besides, due to the ability to convert any natural and renewable materials, including waste processing of agricultural products and agricultural waste, to biogas, it can be concluded that the development of this technology can boost the agricultural sector and create job opportunity in this field. If we want to give a brief explanation of the natural and accessible resources of Iran, it can be said that Iran is surrounded by 2700 km of marine borders that can exploit about 120 m3 of water resources. Also, it has about 164.8 million hectares of land with a 31% accessibility (Afazeli et al., Citation2014). If we want to take a rule of thumb, it is clear that there is a large amount of biomass energy that can be used as an alternative energy source and is indeed an invaluable source for energy supply.
According to the statistics procured from the Agricultural Ministry of Iran, the yield of some of the most important products, in terms of megatons per year, in the sphere of greenhouse production include 100.2 of medicinal plants, 1.02 of oyster mushroom, 172.7 of button mushroom. In the area of livestock and poultry, it can be said it has about 487,775 sheep and lambs, 204,076 goats, 8,117,661 cows and calves, 204,384 buffaloes, and around 162,371 camels.
Several studies have been conducted in the field of the biomass of livestock including the one conducted by Afazeli et al. (Citation2014) and another one by Noorollahi et al. (Citation2015). But, the Greenhouse production industry has great potential for biomass production. By examining this industry, we found that the button mushroom production industry has a high rate of biomass production and this is because of its requirement to compost the substrate. In the last three decades, mushroom farming has developed rapidly across the world. More than 100 countries now active in the production of edible mushrooms. Over 6 million tons of edible mushroom are produced worldwide annually. On an average, the production of one kg of mushroom requires five kg of compost (Williams, McMullan, & McCahey, Citation2001). Every year, over 30 million tons of mushroom compost waste are being produced. In the cycle of mushroom production, agricultural wastes are used to produce the mushroom compost. Compost is the main part of cultivated mushroom and its components vary according to the type of mushroom. In this study, we only evaluated the button mushroom compost waste, hence, the word of mushroom compost means button mushroom compost and its main components including chopped straw, chicken manure, horse manure, corn, and gypsum (Guo, Chorover, & Fox, Citation2001). Other ingredients may also include alfalfa, cottonseed meal, cottonseed skin, cocoa bean skins, corn beer, and some other food additives (Beyer, Citation1999). Wastes of mushroom compost have a high content of organic material (about 60% (Wisniewska & Pankiewicz, Citation1989)) and they also contain a significant amount of straw and animal manure that increases the rate of fermentation. It seems to be a highly suitable source for the production of biogas.
If we look closer at the button mushroom production industry, it can be said that it has two major kinds of products, the first and well-known product is button mushroom and the second is the SMC.
In fact, the SMC is a mushroom compost, which is used in the production hall and is discharged after the production process (Meng, Li, Zhang, Wu & Lv, Citation2016). Due to its well-developed mushroom production, Iran produces a large amount of SMC.
The SMC has no specific use except that a very small part of the compost is recycled. The rest would be sold at a very low cost for direct application in agriculture or is left in the environment that eventually leads to environmental pollution (Grujić, Dojnov, Potočnik, Duduk, & Vujčić, Citation2015). The SMC has a lot of residual components such as carbohydrate, protein, and fat (Luo et al., Citation2014). It also contains enzymes such as protease, lactase, cellulose, and hemicellulose (Fang et al., Citation2016; Kulcu, Sönmez, Yaldiz, & Kaplan, Citation2008). This material, due to its low amount of C/N, is used for the reduction of C/N amount (Meng et al., Citation2016) in materials such as wheat straw, rape straw, maize straw, and rice straw (Zhao, Li, Ni & Xie, Citation2016). The C/N ratio of mushroom compost waste is reported in different sources and it seems to be dependent on various conditions such as the initial percentage of composting materials and the production rate of mushroom. For example, Levanon and Danai (Levanon & Danai, Citation1995) reported the number 15.8 for the C/N ratio. Chong and Richer (Chong & Rinker, Citation1994), along with Fleming (Fleming & MacAlpine, Citation2006), reported the number 11.6 for the C/N ratio. As mentioned, the C/N ratio is an important parameter, affecting the production of biogas, and this ratio should be 25.1–30.1 in order to provide a suitable environment for the activities of the bacteria. In order to achieve this ratio, the mushroom compost waste needs to be mixed with materials such as manure, straw and etc. According to the statistics compiled by the Statistical Centre of Iran (‘Iran Meteorogical Center. Availble from <http://irimo.ir/eng/index.php>’) in 2015, about 414,491.7 tons of SMC is produced annually in the country. By comparing the number of production farms of edible mushroom in the country, we can predict that this number will be much higher in the coming years (Table ). This huge amount of compost is useless and, hence, it is discharged from the production halls after the mushroom production. Besides, a lot of space is allocated to these wastes in the mushroom farms.
Mushroom compost waste, as well as other wastes, can be problematic for humans and the environment. This is one of the most important issues of mushroom production farms. The primary issues regarding the waste are (Azizi, Citation2008):
Occupying a lot of space in mushroom growing farms
Paving the way for pests and diseases in the farms
Polluting the environment and natural resources.
Anaerobic digestion is an approach that can reduce the environmental risks of the waste. It can also be done by producing biogas, where stored energy in organic waste would change to usable energy in the production farm.
Several studies have been conducted in the field of biogas production along with various biomass and potential surveys oriented towards the production of biogas from different materials. Here, Table was prepared as a summarized report of biogas production from different materials inside and outside of Iran.
Table 1. The Summarized report of biogas production.
In addition to the energy production issue, the present discussion will prove to be valuable when introduced as an alternative energy to non-renewable energies.
There are several studies on the potential of conversion of biogas into other forms of energy such as electricity. In a study conducted by (Uddin et al., Citation2016), biogas was presented as an alternative energy source and its impact on the Pakistani economy and health-related issues (dos Santos, Barros, & Tiago Filho, Citation2016) introduced population growth as a factor responsible for the increasing energy demand. They presented a brief method for analyzing the economic and energetic potential of the produced biogas from anaerobic wastewater treatment plants. Moreover, they also studied on the feasibility and potential for electricity generation from the produced biogas energy (O’Shea, Wall, & Murphy, Citation2016) used four feedstocks, including grass silage, food waste, Laminaria digitata (Oarweed), and dairy cow slurry, for bio-methane potential assay in a demand-driven biogas system. They used kinetic models and also presented a model for the production of electricity.
The use of biomass for the production of biogas from the waste resources commonly has been performed by different studies. The progress of information in this field of science is being completed. Therefore, in this study, the use of SMC for the production of biogas has been introduced as an innovative resource and the initial studies which have been performed in our previous study (Najafi & Ardabili, Citation2018) indicated that SMC have a considerable potential for biogas production. This trend can be considered by policy makers and further studies. This study, in fact, completes our previous study.
The main contributions of our survey are listed as:
This study presents the biogas production potential from spent mushroom compost in Iran.
The present study also discusses the sustainability of biogas production system from view point of energy balance.
Ambient temperature is a factor that effects on biogas production potential, confidence of system, GHG emission and cash flow.
We also survey the conversion of produced energy to power generation in Iran and its impact on the GHG emission.
The survey also presents the economic approach of biogas production.
The method of biogas production in each country depends on the primary sources and the economic and environmental aspects. The primary aim of the present study is to investigate the feasibility of biogas production potential from the SMC. The secondary aim is to study the replacing of this energy with a fossil-based energy source and its impact on the reduction of the GHG emission.
Therefore, accordingly, this study is an introduction to the sources, status, and prospects of the waste from the mushroom compost as a sustainable energy source for biogas production in Iran. This study consists of five stages. At the first stage, we present an introduction to the overview of the study. At the second stage, we discuss biogas production and the production rate of the SMC, and also measures the production and consumption of energy. At the third stage, we discuss reducing pollution from greenhouse gases. At the fourth stage, we observe the plan from an economic perspective, and, at last, we present a comprehensive conclusion of the subject.
2. Process of biogas production from SMC
In this study, the SMC was used as the main material to produce biogas. The required SMC was prepared from the agro-industry of Sabalan mushroom farms, located in the Ardabil province of Iran. Total solid (TS) was determined by deducting the amount of moisture from the total amount of SMC. Volatile solid (VS) was also determined based on the American Public Health Association (APHA) standard (American Public Health Association (APHA), Citation2011; Gutiérrez-Gutiérrez, Coulon, Jiang, & Wagland, Citation2015; US Environmental protection Agency, Citation2001). The amount of nitrogen in the biomass of the SMC and the organic carbon level were according to the APHA standard, using the Kjeldahl method and chemical burns, respectively. Table indicates the experimental results.
Table 2. Characteristics of SMC.
An open Outlet Flow Batch Type Anaerobic (OOFBTA) digester was employed to measure the production potential of biogas. Using a batch type reactor is more common due to its simplicity, easy setup, and easy monitoring and evaluation (Kratky, Jirout, & Nalezenec, Citation2012).
Four three-liter plastic bottles were used as digesters (Figure ) according to European standards (VDI4630, Citation2006).
Figure 2. Biogas production and measuring setup.
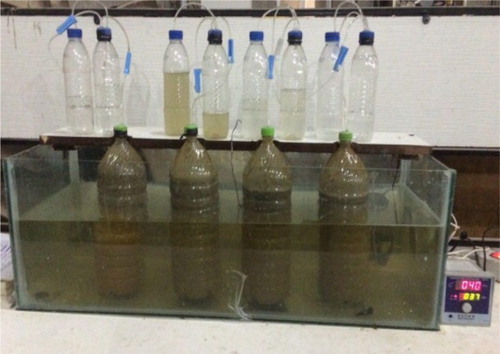
The digesters were placed at 35°C and 55°C. The produced biogas was transferred from the digesters to another set of plastic bottles and their volumes were measured by using the water displacement method (Engineers, Citation2006; Najafi & Ardabili, Citation2018).
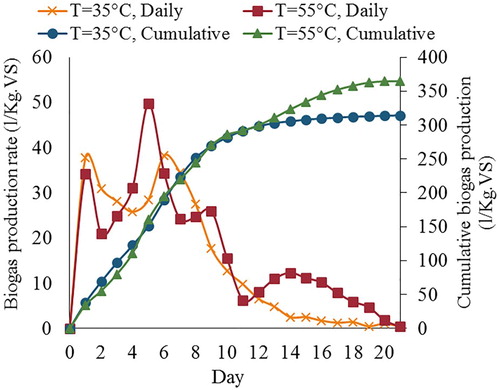
In order to load the digesters, 500 g of SMC, with an initial moisture of 58.9%, was mixed with 1850 g of water to the amount of VS at 10%. Setups of biogas production were prepared at 35°C (mesophilic temperature) and 55°C (thermophilic temperature). In order to expedite the digestion process, 50 g of an enriched solution of bacteria was added to the digester. In order to prepare the enriched solution, 150 g of bovine rumen content was mixed with 150 g of water. The prepared solution was then placed in an oven at 37°C for seven days. This helped the bacteria to multiply well. Meanwhile, data collecting was being performed at a certain time every day, for 21 days. In order to evaluate the reproducibility of the testing, the tests were performed with three replications. Figure shows the cumulative and daily volume of biogas production at 35°C and 55°C per Kg of TS. The biogas production was started in all cases without any delay in time and reached to the maximum amount after five to seven days. One of the main reasons can be the injection of enriched solutions as a starter at the beginning of the test. The maximum rate of biogas production occurred on the fifth day at a temperature of 55°C, which was about 50 L/kg.VS. The production rate decreased after reaching a peak. As seen in Figure , the production rate at 55°C is more than that at 35°C on the last days of production. One reason behind this can be the semi-hard texture of the SMC that can be prepared at 55°C to digest bacteria better than at 35°C. The results also indicate that the cumulative production of biogas at 55°C is more than that at 35°C, these are 364.8 and 314.11 L/kg.VS, respectively.
Figure 3. Cumulative and daily production of biogas at 35°C and 55°C.
3. Reactor designing for biogas production
In Iran, biogas production systems have two variants such as Chinese and Indian (Noorollahi et al., Citation2015). The Chinese system has a fixed gas tank. The produced gas is stored in the upper part of the digester and the gas production increases the pressure of the gas. Due to this, it does not consider the digester volume over 20 m3. This type of digesters has a low manufacturing cost and a long shelf life (more than 20 years) because it has no moving part (Fardad et al., Citation2018). In the Indian system, the gas tank is movable and the gas pressure is always constant. Hence, according to the balance of anaerobic fermentation, the digestion process is improved and the biogas production rate is increased. But, due to the flotation tank, and a higher construction cost, its shelf life is shorter than its Chinese counterpart. The Indian one lasts up to 15 years in cold regions and up to 5 years in warm regions (Fardad, Citation2017). In this study, an OOFBTA digester was designed by combining the Chinese and Indian systems and it had the benefits of both the systems. In order to design the capacity of the reactor, data collecting was performed from one production hall. The outlet biomass from each production hall in 60 days (one period of production) is equal to 12 tons with the moisture of 80.9%. Considering that the SMC can be discharged periodically (every 60 days) from each production hall, an OOFBTA-type reactor is proposed. It should be noted that the calculations behind the design of the reactor were performed for one production hall. In order to calculate the volume and dimension of the target reactor, 12 tons of SMC was mixed with 12 tons of water to achieve the 10% of TS to make the weight of the reactor contents equal to 24 tons. By considering the reported numbers for the density of the SMC and water in various references (Fidanza, Sanford, Beyer, & Aurentz, Citation2010; Noble & Gaze, Citation1996), the content density was measured about 600 kg/m3. The volumes of organic material inside the reactor were expanded during the fermentation process, so the safety factor was assumed to be equal to 1.2 and, consequently, the required volume of the target reactor was calculated at 48 m3. Therefore, it can be a cylindrical reactor with a height of 2.5 m and a diameter of 5 m.
3.1. Heat transfer in the designed reactor
The inside temperature of the reactor should be within the range of mesophilic (35°C) and thermophilic (55°C) temperatures to ensure the condition for sustainable gas production. There are various technologies that can maintain the required temperature inside the reactor. One of the most common is the use of heating pipes along the reactor walls and pumping hot water from a heat exchanger into the pipes. The value of required heat depends on the ambient temperature and the climatic conditions of the region. The required thermal energy for a biogas reactor can be studied in two stages: start-up and continuous work. The required thermal energy at the start-up stage () by (kW h) can be calculated using Equation (1) (Holman, Citation1972):
(1)
(1)
According to the reported number for the thermal capacity of the SMC and water in references (Mudhoo & Mohee, Citation2007), the thermal capacity (C) of the solution inside the reactor was calculated at 3.56 (Kj/Kg K). Here, m is the mass of the materials inside the reactor and is equal to 24,000 kg, Ts is the inside temperature and is equal to 35°C or 55°C, and Tin is the initial temperature of the substrate. The required thermal energy in continuous work () by (KW h) is equal to the total energy dissipated from the surfaces of the walls, ceilings, and floors, and can be calculated using Equation (2) (Holman, Citation1972):
(2)
(2)
The designed reactor has a height of 2.5 m and a diameter of 5 m. So, the area of the reactor wall is equal to Aw = 39.25 m2, and the area of the floor and the ceiling of the reactor is equal to . Here, Ts is the temperature of the inside of the ground and is almost at a constant value, which is equal to 15°C, and Ta is the ambient temperature. Moreover, t is the warm-up time of the reactor, which is calculated to be 24 h. U is the heat transfer coefficient by (W/m2 K) that is calculating for the walls, roof, and floor as Equations (3)–(5) (Holman, Citation1972):
(3)
(3)
(4)
(4)
(5)
(5)
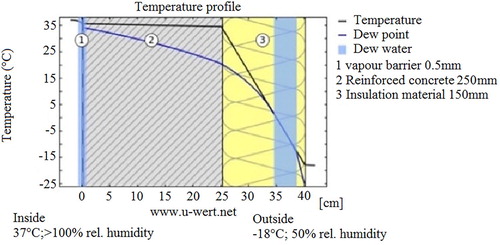
Here, ha is the convective heat transfer coefficient of air, which is equal to 30(W/m2 K) and the convective heat transfer coefficient of the substrate is equal to ha = 1000(W/m2 K). The reactor wall is made of brick and cement with a thickness of 0.25 m (lw = 0.25 m) and the heat transfer coefficient of kw = 1.46 (W/m K) (Incropera & De Witt, Citation1985). The ceiling and the floor of the reactor are made of concrete with the thickness of lc = lf = 0.1 (m) and the heat transfer coefficient of kc = kf = 1.76 (W/m K) (Incropera & De Witt, Citation1985). All surfaces are covered by glass-wool insulation with a thickness of 0.05 (m) and the heat transfer coefficient of
0.04 (W/m K). Figure shows the heat transfer from the reactor of biogas production and its insulation.
Figure 4. Heat transfer of biogas production reactor (Rutz, Mergner, & Janssen, Citation2012).
Assuming the package of the heating pipes on the walls of the reactor for heating the system, the heating efficiency of the heating system is approximately equal to 70% (Statistical Center of Iran, Citation2017). So, the required heating energy is equal to the total energy of the start-up and continuous working as described in Equation (6):
(6)
(6)
4. Energy consumption for the production of biogas
The Ardabil Province (38.4853°N, 47.8911°E) in Iran is one of the most important tourist centers and has a cold climate. Figure presents the measurements of air temperature in Iran from 2006 to 2016 (‘Iran Meteorological Center. Availble from <http://irimo.ir/eng/index.php>’). This result indicates that the Ardabil province has the minimum average annual temperature among other provinces of Iran, which is approximately equal to 10°C. Therefore, it was selected as a province with the most difficult conditions for biogas production as a case of study in this research.
Figure 5. Average temperature of provinces of Iran from 2006 to 2016.
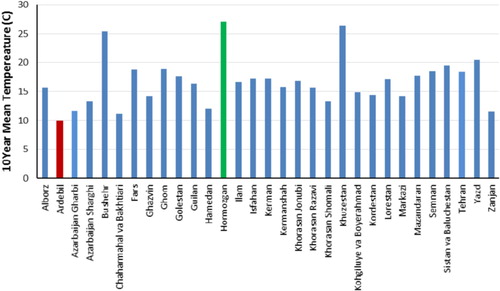
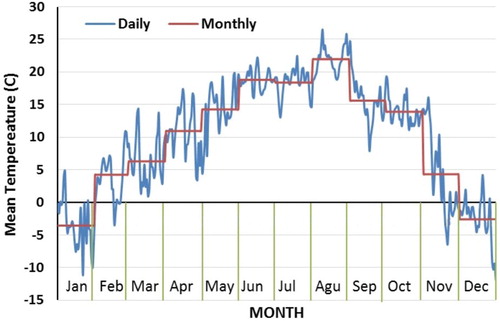
Figure indicates the daily and monthly average temperatures of the Ardabil province in 2016 (‘Iran Meteorological Center. Availble from <http://irimo.ir/eng/index.php>’). It is clear that the monthly average temperature has the lowest value (−3.6°C) in January and the highest value (21.9°C) in August. Besides, the lowest daily temperature of −11.9°C has also been measured in January, which is a critical condition for biogas production.
Figure 6. The average daily and monthly temperature of Ardabil province in 2016.
By considering that Ta is a variable parameter, to simplify calculations in this study, the average monthly temperature is considered as Ta. By replacing the numerical values in Equation (6), the required thermal energy for a period of production (21 days) by (kW.h), is obtained using Equation (7):
(7)
(7)
(8)
(8)
Due to the amount of SMC (12 ton) with the moisture of 80.9%, the required energy for 1 ton of SMC in one period of production by kW h/ton is obtained using Equation (8):
5. The produced energy from biogas
The experimental results of this study show that the value of the produced biogas at 35°C is equal to 314.119 L/kg.VS while it increases to 364.8 L/kg.VS at 55°C (Based on Figure ). Around 17.7% of the total SMC is VS (Table ), so, for 12 tons of SMC, the VS is equal to 2.124 tons (0.177 × 12 = 2.124). Therefore, the volume of the produced biogas is 667.19 m3 at 35°C (2.124 × 314.119 = 667.19) and is 774.83 m3 at 55°C. By assuming the low heating value of biogas at 18 Mj/m3 (or 18 ÷ 3.6 = 5 kWh/m3) (Fardad, Citation2017), the total heating value of the produced biogas will be 3335.48 kW h at 35°C (667.19 × 5 = 3335.48) and 3874.15 kW h at 55°C. The produced energy in a period of biogas production, by counting 12 tons of SMC, will be QEnergy Production = 277.95 kW h/ton at 35°C (3335.48 ÷ 12 = 277.95) and QEnergy Production=322.84 kW h/ton at 55°C.
6. Energy sustainability and confidence to biogas production system
In order to investigate the sustainability of the biogas production system from view point of energy, the confidence factor is defined as the ratio of the specifically produced energy to the required thermal energy as shown in Equation (9):
(9)
(9)
Production of biogas is sustainable from view point of energy when the confidence factor is more than 1 (), hence, the critical condition occurs when the confidence factor is equal to 1. At a temperature of 35°C, by replacing the value of the produced energy (277.95 kW h/ton) and the required thermal energy from Equation (8) to Equation (9), the minimum permitted temperature for biogas production was obtained to be −13.77°C. It should be noted that the minimum permitted temperature for production at 55°C was obtained to be 1.08°C. According to the values of the temperature for the last 10 years, the average monthly temperature of the provinces of Iran never reduces to a value less than −13.7°C, hence, it is clear that the production system will be quite sustainable at 35°C. At 55°C, the critical temperature is +1.08°C, hence, there is no sustainable condition for biogas production in most provinces of Iran. Biogas production at a temperature of 55°C during the cold seasons of the year require additional energy consumption from the national grid of natural gas and, in this condition, there is a negative energy balance and the production system is going out of sustainable condition. The following calculations were performed at a temperature of 35°C. The net produced energy from biogas SMC is equal to the difference of produced specific energy and the specific required thermal energy by (kW.h/ton) (Equation (10)):
(10)
(10)
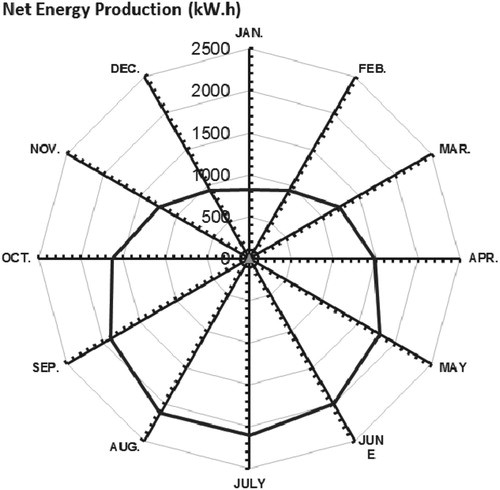
Figure shows the net produced energy from biogas for one production hall with the capacity of 12 tons of SMC in a 60-day period of mushroom production in the Ardabil province. It is clear that there is a sustainable biogas production (within a range of 821–2123 kW h) during all months of the year. The biogas production potential from the SMC has the lowest value during the cold months of the year (December, January, and February) and has the highest value during the warmer months of the year (August, July, and June).
Figure 7. The produced net energy of biogas in Ardabil province (for one production hall with SMC capacity of 12 tons).
The experimental results of this study indicate that the average percentage of methane at a temperature of 35°C is equal to 65% of biogas. Assuming the lowest value of thermal energy from biogas (18 Mj/m3) and by replacing in Equation (10), the total produced methane per ton of SMC by (m3/ton) was calculated using Equation (11):
(11)
(11)
Table was extracted and prepared from the references (Statistical Center of Iran, Citation2017; ‘Statistics of Agriculture Organization of Iran,’ Citation2014–Citation2015) of statics of mushroom production industries. Table presented the amount of produced methane from the SMC in Iran in 2015. Statistics show that the total produced SMC of the country is equal to 414,491.7 tons per year. Accordingly, the potential of methane production was obtained at 8690.8 × 103 m3 per year and that the Qazvin and Tehran provinces had the highest value of methane production at 1731.1 × 103 and 1249.4 × 103 m3, respectively. The highest values of methane production from the SMC in the country were observed to occur in July and August (1028.9 × 103 and 1000.9 × 103 m3, respectively) and the lowest values of methane production from the SMC were observed to occur in January and December (395.8 × 10³ and 451.7 × 10³ m3, respectively).
Table 3. Available methane potential value of SMC in provinces of Iran according to 2016 data set.
Figure shows the distribution and production rate of methane throughout the country. Accordingly, the volume of methane production increases as we go from blue to red color.
Figure 8. The potential of methane production from SMC by 1000 m3 per year.
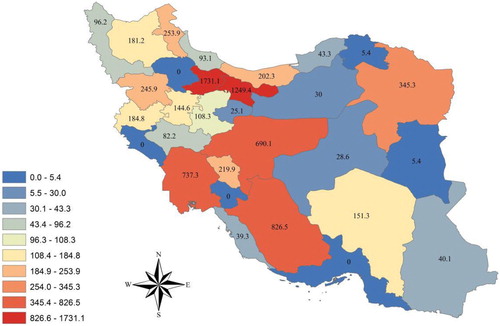
It is obvious from Figure that there is a concentration of production in the central and western regions of the country because these regions have less average annual temperature compared to the rest of the country.
According to the obtained results of production and consumption of energy, both mushroom production and biogas production from the compost waste in semi-cool climates are cost effective. In warm climates, biogas production is also cost effective but there is a high production cost in mushroom production. In cold climates like the Ardabil province, the study area that has the coldest climate, mushroom production is cost effective and the industry has a good spread but biogas production requires a little more cost. Fortunately, based on the balance calculations of energy production in the Ardabil province, the energy balance in biogas production is a positive number.
7. Reduction of carbon dioxide emissions
Carbon is one of the most important elements for living organisms and is also a part of the air and the soil. Carbon, nitrogen and water cycles are the three key events in terms of sustainable living on Earth. Carbon dioxide is an intermediate and also the most important form of exchange in the carbon cycle and must always be in balance. Imbalance of this cycle destroys habitability on Earth. For example, exuding a lot of carbon into the atmosphere leads to the temperature rise of Earth and decreasing carbon in the air cools the planet’s surface. The excessive use of fossil fuel leads to the production of carbon dioxide more than its consumption. If this continues, the balance of the carbon cycle will break down and cause massive greenhouse gas effect and global warming. As previously mentioned, the carbon dioxide is the most important of all greenhouse gases emitted in energy production (Li et al., Citation2016).
In this study, the produced methane fuel from the SMC was raised as an alternative fuel of natural gas. The natural gas fuel holds more than 96% of methane in Iran. Equation (12) presents the stoichiometric formula of methane combustion. Accordingly, 1 kg of methane fuel releases 2. 75 kg of carbon dioxide (Molar mass of CO2 per Molar mass of CH4 = 44 ÷ 16 = 2.75) (Faizollahzadeh Ardabili, Najafi, Ghaebi, Shamshirband, & Mostafaeipour, Citation2017; Najafi, Faizollahzadeh Ardabili, Shamshirband, Chau, & Rabczuk, Citation2018).
(12)
(12)
According to Table , the amount of methane produced from the anaerobic digestion of the SMC is 8690.8 × 103 m3 or 6231.3 tons where the density of methane is 0.717 kg/m3 (8690.8 × 0.717 = 6231.3). Results show that the combustion of 6231.3 tons of natural gas produces 15,578.3 tons of carbon dioxide and releases it to the atmosphere every year (6231.3 × 2.75 = 17,136.07).
In Photosynthesis process, the carbon dioxide is converted to organic materials by plants. Due to the fact that the contained organic carbon in the SMC is 29% (Table ), it can be assumed that approximately 29% of released carbon dioxide from the combustion of methane fuel of the SMC, is absorbed by plants. Therefore, by using the produced methane instead of natural gas, about 4969.4 tons (17,136.07 × 0.29 = 4969.4) less carbon dioxide is released into the atmosphere every year. Iran, by releasing 22.53 million tons of carbon dioxide per year, is ranked eighth among the top twenty CO2-emitting countries (Godfrey, Citation2004). Replacing methane produced from the SMC with natural gas fuel reduces 0.022% of the total annual production of carbon dioxide in Iran ((4969.4(22.53 × 10⁶)) × 100 = 0.022).
8. Economic approach to sustainable production of biogas from SMC
The main challenges of processing biomass energy are economic. Currently, the cost of energy production from biogas is a little more than other types of energy due to the technology used in it (Godfrey, Citation2004).
The SMC is one of the low-cost resources of biogas production in Iran. The Ardabil province is the coldest province in Iran and is the best example for the economic analysis of biogas production.
First, the costs related to the designed reactor were discussed. As previously mentioned, the designed reactor has a height of 2.5 m and a diameter of 5 m, and that its walls have conventional construction materials (brick and cement) with a thickness of 0.25 m, the ceilings and floors are made of concrete with a thickness of 0.1 m, and the glass-wool insulation with a thickness of 0.05 m was used to cover the reactor. Considering the price of building materials in Iran, the cost for the construction of the complex is around $2500–$3000 (Statistical Center of Iran, Citation2017).
The biogas reactor heating system includes boilers with heating pipes from the floor and the wall (ref) that costs around $1250. Labor costs, costs of installation and commissioning will be around $1000. Therefore, the cost of building and equipping the biogas reactor is about $4750 to $5250. If the cost of maintenance and depreciation is set at 10%, the total cost for the construction of biogas collection will be around $5225 to $5775 (Statistical Center of Iran, Citation2017).
Revenues from the production of biogas from the SMC can be divided into two parts: revenues from the sale of the remaining sludge in the digester of biogas as fertilizers and revenues from the sale of biogas. According to the calculations, the produced biogas from 12 tons of SMC (in one period of mushroom production) is about 667.19 m3. If the percentage of methane in biogas is considered to be 65%, the total produced methane is equal to 433.7 m3 (667.19 × 0.65 = 433.7). The price of 1 m3 of natural gas in Iran is about $0.05. Therefore, the revenues from the sale of biogas will be $21.68 (433.7 × 0.05 = 21.68), which is as gross revenue. In order to calculate the net revenue from the sale of biogas there is a need for subtracting the energy consumption cost from gross revenue (from the sale of biogas) as Equation (13):
(13)
(13)
Equation (7) presents the required thermal energy for a period of production (21 days) by (kW.h). by considering the heating value of biogas (equal to 5 kWh/m3), the required biogas for heating consumption in a period of production is as Equation (14):
(14)
(14)
By considering the percentage of methane in biogas equal to 65% and the price of 1 m3 of natural gas in Iran about 0.05$, energy consumption cost for a period of production is equal to Equation (15):
(15)
(15)
Figure indicates the trend of energy consumption cost, gross revenue and net revenue per month. Based on Figure , in the months with low average temperature, energy consumption cost has been raised and accordingly the net revenue has been decreased. The lowest net revenue is related to Jan. (4.25 $) and the highest net revenue is related to Aug. (14.83$). Therefore, the net revenue of the sale of biogas is in range of 4.25–14.83$ which is an insignificant amount, but the remaining sludge in the digester, which is sold as enriched nitrogen fertilizer, has a greater customer base in agriculture and horticulture sectors. Based on previous calculations for 12 tons of SMC (for a period), the volume of the produced biogas is 667.19 m3. By considering the biogas density (1.15 kg/m3 (Fardad, Citation2017)), the produced biogas is equal to 762.26 kg (667.19 × 1.15 = 767.26). Therefore, weight of residual material after fermentation in the reactor is equal to 11.23 tons of wet fertilizer with a moisture of 80% that is equal to 6.74 tons of organic nitrogen fertilizer with a moisture of 40% (11.23 × ((1–0.8) + 0.4) = 6.74). Currently, the price of organic fertilizers in Iran is $25/ton (Statistical Center of Iran, Citation2017). As a result, revenues from the sale of organic fertilizer per period of production is around $168.5 while mushroom farms sell the SMC at 2$/ton. Considering that the amount of SMC per 60 days is equal to 12 ton, revenues from the sale of SMC per month is equal to $12. Table shows the economic approach of sustainable production of biogas from the SMC.
Figure 9. The trend of cash flow per month.
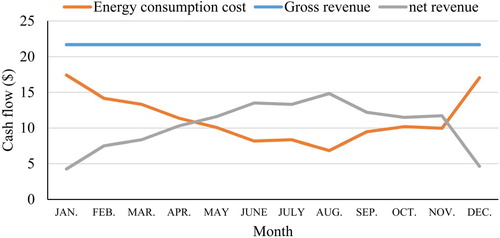
Table 4. Economic approach to sustainable production of biogas from SMC.
In this study, the payback period has been calculated by the use of net present value (NPV). NPV analyzes the profitability of a project. This factor describes the difference among current values of cash inflows and outflows and also, this factor is one of the main factors for analyzing the plans in economics. In this method, the cash flow (revenues and costs) is considered based on the discount rate and time. NPV is calculated by Equation (16) (Beaves, Citation1988; Shrieves & Wachowicz Jr, Citation2001):
(16)
(16)
where r is the discount rate, t is the year and n is the analytic horizon in year. Figure presents the NPV based on the discount rate in Iran (r = 0.08 (Statistical Center of Iran, Citation2017)) for both minimum and maximum construction costs.
Figure 10. The NPV flow for both minimum and maximum construction costs.
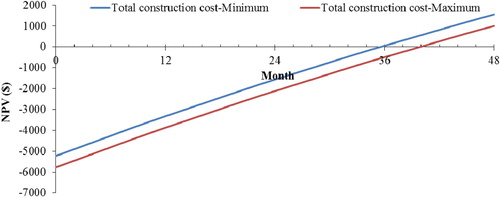
Figure shows the NPV graph based on the minimum and maximum total construction costs for the biogas production system. Considering that the volume of biogas production depends on the average monthly temperature, and by considering all revenues from the sale of biogas and fertilizer and a number of initial costs and maintenance costs for the production of biogas, it was found that after 36 months in case of considering the minimum construction cost and 40 months in case of considering the maximum construction cost of biogas production system, the initial cost of investment for the production of biogas from the SMC is reversible and profitable (Figure ). Accordingly, after the third year, the owner will have pure and sustainable income out of it.
The warnings about global warming have been extremely clear for a long time. We are facing a global climate crisis and it is getting worse by the day. We are entering a period of its consequences. Meanwhile, a convention had been organized with the participation of some countries and its members committed to preventing pollution from the GHG emissions resulting from industrial activities. As of December 2016, 192 countries and the European Union have signed the agreement. Around 125 among them have ratified or acceded to the agreement, most notably China, the United States, and India, three of the largest greenhouse gas emitters among the signatories. These three countries together contribute about 42% of the total emission (Collection, Citation8 July Citation2016; ‘https://en.wikipedia.org/wiki/Paris_Agreement’). Iran’s share in this agreement is about 1.3% of the total GHG emission. In order to decrease each ton of carbon, a certificate of carbon emissions is allocated to the owner of the projects. On this basis, biogas industrialists can receive a CER after performing the plan and taking required achievements that can be a source of revenue for them (Secretariat, Citation2011).
The demand side of the permits depends on the evolution of the underlying regulated pollution. Under the EU ETS, CO2 pollution emissions are regulated. The drivers of the underlying emissions include both long and short term pollution abatement options, economic cycles, energy-related prices, and weather conditions (Chesney, Gheyssens, & Taschini, Citation2013).
9. Conclusion
The spent mushroom compost (SMC) with an annual production of 414,491.7 (tons.year−1) has a potential of 8690.8 (1000 m3.year−1) methane production in Iran. The results of a lab-scale biogas production from SMC, indicated that the cumulative biogas production at 35°C and 55°C was 314.11 and 364.8 L/kg.VS, respectively. By considering the energy balance of biogas production, the minimum permitted temperature for biogas production was obtained to be −13.77 and +1.08°C at mesophilic and thermophilic production conditions, respectively. The results show that the produced biogas energy from the SMC in one period of production is equal to 277.95 kW.h/ton at 35°C and 322.84 kW.h/ton at 55°C.
The study of sustainability and confidence of the system showed that the biogas production system can be sustainable at 35°C in all provinces of the country. However, at a temperature of 55°C, there is no sustainable condition in most of the provinces in the country.
July and August have the highest potential for the methane production (1028.9 × 103 m3 and 1000.9 × 103 m3, respectively) and January and December have the lowest potential of methane production (395.8 × 10³ m3 and 451.7 × 10³ m3, respectively) in Iran.
By replacing the produced methane from SMC in Iran with natural gas, about 4517.6 tons less carbon dioxide was emitted into the atmosphere, annually. Considering the concerns on global warming and the commitment of countries to reduce the GHG emissions according to the Treaty of Paris, it can be said that using the produced biogas can be helpful.
Ardabil province with an average annual temperature of 10°C is the coldest province of Iran hence, it was selected as a province with the most difficult condition for biogas production in the country and was the area of study. The economic calculations in Ardabil province showed that by considering all revenues from the sale of biogas and fertilizer, and the amount of initial cost and maintenance cost of biogas production, the initial cost of investment for the construction of biogas from the SMC can be returned after 36–40 months and the system will act as a pure and sustainable source of income for its owners.
Generally, ambient temperature (Ta) was a factor that affects the biogas production potential, sustainability and confidence of system, GHG emission and cash flow. Therefore in cold climates mushroom production is cost effective and the industry has a good spread but biogas production requires a little more cost. But, in warm climates, due to the high production cost in mushroom production biogas production form SMC is not cost effective.
Disclosure statement
No potential conflict of interest was reported by the authors.
ORCID
Sina Faizollahzadeh Ardabili http://orcid.org/0000-0002-7744-7906
Related Research Data
References
- Abdoli, M., & Pazekey, M. (2012). Potential of biomass energy technologies in rural areas. Iran: Motahari Publication.
- Afazeli, H., Jafari, A., Rafiee, S., & Nosrati, M. (2014). An investigation of biogas production potential from livestock and slaughterhouse wastes. Renewable and Sustainable Energy Reviews, 34, 380–386. doi: 10.1016/j.rser.2014.03.016
- Afsharzade, N., Papzan, A., Ashjaee, M., Delangizan, S., Van Passel, S., & Azadi, H. (2016). Renewable energy development in rural areas of Iran. Renewable and Sustainable Energy Reviews, 65, 743–755. doi: 10.1016/j.rser.2016.07.042
- Agostini, A., Battini, F., Giuntoli, J., Tabaglio, V., Padella, M., Baxter, D., … Amaducci, S. (2015). Environmentally sustainable biogas? The key role of manure co-digestion with energy crops. Energies, 8(6), 5234–5265. doi: 10.3390/en8065234
- Agostini, A., Battini, F., Padella, M., Giuntoli, J., Baxter, D., Marelli, L., & Amaducci, S. (2016). Economics of GHG emissions mitigation via biogas production from sorghum, maize and dairy farm manure digestion in the Po valley. Biomass and Bioenergy, 89, 58–66. doi: 10.1016/j.biombioe.2016.02.022
- American Public Health Association (APHA). (2011). Standard methods for the determination of water and waste water. Washington, DC: APHA.
- Azizi, A. (2008). Abstract of strategic plans to promote edible mushrooms of research, training and agricultural organization, Ministry of Agriculture.
- Bahrami, M., & Abbaszadeh, P. (2013). An overview of renewable energies in Iran. Renewable and Sustainable Energy Reviews, 24, 198–208. doi: 10.1016/j.rser.2013.03.043
- Bahrami, M., & Abbaszadeh, P. (2016). Development a scenario-based model for Iran’s energy future. Renewable and Sustainable Energy Reviews, 62, 963–970. doi: 10.1016/j.rser.2016.03.053
- Beaves, R. G. (1988). Net present value and rate of return: Implicit and explicit reinvestment assumptions. The Engineering Economist, 33(4), 275–302. doi: 10.1080/00137918808966958
- Ben Jebli, M., & Ben Youssef, S. (2015). The role of renewable energy and agriculture in reducing CO2 emissions: Evidence for North Africa countries.
- Beyer, D. (1999). Spent mushroom substrate. Online. mushroom spawn. cas. psu. edu/spent. htm.
- Budiyono, B., Seno, J., & Sunarso, S. (2009). Influence of inoculum content on performance of anaerobic reactors for treating cattle manure using Rumen fluid inoculum. International Journal of Engineering and Technology, 1(3), 109–116.
- Chamy, R., & Vivanco, E. (2006). Biogas potential in Chile. Bioenergy – I: From Concept to Commercial Processes. Retrieved from https://dc.engconfintl.org/bioenergy_i/16.
- Chesney, M., Gheyssens, J., & Taschini, L. (2013). Environmental finance and investments. Berlin: Springer-Verlag.
- Cho, J. K., Park, S. C., & Chang, H. N. (1995). Biochemical methane potential and solid state anaerobic digestion of Korean food wastes. Bioresource Technology, 52(3), 245–253. doi: 10.1016/0960-8524(95)00031-9
- Chong, C., & Rinker, D. L. (1994). Use of spent mushroom substrate for growing containerized woody ornamentals: An overview. Compost Science & Utilization, 2(3), 45–53. doi: 10.1080/1065657X.1994.10757933
- Collection, U. N. T. (8 July 2016). Paris Agreement [Data set].
- Derakhshan, S., & Nourbakhsh, A. (2008). Experimental study of characteristic curves of centrifugal pumps working as turbines in different specific speeds. Experimental Thermal and Fluid Science, 32(3), 800–807. doi: 10.1016/j.expthermflusci.2007.10.004
- dos Santos, I. F. S., Barros, R. M., & Tiago Filho, G. L. (2016). Electricity generation from biogas of anaerobic wastewater treatment plants in Brazil: An assessment of feasibility and potential. Journal of Cleaner Production, 126, 504–514. doi: 10.1016/j.jclepro.2016.03.072
- Engineers, T. A. o. G. (2006). VDI 4630-Fermentation of organic materials: Characterisation of the substrate, sampling, collection of material data, fermentation test.
- Faizollahzadeh Ardabili, Najafi, B., Ghaebi, H., Shamshirband, S., & Mostafaeipour, A. (2017). A novel enhanced exergy method in analysing HVAC system using soft computing approaches: A case study on mushroom growing hall. Journal of Building Engineering, 13, 309–318. doi: 10.1016/j.jobe.2017.08.008
- Fang, W., Zhang, P., Gou, X., Zhang, H., Wu, Y., Ye, J., & Zeng, G. (2016). Volatile fatty acid production from spent mushroom compost: Effect of total solid content. International Biodeterioration & Biodegradation, 113, 217–221. doi: 10.1016/j.ibiod.2016.03.025
- Fardad, K. (2017). Producing biogas from medicinal plants (MSc thesis). University of Mohaghegh Ardabili, Ardabil, Iran.
- Fardad, K., Najafi, B., Ardabili, S. F., Mosavi, A., Shamshirband, S., & Rabczuk, T. (2018). Biodegradation of medicinal plants waste in an anaerobic digestion reactor for biogas production.
- Fidanza, M. A., Sanford, D. L., Beyer, D. M., & Aurentz, D. J. (2010). Analysis of fresh mushroom compost. HortTechnology, 20(2), 449–453. doi: 10.21273/HORTTECH.20.2.449
- Fleming, R., & MacAlpine, M. (2006). Feasibility of processing spent mushroom substrate to recover additional value. Mushroom News-Kennett Square then Washington, 54(11), 6.
- Ghorashi, A. H., & Rahimi, A. (2011). Renewable and non-renewable energy status in Iran: Art of know-how and technology-gaps. Renewable and Sustainable Energy Reviews, 15(1), 729–736. doi: 10.1016/j.rser.2010.09.037
- Godfrey, B. (2004). Renewable energy: Power for a sustainable development. Oxford: Oxford University Press.
- Grujić, M., Dojnov, B., Potočnik, I., Duduk, B., & Vujčić, Z. (2015). Spent mushroom compost as substrate for the production of industrially important hydrolytic enzymes by fungi Trichoderma spp. and Aspergillus niger in solid state fermentation. International Biodeterioration & Biodegradation, 104, 290–298. doi: 10.1016/j.ibiod.2015.04.029
- Guo, M., Chorover, J., & Fox, R. H. (2001). Effects of spent mushroom substrate weathering on the chemistry of underlying soils. Journal of Environment Quality, 30(6), 2127–2134. doi: 10.2134/jeq2001.2127
- Gutiérrez-Gutiérrez, S. C., Coulon, F., Jiang, Y., & Wagland, S. (2015). Rare earth elements and critical metal content of extracted landfilled material and potential recovery opportunities. Waste Management, 42, 128–136. doi: 10.1016/j.wasman.2015.04.024
- Hamzeh, Y., Ashori, A., Mirzaei, B., Abdulkhani, A., & Molaei, M. (2011). Current and potential capabilities of biomass for green energy in Iran. Renewable and Sustainable Energy Reviews, 15(9), 4934–4938. doi: 10.1016/j.rser.2011.07.060
- Heo, N. H., Park, S. C., & Kang, H. (2004). Effects of mixture ratio and hydraulic retention time on single-stage anaerobic co-digestion of food waste and waste activated sludge. Journal of Environmental Science and Health, Part A, 39(7), 1739–1756. doi: 10.1081/ESE-120037874
- Holman, J. P. (1972). Heat transfer. 3rd ed. New York, NY: McGraw-Hill.
- Incropera, F. P., & De Witt, D. P. (1985). Fundamentals of heat and mass transfer.
- Kratky, L., Jirout, T., & Nalezenec, J. (2012). Lab-scale technology for biogas production from lignocellulose wastes. Acta Polytechnica, 52, 3.
- Kulcu, R., Sönmez, İ, Yaldiz, O., & Kaplan, M. (2008). Composting of spent mushroom compost, carnation wastes, chicken and cattle manures. Bioresource Technology, 99(17), 8259–8264. doi: 10.1016/j.biortech.2008.03.074
- Levanon, D., & Danai, O. (1995). Chemical, physical and microbiological considerations in recycling spent mushroom substrate. Compost Science & Utilization, 3(1), 72–79. doi: 10.1080/1065657X.1995.10701771
- Li, T., Baležentis, T., Makutėnienė, D., Streimikiene, D., & Kriščiukaitienė, I. (2016). Energy-related CO2 emission in European Union Agriculture: Driving forces and possibilities for reduction. Applied Energy, 180, 682–694. doi: 10.1016/j.apenergy.2016.08.031
- Liu, X., Gao, X., Wang, W., Zheng, L., Zhou, Y., & Sun, Y. (2012). Pilot-scale anaerobic co-digestion of municipal biomass waste: Focusing on biogas production and GHG reduction. Renewable Energy, 44, 463–468. doi: 10.1016/j.renene.2012.01.092
- Long, J. H., Aziz, T. N., Francis, L., & Ducoste, J. J. (2012). Anaerobic co-digestion of fat, oil, and grease (FOG): A review of gas production and process limitations. Process Safety and Environmental Protection, 90(3), 231–245. doi: 10.1016/j.psep.2011.10.001
- Luo, W. H., Yuan, J., Luo, Y. M., Li, G. X., Nghiem, L. D., & Price, W. E. (2014). Effects of mixing and covering with mature compost on gaseous emissions during composting. Chemosphere, 117, 14–19. doi: 10.1016/j.chemosphere.2014.05.043
- Meng, L., Li, W., Zhang, S., Wu, C., & Lv, L. (2016). Feasibility of co-composting of sewage sludge, spent mushroom substrate and wheat straw. Bioresource Technology, 226, 39–45. doi: 10.1016/j.biortech.2016.11.054
- Moghaddam, N. B., Mousavi, S. M., Nasiri, M., Moallemi, E. A., & Yousefdehi, H. (2011). Wind energy status of Iran: Evaluating Iran’s technological capability in manufacturing wind turbines. Renewable and Sustainable Energy Reviews, 15(8), 4200–4211. doi: 10.1016/j.rser.2011.07.029
- Moreda, I. L. (2016). The potential of biogas production in Uruguay. Renewable and Sustainable Energy Reviews, 54, 1580–1591. doi: 10.1016/j.rser.2015.10.099
- Mostafaeipour, A., & Abarghooei, H. (2008). Harnessing wind energy at Manjil area located in North of Iran. Renewable and Sustainable Energy Reviews, 12(6), 1758–1766. doi: 10.1016/j.rser.2007.01.029
- Mshandete, A., Kivaisi, A., Rubindamayugi, M., & Mattiasson, B. (2004). Anaerobic batch co-digestion of sisal pulp and fish wastes. Bioresource Technology, 95(1), 19–24. doi: 10.1016/j.biortech.2004.01.011
- Mudhoo, A., & Mohee, R. (2007). Overall heat transfer coefficients in organic substrates composting. Journal of Environmental Informatics, 9(2), 87–99. doi: 10.3808/jei.200700090
- Nabavi-Pelesaraei, A., Bayat, R., Hosseinzadeh-Bandbafha, H., Afrasyabi, H., & Chau, K.-w. (2017). Modeling of energy consumption and environmental life cycle assessment for incineration and landfill systems of municipal solid waste management – A case study in Tehran Metropolis of Iran. Journal of Cleaner Production, 148, 427–440. doi: 10.1016/j.jclepro.2017.01.172
- Najafi, B., & Faizollahzadeh Ardabili, S. (2018). Application of ANFIS, ANN, and logistic methods in estimating biogas production from spent mushroom compost (SMC). Resources, Conservation and Recycling, 133, 169–178. doi: 10.1016/j.resconrec.2018.02.025
- Najafi, B., Faizollahzadeh Ardabili, S., Mosavi, A., Shamshirband, S., & Rabczuk, T. (2018). An intelligent artificial neural network-response surface methodology method for accessing the optimum biodiesel and diesel fuel blending conditions in a diesel engine from the viewpoint of exergy and energy analysis. Energies, 11(4), 860. doi: 10.3390/en11040860
- Najafi, B., Faizollahzadeh Ardabili, S., Shamshirband, S., Chau, K.-w., & Rabczuk, T. (2018). Application of ANNs, ANFIS and RSM to estimating and optimizing the parameters that affect the yield and cost of biodiesel production. Engineering Applications of Computational Fluid Mechanics, 12(1), 611–624. doi: 10.1080/19942060.2018.1502688
- Najafi, G., Ghobadian, B., Tavakoli, T., & Yusaf, T. (2009). Potential of bioethanol production from agricultural wastes in Iran. Renewable and Sustainable Energy Reviews, 13(6), 1418–1427. doi: 10.1016/j.rser.2008.08.010
- Noble, R., & Gaze, R. (1996). Preparation of mushroom (Agaricus bisporus) composts in controlled environments: Factors influencing compost bulk density and productivity. International Biodeterioration & Biodegradation, 37(1–2), 93–100. doi: 10.1016/0964-8305(95)00072-0
- Noorollahi, Y., Kheirrouz, M., Asl, H. F., Yousefi, H., & Hajinezhad, A. (2015). Biogas production potential from livestock manure in Iran. Renewable and Sustainable Energy Reviews, 50, 748–754. doi: 10.1016/j.rser.2015.04.190
- Noorollahi, Y., Yousefi, H., Ehara, S., & Itoi, R. (2008). Geothermal energy development in Iran. Presented at the Workshop for Decision Makers on Direct Heating Use of Geothermal Resources in Asia.
- O’Shea, R., Wall, D., & Murphy, J. (2016). Modelling a demand driven biogas system for production of electricity at peak demand and for production of biomethane at other times. Bioresource Technology, 216, 238–249. doi: 10.1016/j.biortech.2016.05.050
- Raja, S. A., & Lee, C. L. R. (2012). Biomethanation of water hyacinth using additives under forced mixing in a bio reactor. International Journal of Chemical Research, 2(4), 15–24.
- Reinelt, T., Liebetrau, J., & Nelles, M. (2016). Analysis of operational methane emissions from pressure relief valves from biogas storages of biogas plants. Bioresource Technology, 217, 257–264.
- Rutz, D., Mergner, R., & Janssen, R. (2012). Sustainable heat use of biogas plants. A Handbook, Biogas Heat, WIP Renewable Energies, Munich, Germany.
- Salminen, E. A., & Rintala, J. A. (2002). Semi-continuous anaerobic digestion of solid poultry slaughterhouse waste: Effect of hydraulic retention time and loading. Water Research, 36(13), 3175–3182. doi: 10.1016/S0043-1354(02)00010-6
- Sathianathan, M. (1975). Bio-gas: Achievements & challenges: Association of Voluntary Agencies for Rural Development: distributors, Lakshmi Book Store.
- Satyanarayan, S., & Murkute, P. (2008). Biogas production enhancement by Brassica compestries amendment in cattle dung digesters. Biomass and Bioenergy, 32(3), 210–215. doi: 10.1016/j.biombioe.2007.09.008
- Secretariat, C. C. (2011). Report of the Conference of the Parties serving as the meeting of the Parties to the Kyoto Protocol on its seventh session, held in Durban from 28 November to 11 December 2011: Bonn: Climate Change Secretariat.
- Shrieves, R. E., & Wachowicz Jr, J. M. (2001). Free Cash Flow (FCF), Economic Value Added (EVA™), and Net Present Value (NPV): A reconciliation of variations of Discounted-Cash-Flow (DCF) valuation. The Engineering Economist, 46(1), 33–52. doi: 10.1080/00137910108967561
- Statistical Center of Iran. (2017). Retrieved from http://amar.org.ir.
- Statistics of Agriculture Organization of Iran. (2014–2015). Agricultural organization of Iran.
- U S Environmental protection Agency. (2001). Method 1684: Total, fixed and volatile solids in water, solids and biodsolids.
- Uddin, W., Khan, B., Shaukat, N., Majid, M., Mujtaba, G., Mehmood, A., … Almeshal, A. M. (2016). Biogas potential for electric power generation in Pakistan: A survey. Renewable and Sustainable Energy Reviews, 54, 25–33. doi: 10.1016/j.rser.2015.09.083
- Uusitalo, V., Havukainen, J., Manninen, K., Höhn, J., Lehtonen, E., Rasi, S., … Horttanainen, M. (2014). Carbon footprint of selected biomass to biogas production chains and GHG reduction potential in transportation use. Renewable Energy, 66, 90–98. doi: 10.1016/j.renene.2013.12.004
- VDI4630. (2006). Fermentation of organic materials: Characterisation of the substrate, sampling, collection of material data, fermentation test. VDI, Gesellschaft, Energietechnik, The Association of German Engineers.
- Wang, X., Yang, G., Feng, Y., Ren, G., & Han, X. (2012). Optimizing feeding composition and carbon–nitrogen ratios for improved methane yield during anaerobic co-digestion of dairy, chicken manure and wheat straw. Bioresource Technology, 120, 78–83. doi: 10.1016/j.biortech.2012.06.058
- Williams, B., McMullan, J., & McCahey, S. (2001). An initial assessment of spent mushroom compost as a potential energy feedstock. Bioresource Technology, 79(3), 227–230. doi: 10.1016/S0960-8524(01)00073-6
- Wisniewska, G., & Pankiewicz, T. (1989). Evaluation of the suitability of spent mushroom substrate for tulip cultivation. Prace Instytutu Sadownictura kwiaciarstwa w skerniewicack, 14, 7–13.
- Zhang, B., & Chen, B. (2016). Dynamic hybrid life cycle assessment of CO2 emissions of a typical biogas project. Energy Procedia, 104, 396–401. doi: 10.1016/j.egypro.2016.12.067
- Zhang, R., El-Mashad, H. M., Hartman, K., Wang, F., Liu, G., Choate, C., & Gamble, P. (2007). Characterization of food waste as feedstock for anaerobic digestion. Bioresource Technology, 98(4), 929–935. doi: 10.1016/j.biortech.2006.02.039
- Zhao, X.-I., Li, B.-q., Ni, J.-p., & Xie, D.-t. (2016). Effect of four crop straws on transformation of organic matter during sewage sludge composting. Journal of Integrative Agriculture, 15(1), 232–240. doi: 10.1016/S2095-3119(14)60954-0