
 ?Mathematical formulae have been encoded as MathML and are displayed in this HTML version using MathJax in order to improve their display. Uncheck the box to turn MathJax off. This feature requires Javascript. Click on a formula to zoom.
Abstract
The difference of the aerodynamic influence of two engine models – the Flow Through Nacelle (FTN) and With Powered Nacelle (WPN) – on BWB300 airframe is analyzed by using the 3-D unsteady compressible Reynolds-Averaged Navier-Stokes (RANS) computation. The results indicate that at cruise condition, the engine shape is a primary factor affecting the BWB airframe upper fuselage surface flow, the two engine models exhibit a similar aerodynamic influence on the BWB airframe. However, at takeoff condition, the two engine models’ aerodynamic influence on the airframe is different, because of the air suction caused by the WPN engine model affecting the airframe upper fuselage surface flow obviously. Moreover, at both cruise and takeoff conditions, the tube formed by the engine and airframe shape changes the surface flow under the engine and the air suction caused by the engine power accelerates the surface flow near the engine.
1. Introduction
In 1970s, the first high bypass ratio engine entered service (Peacock & Sadler, Citation1992). As the bypass ratio and thus the nacelle diameter becomes larger, the interference between the engine and airframe becomes more and more serious (Brodersen, Citation2002; El-Sayed, Citation2017). Engine-airframe integration technology becomes very important for aircraft development (Hoheisel, Citation1997).
The Blended Wing Body is a revolutionary concept offering advantages of aerodynamic performance and fuel economy (Larkin & Coates, Citation2017; Reist & Zingg, Citation2016). Engine installation on conventional transport is often mounted under the wing (Oliveira, Trapp, & Puppin-Macedo, Citation2003; Stankowski, MacManus, Robinson, & Sheaf, Citation2017). However, the engine of BWB is usually located over its center body (Ammar, Legros, & Trépanier, Citation2017; Plumley & Zeune, Citation2017). Positioning the engine over the center-body may distort its lift distribution, thus creating poor cruise aerodynamic (Okonkwo & Smith, Citation2016). This demonstrates a need for careful engine-airframe integration design (Kellari, Crawley, & Cameron, Citation2017). To achieve the expected integration design, it is necessary to ensure the engine aerodynamic influence on BWB airframe aerodynamic is understood. The aerodynamic influence of the engine could be examined by using wind tunnel testing or numerical simulation. The process of testing the engine influence in wind tunnel, especially using powered engine (normally Turbine Power Simulator method or Ejector Powered method), is complex and expensive (Ruiz-Calavera, Funes-Sebastian, & Perdones-Diaz, Citation2010; Zhaoguang, Yingchun, & Jiangtao, Citation2014). Compared to wind tunnel testing, numerical simulation (Abadi et al., Citation2020; Farzaneh-Gord et al., Citation2019) is not only more convenient but also low cost.
There are usually two types of engine models used for numerical computation: Flow Through Nacelle (FTN) and With Powered Nacelle (WPN) (Kozakiewicz & Frant, Citation2013; Li, Gao, Huang, & Zhao, Citation2013). FTN simulates only the outside shell with no power, and the air can flow through it, while WPN is used to simulate the powered engine’s inflow and outflow influences by setting the appropriate inlet and outlet boundary conditions. The research of the engine influences on conventional transport aerodynamic by using FTN/WPN models has been going for decades now (Lange, Citation1986; Stankowski et al., Citation2017), but the corresponding research on BWB only emerged in the last few years. Recently, Boeing/NASA in its Environmentally Responsible Aviation (ERA) project has performed a series of research on the Ultra-High Bypass integration of HWB (Hybrid Wing Body, also referred to as the BWB) using both FTN/WPN models (Deere, Luckring, McMillin, Flamm, & Roman, Citation2016; Flamm, James, & Bonet, Citation2016; Schuh et al., Citation2016).
BWB300 is a 300-passenger BWB civil aircraft. It is designed by a team of Northwestern Polytechnical University, which is located in Xi’an, China. Figure shows the primary model of BWB300.
Figure 1. The BWB300 primary model.

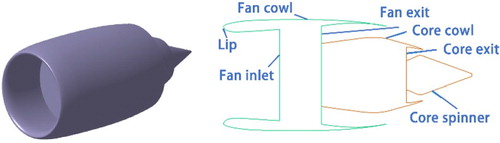
Figures and show the FTN and WPN models for BWB300, respectively. Notably, the fan cowl and lip shape of these two models are the same, and the length of FTN is about 4.8 m. How about the FTN/WPN influences on BWB300 airframe aerodynamic, and what are the differences between them? In this work, they were performed by using the numerical simulation method.
Figure 2. FTN model for BWB300.
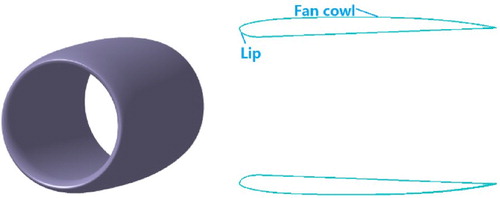
Figure 3. WPN model for BWB300.
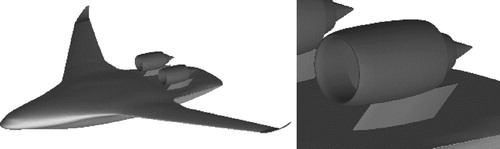
In order to simulate the difference between FTN and WPN models on the aerodynamic performance of BWB300 airframe, three models need to be calculated: the airframe with FTN (Figure ), the airframe with WPN (Figure ), and the airframe alone. These were hereafter referred to as the FTN configuration (the airframe with FTN), WPN configuration (the airframe with WPN), and Clean configuration (the airframe alone). The pylons of the FTN and WPN configurations were the same.
Figure 4. FTN configuration model.
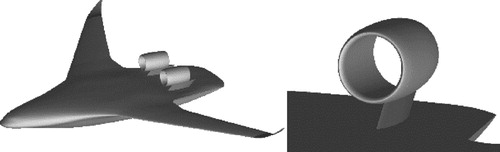
Figure 5. WPN configuration model.
The cruise condition and takeoff condition were calculated for the three configurations. The WPN configuration’s boundary conditions for power simulation are shown in Table , where Ma is the free-stream Mach number; Re is the calculation Reynolds number; and
are the total temperature at the fan exit and core exit, respectively;
and
are the mass flux at fan inlet and core exit, respectively;
is the mass flux at fan inlet.
Table 1. WPN configuration computational states and boundary conditions for power simulation.
2. Computational method
The governing equation for the three configurations for aerodynamic computation was the Reynolds-Averaged Navier-Stokes (RANS) equation, which is given as:
(1)
(1) where
was the conservative variable;
was the inviscid flux;
was the viscous flux.
The finite volume method was applied to solve the RANS equation, the second-order upwind Roe-FDS scheme was applied to discretize the inviscid spatial term, and the second-order central difference scheme was applied to discretize the viscid spatial term. The turbulence model used was the k-omega SST model (Menter, Citation1994) and the time-stepping method was the approximate factorization (AF) implicit time-marching method (Gang, Dong, Zhenli, & Zeyu, Citation2019). To accelerate convergence, the multi-grid method was applied.
All configuration computing grids are multi-block O-H structured grids. To maintain grid consistency; the FTN configuration grid was generated from the WPN configuration grid by filling the WPN inner solid area with grids, the WPN configuration grid was generated from the Clean configuration grid by adding the pylon and nacelle blocks. The grid far-field boundary distance was about 10 body lengths and a characteristic inflow and outflow boundary condition was applied to it. All solid surfaces were set as the no-slip adiabatic wall. The symmetry boundary condition was used to generate only a half model grid. It should be noted that for the WPN configuration, the powered simulation was computed by setting appropriate boundary conditions at the fan inlet, fan exit, and core exit, which were shown in Table .
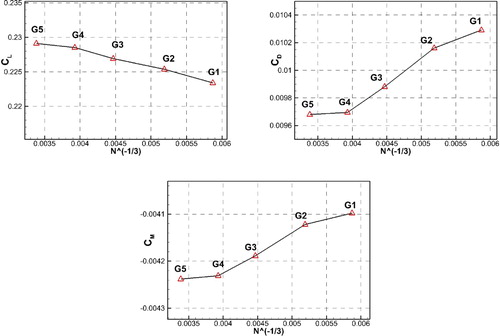
A grid convergence study was applied to ensure the reliability of the numerical solution. The WPN configuration was calculated using five levels of grids at 0.85 Ma. The volume cell growth ratio was 1.5, from 4.94 million volume grids to 25.81 million volume grids. The CPU used for calculation was 40 cores 80 threads, and the RAM was 128GB. The aerodynamic forces coefficient results are shown in Figure , in which G5 is the finest grid, G1 is the coarsest grid, N is the grid total volume cells, represents the lift coefficient,
represents the drag coefficient,
represents the pitch moment coefficient. The results indicated that when the number of volume cells was approximately 16.51 million (G4), the grid could be considered reliable. y+ was approximately 1, in the boundary layer the two adjacent grid nodes size growth rate was 1.18. So the G4 grid was used in the later calculation.
Figure 6. The five levels of WPN configuration grids aerodynamic forces at 1.5° (high speed).
The WPN volume grid configuration is shown in Figure , while the surface grids near the engine of the WPN and FTN configurations are shown in Figure .
Figure 7. Volume grid of the WPN configuration.
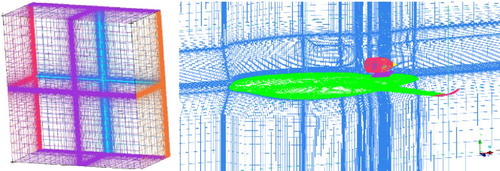
Figure 8. Surface grids of the WPN and FTN configurations.
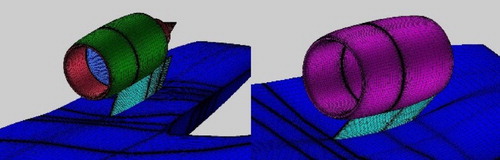
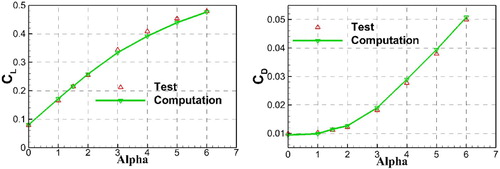
Figure shows RANS computation results and wind tunnel test results of the Clean configuration without winglet. The wind tunnel test was carried out in AVIC Aerodynamics Research Institute F-9 wind tunnel. The wind tunnel testing Mach number was 0.85, Reynolds number was 7.26e6. RANS computation was carried out under the same condition with the G4 grid. In the figure, Alpha represents the angle of attack. It can be seen from the figure that the computation and test data are in good agreement. Therefore, this shows that the results getting from the grid generation strategy and computation method used in this paper are reliable.
Figure 9. Aerodynamic coefficient results of computation and test for Clean configuration without winglet.
3. Results and discussion
3.1. The aerodynamics at cruise condition
3.1.1. The aerodynamic force coefficients at cruise condition
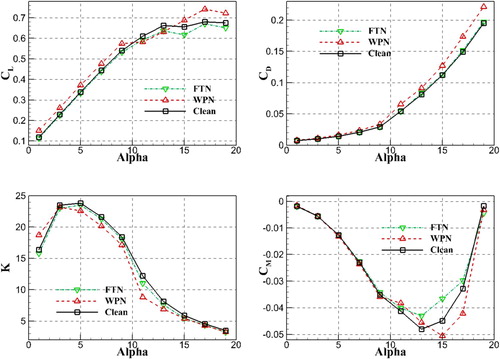
The aerodynamic force coefficients of the three configurations at cruise condition were compared while excluding the aerodynamic forces on the nacelle and pylon. The aerodynamic coefficients were calculated based on the airframe reference area. The aerodynamic force coefficients of the at cruise condition three airframe configurations are shown in Figure . represents the lift to drag ratio.
Figure 10. Aerodynamic force coefficients of the at cruise condition three configurations.
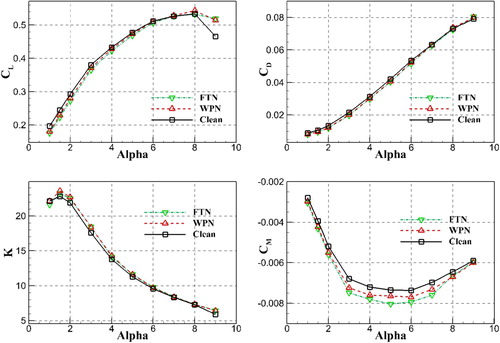
As can be seen from Figure , at cruise condition, the trends of all curves were the same, with the stalling occurring at 9° each time and only minor overall differences. Specifically, the differences between the aerodynamic forces of the FTN and WPN configurations were small, and ,
,
,
of the WPN configuration were all greater than the FTN configuration. The max
difference was less than 3%, the max
difference was less than 3%, the max
difference was about 6% and the max
difference was less than 3%. The difference between
,
,
,
of the FTN and Clean configuration were larger than the respective differences between the FTN and WPN configuration, with those values being lower than those of the Clean configuration except the ones near the stall angle. Moreover, the Clean configuration
decreased much more than the other two configurations at 9°. Therefore, considering the abovementioned comparison of the aerodynamic force coefficients curves at cruise condition, it was concluded that both FTN and WPN reduce the aerodynamic force on the airframe, except near the stall angle. In addition, the FTN and WPN influence on the airframe aerodynamic forces were nearly the same.
The difference between the aerodynamic forces of these configurations is caused by the difference of the surface flow.
3.1.2 Surface flow at cruise condition
The upper surface limiting streamlines and pressure contour of FTN with WPN and FTN with Clean configuration at cruise condition with variable angles of attack (1.5°∼3°) are shown in Figure . When comparing the upper surface’s limiting streamlines and pressure contour of the FTN/WPN configuration, it can be seen that their upper surface limiting streamlines and pressure contour were very similar. In contrast, there was a significant difference between the main shock wave location on the FTN/Clean configuration. Due to the FTN installation, the upper surface main shock wave position moved forward.
Figure 11. Upper surface limiting streamlines and pressure contour of FTN/WPN and FTN/Clean configurations at different angles (cruise condition).
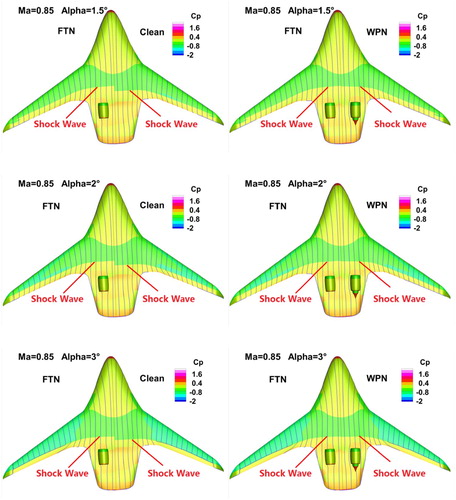
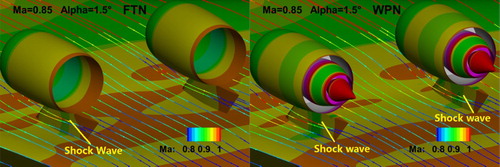
To demonstrate this result more clearly, the 1.5° state (cruise state) was analyzed carefully as an example. The airframe pressure coefficient distribution on the engine symmetrical plane of the three configurations at 1.5° are shown in Figure , in the figure, is the pressure coefficient. It shows that on the engine symmetrical plane, the pressure distribution of the FTN/WPN configurations was nearly the same, except for the difference near the engine. For both FTN/WPN installations, the upper surface main shock wave position moved forward while also decreasing in strength. A weak shock wave occurred at the nacelle inlet for both configurations, with the shock wave of the WPN being a little stronger.
Figure 12. Airframe pressure coefficient distribution on the engine symmetrical plane of the three configurations at 1.5° (cruise condition).
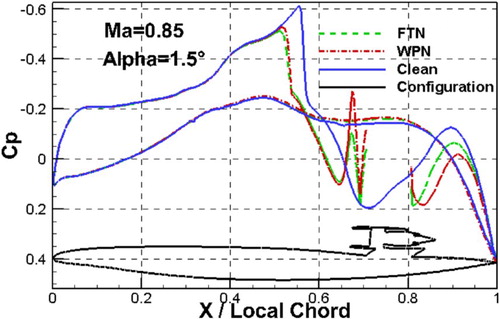
Figure shows the pressure coefficient distribution for different spanwise sections of the three configurations at 1.5°. Except for the difference in the airframe upper surface near the engine, the pressure distributions of the FTN/WPN configurations were nearly the same. In addition, the pressure distribution of both configurations on the wing was almost the same. For both the FTN/WPN installations, the upper surface main shock wave position for all sections moved forward; on the wing, when the distance was far from the engine in the spanwise direction, the engine influences weakened. Moreover, it can be seen that as the flow under the nacelle of both configurations accelerated due to the tube (Ghalandari, Shamshirband, Mosavi, & Chau, Citation2019) formed by the nacelle and airframe, shock waves appeared on both configuration pylons. The shock wave of the WPN configuration pylons occurred at both the centerline and wing sides, with the shock wave at the pylon wing side being slightly stronger. As can be seen in Figure , the shock wave of the FTN configuration pylons only occurred at the pylon forward to the wing side. These results indicated that the flow at the wing side was more intense than at the centerline side for both configurations.
Figure 13. Pressure coefficient distribution for different spanwise sections of the three configurations at 1.5° (cruise condition).
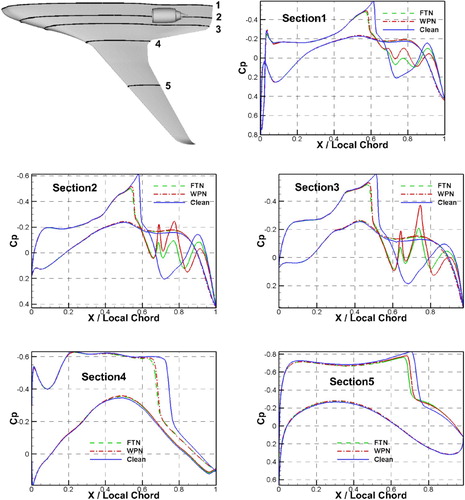
Figure 14. Pressure contour and volume streamlines near the engine of FTN and WPN configurations at 1.5° (cruise condition).
At cruise condition, the surface flow of the FTN/WPN configurations were also nearly the same, except for the flow near the engine. The power influence range of WPN configuration was near the engine, it would accelerate the surface flow under the engine and generated a new shock wave on the shock-free pylon of the FTN configuration. This makes the lift and drag of all WPN configurations greater than that of the FTN configurations. The flow distribution changes at the back of the airframe should also somewhat increase the nose-down pitch moment.
3.2. The aerodynamic at takeoff condition
3.2.1. The aerodynamic force coefficients at takeoff condition
Figure shows the aerodynamic force coefficients of the at takeoff condition three airframe configurations. From the figure, it could be known, at takeoff condition, the differences between the FTN and WPN configurations aerodynamic forces were noticeable, especially at high angles, while the difference between the FTN and Clean configurations were minor. First, the trends of the lift and moment curves of WPN configuration differed those of the FTN and Clean configurations at high angles. The WPN configuration’s lift curve reached 11° after a linear increase (the value of increasing slightly at 11° compared to 9°) and then increased linearly again to 17°, followed by a decrease to 19°. While the FTN and Clean configurations’ lift curve slopes increased linearly to 11°, the lift increased again to 15°, and then began to oscillate. The drag difference between the two configurations increased with the angle of attack. In addition, except for the cases between 11°: 17°, pitch moment of the three configurations were basically the same, and the moment of WPN configuration started to increase at 15° while others started to increase at 13°.
Figure 15. Aerodynamic force coefficients of the at takeoff condition three configurations.
Therefore, when considering the abovementioned comparison of the aerodynamic force curves at takeoff condition, it’s concluded that the FTN and WPN influences on the airframe aerodynamic forces and the stall characteristics were not the same, while the stall characteristics of the FTN and clean configuration were the same. In addition, at takeoff condition, the WPN affected the airframe aerodynamic to a higher degree, while the FTN affected the airframe aerodynamic to a lower degree.
3.2.2. Surface flow at takeoff condition
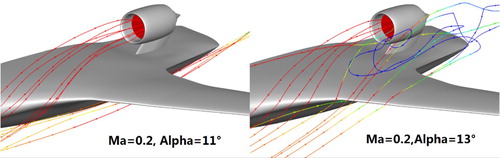
The upper surface limiting streamlines and pressure contour of FTN with WPN, and FTN with Clean configuration at takeoff condition and different angles of attack are shown in Figure . From a comparison of the upper surface limiting streamlines and pressure contour of the FTN and WPN configurations, it can be seen that the limiting streamlines and pressure contour differed above 11° and that the WPN configuration had a much lower pressure area at the front of the nacelle. While the surface flows of the three configurations were all separated from the blending area above 11°, the surface vortex core of the WPN configuration was closer to the engine both along with the spanwise and chordwise directions. The separated flow area of the WPN configuration increased up to the engine location with an increasing angle and would start inflow into the engine at 13°, as shown in Figures and .
Figure 16. Upper surface limiting streamlines and pressure contour of FTN/WPN and FTN/Clean configuration at different angles of attack (takeoff condition).
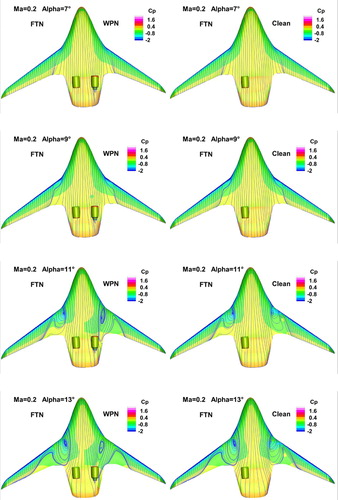
Figure 17. Near the engine surface limiting streamlines and pressure contour of FTN with WPN configurations at 11° and 13° (takeoff condition).
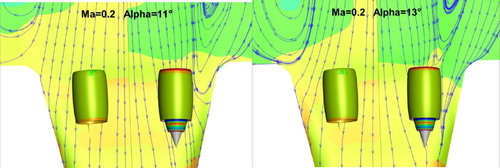
Figure 18. Fan inlet streamlines of WPN configurations at 11° and 13° (takeoff condition).
When comparing the upper surface limiting streamlines and pressure contour of the FTN and Clean configurations, it can be seen that the differences between FTN and the Clean configuration were minor. The difference between the upper surface limiting streamlines and pressure contour of FTN and the Clean configuration was small, but the engine shape somewhat compressed the streamlines at the blended area. The surface flows of FTN and the Clean configuration were similar, which indicated that, at takeoff condition, the main reason for the changes in the surface flow was the air suction caused by power influences of the WPN (as shown in Figure , the airflow streamlines in front of the engine were compressed into the engine air inlet). Considering the results at cruise condition (the surface flows of the FTN and WPN configurations were similar), it can be concluded that, the engine shape was the main reason for the change in surface flow at cruise condition.
Figure 19. Streamlines of WPN configurations engine symmetrical plane at 11° (takeoff condition).
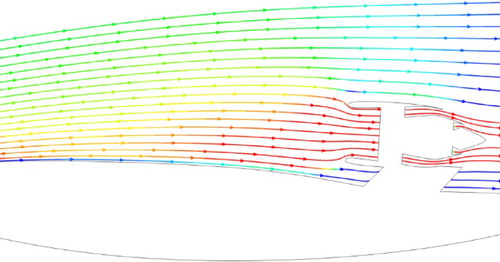
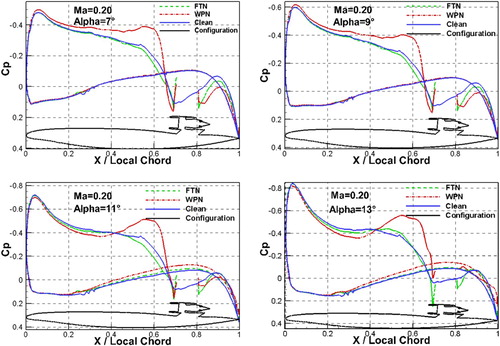
Figure shows the airframe pressure coefficient distribution on the engine symmetrical plane of the three configurations at different angles of attack. From the pressure distribution of the FTN and WPN configuration compared at the same angle of attack, it can be seen that there were differences at angles of attack below 11°. On the symmetrical plane of the engine, due to the air suction by the engine of the WPN configuration, it almost changed the upper surface pressure distribution in front of the engine at the angles of attack.
Figure 20. Airframe Pressure distribution on the engine symmetrical plane of the three configurations at different angles (takeoff condition).
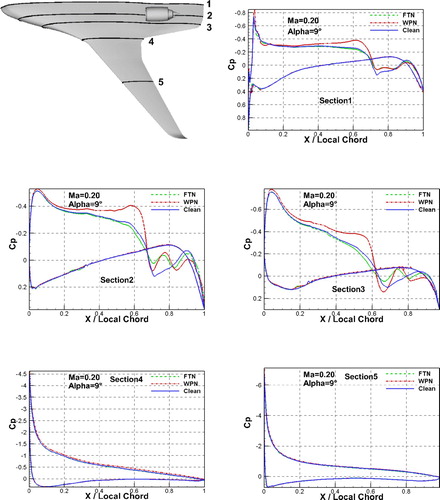
Comparison of the FTN and Clean configurations at the same angle showed almost no difference between the pressure distribution of the FTN and Clean configurations except the place near the engine. This also indicated that the engine shape influence at takeoff condition was focused at the place near the engine. The tube formed by the engine and airframe shape thus changing the flow through it. Figure shows the pressure distribution for different spanwise sections of the three configurations at 9° as an example demonstrating the WPN and FTN influences at the same angle. It shows that the influence of other places is not similar to that of cruise under takeoff condition. More specifically, the FTN influence was always small except at the place near the engine. In contrast, the WPN influence on the airframe center body was obvious, but small influence on the wing.
Figure 21. Pressure coefficient distribution for different spanwise sections of the three configurations at 9° (takeoff condition).
From the comparison between pressure coefficient distribution of the three configurations at different angles of attack, it shows that: at angles of attack below 9°, the lower surface flows of the three configurations were the same and the upper surface flow of the WPN was always faster than the other two at the same angle. This was the main reason why the lift and drag of the WPN were bigger than that of the FTN and Clean configuration when the angle of attack was below 9°. The WPN configuration upper surface stream velocity initially decreased, then increased near the engine inlet to satisfy the powered engine air inlet requirement. However, at angles of attack above 11°, because of the flow separation, the engine capture flow needed greater velocity to balance the mass loss, thereby causing a suction peak at the upper surface in front of the engine. The pressure was lower as the angle increased, thus causing a larger flow separation area. This also caused the trailing edge pressure to decrease, which made the flow pressure distribution behind about 20% of the local chord on the lower surface of the WPN configuration and lower than those of the FTN and Clean configurations at the same angle. Moreover, the flow at the front of the engine on the upper surface of the WPN configuration was also not always lower than that of the FTN and Clean configurations. The lower surface pressure decrease and the upper surface pressure increase, causes the lift curve to flatten at 9°: 11°, but an increase in the lift and flow separation should increase the drag; therefore, the drag of the WPN configuration was still growing. Above 11°, except for the separated area, the other location also provided a lift, so the lift curve of the WPN configuration increased linearly again until 19°. The FTN configuration did not have any power influences and it maintained a nearly constant aerodynamic force curve trend as the Clean configuration.
From the abovementioned aerodynamic force curve analysis, it was known that the powered influence makes WPN configuration stall characteristics were different from the FTN and Clean configurations. In order to clearly identify the flow separation changes in space, the flow separation is analyzed by using the pressure ratio (PR) distribution, because the flow separation leads to the decrease of PR. PR is the ratio of local total pressure to free stream total pressure. From the PR distribution, the total pressure loss in space can be well known. Figure shows the upper surface PR distribution of the three configurations at large angles of attack (Alpha above 11°) (takeoff condition). In this figure from left to right, the WPN, FTN, and Clean configurations, respectively, are shown.
Figure 22. Upper surface PR distribution of the three configurations at angles of attack above 11° (takeoff condition).
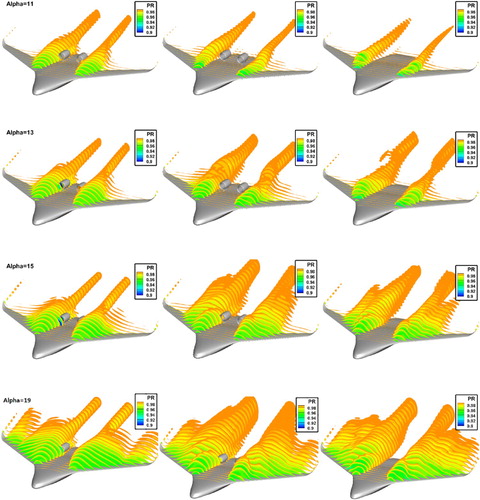
In Figure , the flow separation differences of the three configurations at large angles of attack were as follows:
The separation area of the FTN and Clean configurations was initially smaller than that of the WPN configuration. However, as the angle of attack increased, it increased fast and became larger than the WPN configuration at 15°. Furthermore, the separation area of three configurations all across the wing area was 19°.
The separation vortex initials from the blended points in the three configurations. Due to the cross-flow generated from the large sweep angle of the airframe leading edge, the FTN and Clean configurations separation vortex center getting closer to the winglet. But the vortex center of the WPN configuration became very stable due to the influence of engine inflow.
Due to the flow of the lower surface, for the FTN and Clean configuration, the separation vortex behind the airframe inclines upward. On the contrary, due to the influence of engine outflow, the WPN configuration separation vortex behind the engine maintained the original direction (the same as the outflow direction) well.
So, the separation characteristics of the FTN, WPN, and Clean configurations had an obvious difference under large angles of attack and takeoff conditions due to these differences in flow separation caused by the influence of engine power (inflow and outflow). The stall characteristics of the FTN, WPN, and Clean configurations also differed. The larger separation area of the WPN configuration at 11° caused a flattened lift curve. But, the WPN configuration separation area became small as the angle increases, and because the other areas of the plane could also provide lift, the lift increased again, and then decreased at 19° because of the separation area across the wing area. However, the quickly enlarging separation area of the FTN and Clean configuration after 11° made the lift curve slope decrease at 11°, and then the lift value oscillated and became smaller than it of the WPN configuration after 15°.
4. Conclusions
In this study, the aerodynamics of the FTN, WPN, and Clean BWB300 configurations were calculated using numerical simulation method to identify the differences among them, and also to simulate the different engine model effects on the BWB300 airframe aerodynamic by comparing their results with the Clean configuration’s. The results were as follows:
At cruise condition, the difference between the aerodynamics of the FTN and WPN configurations was small, except for the surface flow difference near the engine. The aerodynamic coefficient curves of them were nearly the same and they both stalled at the same angle of attack. The FTN and WPN both reduced the aerodynamic force of the airframe, except near the stall angle. The engine shape was the main reason for the changes in the airframe aerodynamics at cruise condition. It made the position of the main shock wave on the upper airframe surface of both configurations move forward and weaken in strength. In addition, due to the tube formed by the engine and airframe shape, shock waves appeared on the FTN configuration pylon wing side. The power influence range of WPN configuration was near the engine, it would accelerate the surface flow under the engine and generated a new shock wave on the shock-free pylon of the FTN configuration. Moreover, the WPN and FTN both could affect the aerodynamics of the wing, but the effect was weak as the distance increased from the engine in the spanwise direction.
At the takeoff condition, the difference between the aerodynamic of the FTN and WPN configurations was obvious, especially at large angles of attack. The lift curve trends were not the same, the drag difference between the trends increased with the increasing angle, and the stall characteristics were also different. The powered engine inflow air suction was the main reason for the change in the airframe aerodynamic at takeoff condition. The WPN inflow air suction changed the airframe upper surface flow and, additionally, at large angles of attack, it would lead to the difference of the flow on the lower surface between the FTN and WPN configurations. The WPN outflow maintained the separation vortex flowing in the same direction as it left the original airframe direction. The FTN effect was always small, except at the place near the engine. The tube formed by the engine and airframe shape thus changing the flow through it. However, the WPN effects on the airframe center body were obvious, except for only minor effects on the wing.
Considering the numerical simulation results obtained from this study, it was also concluded that, when conducting the nacelle/airframe integration analysis at cruise condition, the FTN configuration can provide almost the same aerodynamic results as WPN, due to the small influence of the power on the airframe aerodynamic force at cruise condition. Therefore, for BWB300, the FTN model can approximately substitute the WPN model for cruise condition wind tunnel test, thus simplifying the wind tunnel test process and reducing the wind tunnel test cost of its powered configuration.
In the present work, only the influence of FTN/WPN on BWB300 airframe aerodynamics was analyzed. The nacelle and pylon should be considered for more detail nacelle/airframe integration analysis.
Disclosure statement
No potential conflict of interest was reported by the author(s).
Additional information
Funding
References
- Abadi, A. M., Sadi, M., Farzaneh-Gord, M., Ahmadi, M. H., Kumar, R., & Chau, K. W. (2020). A numerical and experimental study on the energy efficiency of a regenerative heat and mass exchanger utilizing the counter-flow Maisotsenko cycle. Engineering Applications of Computational Fluid Mechanics, 14(1), 1–12. doi: 10.1080/19942060.2019.1617193
- Ammar, S., Legros, C., & Trépanier, J.-Y. (2017). Conceptual design, performance and stability analysis of a 200 passengers blended wing body aircraft. Aerospace Science and Technology, 71, 325–336. doi: 10.1016/j.ast.2017.09.037
- Brodersen, O. (2002). Drag prediction of engine-airframe interference effects using unstructured Navier-Stokes calculations. Journal of Aircraft, 39(6), 927–935. doi: 10.2514/2.3037
- Deere, K. A., Luckring, J. M., McMillin, S. N., Flamm, J. D., & Roman, D. (2016). CFD predictions for transonic performance of the ERA hybrid wing-body configuration (Invited). 54th AIAA aerospace sciences meeting.
- El-Sayed, A. F. (2017). Aircraft propulsion and gas turbine engines. Boca Raton: CRC Press.
- Farzaneh-Gord, M., Faramarzi, M., Ahmadi, M. H., Sadi, M., Shamshirband, S., Mosavi, A., & Chau, K. W. (2019). Numerical simulation of pressure pulsation effects of a snubber in a CNG station for increasing measurement accuracy. Engineering Applications of Computational Fluid Mechanics, 13(1), 642–663. doi: 10.1080/19942060.2019.1624197
- Flamm, J. D., James, K., & Bonet, J. T. (2016). Overview Of ERA integrated technology demonstration (ITD) 51A ultra-high bypass (UHB) integration for hybrid wing body (HWB) (Invited). 54th AIAA aerospace sciences meeting.
- Gang, Y., Dong, L., Zhenli, C., & Zeyu, Z. (2019). Blended wing body thrust reverser cascade feasibility evaluation through CFD. IEEE Access, 7, 155184–155193. doi: 10.1109/ACCESS.2019.2949062
- Ghalandari, M., Shamshirband, S., Mosavi, A., & Chau, K. W. (2019). Flutter speed estimation using presented differential quadrature method formulation. Engineering Applications of Computational Fluid Mechanics, 13(1), 804–810. doi: 10.1080/19942060.2019.1627676
- Hoheisel, H. (1997). Aerodynamic aspects of engine-aircraft integration of transport aircraft. Aerospace Science and Technology, 1(7), 475–487. doi: 10.1016/S1270-9638(97)90009-2
- Kellari, D., Crawley, E. F., & Cameron, B. G. (2017). Influence of technology trends on future aircraft architecture. Journal of Aircraft, 54(6), 2213–2227. doi: 10.2514/1.C034266
- Kozakiewicz, A., & Frant, M. (2013). Analysis of the gust impact on inlet vortex formation of the fuselage-shielded inlet of a jet engine powered aircraft. Journal of Theoretical and Applied Mechanics, 51(4), 993–1002.
- Lange, R. H. (1986). A review of advanced turboprop transport aircraft. Progress in Aerospace Sciences, 23(2), 151–166. doi: 10.1016/0376-0421(86)90003-5
- Larkin, G., & Coates, G. (2017). A design analysis of vertical stabilisers for blended wing body aircraft. Aerospace Science and Technology, 64, 237–252. doi: 10.1016/j.ast.2017.02.001
- Li, J., Gao, Z., Huang, J., & Zhao, K. (2013). Aerodynamic design optimization of nacelle/pylon position on an aircraft. Chinese Journal of Aeronautics, 26(4), 850–857. doi: 10.1016/j.cja.2013.04.052
- Menter, F. R. (1994). Two-equation eddy-viscosity turbulence models for engineering applications. AIAA Journal, 32(8), 1598–1605. doi: 10.2514/3.12149
- Okonkwo, P., & Smith, H. (2016). Review of evolving trends in blended wing body aircraft design. Progress in Aerospace Sciences, 82, 1–23. doi: 10.1016/j.paerosci.2015.12.002
- Oliveira, G., Trapp, L. G., & Puppin-Macedo, A. (2003). Engine-airframe integration methodology for regional jet aircrafts with underwing engines. 41st aerospace sciences meeting and exhibit.
- Peacock, N. J., & Sadler, J. H. R. (1992). Advanced propulsion systems for large subsonic transports. Journal of Propulsion and Power, 8(3), 703–708. doi: 10.2514/3.23535
- Plumley, R. W., & Zeune, C. (2017). Revolutionary configurations: Technology convergence point. 55th AIAA aerospace sciences meeting.
- Reist, T. A., & Zingg, D. W. (2016). Aerodynamic design of blended wing-body and lifting-fuselage aircraft. 34th AIAA applied aerodynamic conference.
- Ruiz-Calavera, L., Funes-Sebastian, D., & Perdones-Diaz, D. (2010). Powered model wind tunnel tests of a high-offset subsonic turboprop air intake. 46th AIAA/ASME/SAE/ASEE joint propulsion conference & exhibit.
- Schuh, M. J., Garcia, J. A., Carter, M. B., Deere, K. A., Stremel, P. M., & Tompkins, D. (2016). NASA environmentally responsible aviation hybrid wing body flow-through nacelle wind tunnel CFD (Invited). 54th AIAA aerospace sciences meeting.
- Stankowski, T. P., MacManus, D. G., Robinson, M., & Sheaf, C. T. (2017). Aerodynamic effects of propulsion integration for high bypass ratio engines. Journal of Aircraft, 54(6), 2270–2284. doi: 10.2514/1.C034150
- Zhaoguang, T., Yingchun, C., & Jiangtao, S. (2014). Study of power influences to the wing-mounted civil aircraft aerodynamic characteristics. Journal of Aircraft, 51(2), 629–636. doi: 10.2514/1.C032356