
 ?Mathematical formulae have been encoded as MathML and are displayed in this HTML version using MathJax in order to improve their display. Uncheck the box to turn MathJax off. This feature requires Javascript. Click on a formula to zoom.
Abstract
Water Quality Index (WQI) is the most common determinant of the quality of the stream-flow. According to the Department of Environment (DOE, Malaysia), WQI is chiefly affected by six factors, which are, chemical oxygen demand (COD), biochemical oxygen demand (BOD), dissolved oxygen (DO), suspended solids (SS), -potential for hydrogen (pH), and ammoniacal nitrogen (AN). In fact, understanding the inter-relationships between these variables and WQI can improve predicting the WQI for better water resources management. The aim of this study is to create an input approach using ANNs (Artificial Neural Networks) to compute the WQI from input parameters instead of using the indices of the parameters when one of the parameters is absent. The data are collected from the nine water quality monitoring stations at the Klang River basin, Malaysia. In addition, comprehensive sensitivity analysis has been carried out to identify the most influential input parameters. The model is based on the frequency distribution of the significant factors showed exceptional ability to replicate the WQI and attained very high correlation (98.78%). Furthermore, the sensitivity analysis showed that the most influential parameter that affects WQI is DO, while pH is the least one. Additionally, the performance of models shows that the missing DO values caused deterioration in the accuracy.
1. Introduction
Recently, the water plays an essential role as a main resource for human activities (industrial activities, agricultural activities, etc.) as well as human existence (Wan Mohtar et al., Citation2019). Thus, it's a fundamental unit of our life and, therefore, the water resource assessment, monitor and preservation is highly recommended especially for developing countries. Furthermore, the assessment of the water resources is an essential for river basin and water resources planning (Caddis et al., Citation2012). Letcher et al. (Citation2007) has defined the water resources assessment as ‘the process of assessing the source, scope, reliability, quantity and quality of water resources for the purposes of water resources utilization and management’. The water quality assessment is regarded as one of the most crucial steps for controlling the water bodies. Moreover, the observation of data categorization, modeling and analysis are regarded as the most crucial steps for water quality assessment (Sharma et al., Citation2013).
Due to the importance of the surface water that people depend on it for their aquatic life support, water supply, recreation, fisheries and transportation, so the management of the surface water resources is an important. One of these resources is the rivers, which are very important for agricultural, irrigation, industrial, residential use and other human activities (Kido et al., Citation2009; Luo et al., Citation2011). The quality of the rivers water is affected by a various factor. However, the biological and physico–chemical parameters were used for many previous studies to assess the river water quality (Atasoy et al., Citation2006; Avvannavar & Shrihari, Citation2008).
Certain approaches are used to assess river water quality out of which one is determining WQI. It is a statistical tool which is used to convert large amount of information of water quality into just one number (Stambuk-Giljanovic, Citation1999). This indicator is a single quantity that signifies a huge volume of data. Thus, WQI in other words is defined as a single numeric expression that represents complex information, which gathered from the water body. Certainly, the index scaled between 0 and 100, where a higher value of the index interprets good water quality and a lower value indicates a poor quality of the water (Rubio-Arias et al., Citation2012; Tao et al., Citation2019).
Among the factors of water quality measured to assess the river water status, only 6 are used to determine WQI: biochemical oxygen demand (BOD), dissolved oxygen (DO), suspended solids (SS), chemical oxygen demand (COD), ammoniacal nitrogen (AN), and potential for hydrogen (pH) (Hameed et al., Citation2017).
The WQI methods are used by many countries to evaluate the general status of their rivers. Although the concepts are similar, these indices aren't same and differ from country to country (Tung & Yaseen, Citation2020).
By reading the parameters of WQI, quality of water can subsequently be classified as per the below given Table :
Table 1. The WQI classification.
Class I water quality is regarded harmless for direct drinking, Class II is harmless for swimming but needs treatment after which it becomes fit for drinking, Class III requires intense treatment before it can be used for drinking, Class IV can only be used for domestic animals and plants usage and Class V cannot be utilized for any of the purposes mentioned above (Ho et al., Citation2019).
The prediction of the ecological as well as environmental impacts of waste and pollutant disposal as a result of associated land use changes and modification is now appeared to be more than a fundamental requirement for river engineering personnel. Investigating ways and means of linking land use, pollutant loading and disposal, water quality and ecosystem impacts together. The use of computer-based water quality models is widely accepted for such purpose. These models could be a merely simple ‘black box type’ mass balance models to be used as planning and screening tools to commercially available dynamic and complex water quality models primarily used for strategic planning purposes. Water quality modeling techniques have evolved as an accepted tool to support the surface water management. Modeling techniques are used to carry out a systematic and methodical analysis, aiming at understanding the cause and effect relationships and assessing the impact of changes in ambient water quality due to various possible scenarios, such as changes in land use and loadings, etc. Water-quality modeling is the linkage between the sources of pollution and the in-stream water quality processes of a given water body. In summary, a model is not perceived to be more than a representation of the physical, chemical, and biological water-quality processes and mechanisms that occur in a water body.
The AI techniques have been applied and approved recently as an appropriate tool to model composite nonlinear phenomena in water bodies system and hydrology. Recent investigations have used the capabilities of the artificial neural network (ANN) in modeling water resource variables (Heddam & Kisi, Citation2018; Malik et al., Citation2019; Sepahvand et al., Citation2019). Another research by (Alizadeh et al., Citation2018) have been used the machine learning to study the effect of river flow on the quality of estuarine and coastal water. Recently, the application of AI models in the field of water resources becomes prominent where several AI models have been used in this filed such as neural networks, adaptive neuro-fuzzy inference system, and other hybrid models (Olyaie et al., Citation2015).
The ANNs (i.e. Artificial Neural Networks) technique is an information-driven modeling technique with an adaptable statistical structure which is able to model complex and nonlinear correlations between input as well as output data sets without requiring an insight into the natural phenomena (Makarynska & Makarynskyy, Citation2008).
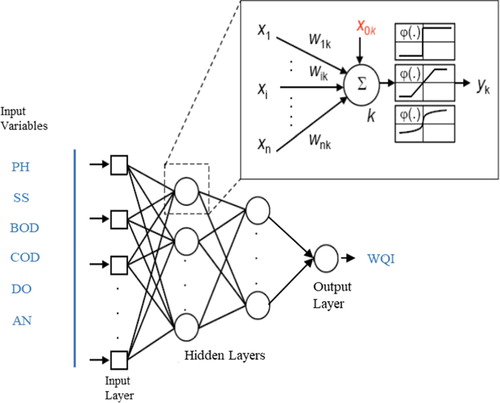
ANNs have three or more layers: input layer, hidden layers as well as output layers. The only role of the nodes’ input layer is to convey the inputs information to the neurons of the primary hidden layer (Elzwayie et al., Citation2017). The role of the output layer is to generate an output for the specified input (Liu & Chen, Citation2012). The in-between hidden layers (there can be just a single layer) act as a set of feature detectors. The suitable network framework determination is one of the most crucial and complex tasks in modeling the system (Ghorbani et al., Citation2018; Karimi et al., Citation2013; Sudheer et al., Citation2002). Figure shows schematic representation of a general model of ANNs of this 3-layer system.
Figure 1. Schematic description of a three-layer ANNs and of the elements and its (mathematical) neurons.
There are several ways to apply ANNs. Finding the best solution is a challenging task, since the model-maker has to employ a systematic testing of a huge amount of possibilities and make certain assumptions based on experience so as to keep it within convenient proportions. Such assumptions are systematically represented and justified here: training algorithm, network topology, choice of input, and optimum network size (Anctil et al., Citation2004).
There are several frameworks and types of ANNs like PNN (i.e. Probabilistic Neural Networks), GRNN (i.e. General Regression Neural Networks), RBF (i.e. Radial Basis Functions) and MLP (i.e. Multilayer Perceptron Network) (Maier et al., Citation2010; Yaseen et al., Citation2019). MLP is the most commonly used ANN in which the neurons are connected in layers as shown in Figure . Each neuron is linked with neurons in consecutive layers. Every neuron in the output or the hidden layer obtains weighted inputs from each of the neurons in the preceding layer. Then, the effectual incoming signal propagates forward via a non-linear activation function, to the neurons in the subsequent layer. This means that each individual neuron performs twice. At first, there is an integration of the data from other neurons or from a source external to the system. It is done often using a linear function. Then, it generates an output in line with a prefixed activation function like the linear, cubic or sigmoid polynomial function. This input to output transformation within one neuron is fairly simple; the ANN power and complexity is finally achieved by an interaction among multiple neurons (Adamowski & Sun, Citation2010).
The most essential aim of this study is to develop ANNs framework by examining the correlation between WQI and the six influencing parameters, which are COD, BOD, DO, pH-, AN, and SS. An insight into the correlation between the WQI and these six factors can play a significant role in the development of an integrated model for management of the quality of the river water and in assessing the overall status of the quality of the river water. Additionally, this study is focusing on creating an input approach of the new model to compute the WQI directly from input parameters instead of using the indices of the parameters when one of the parameters is absent.
Calculating WQI using traditional approaches depends on and empirical equations which include high degree of approximation which gives uncertainty in the results in addition the WQI equation cannot be used when one of the parameters is missing. Thus, ANN technique is an efficient and straightforward technique for computing and modeling WQI and managing the issue of the absent factors. This study can be regarded as among the few contributions in developing a model for understanding the correlation between the parameters and the WQI in the Klang River using ANNs.
2. Study area
Malaysia has several natural resources. Around 95% of Malaysian water resources belong to the inland river systems. As the country's dream comes true for its vision 2020, the demands of the water increase highly and there is more pressure to preserve the current water resources in order to find other course of actions to improve the quality of the water. Swift industrialization, although reasonably well-planned and controlled, has developed an increased pressure on city areas particularly in the Klang River basin, the most thickly populated region of the nation (Bradley, Citation2010).
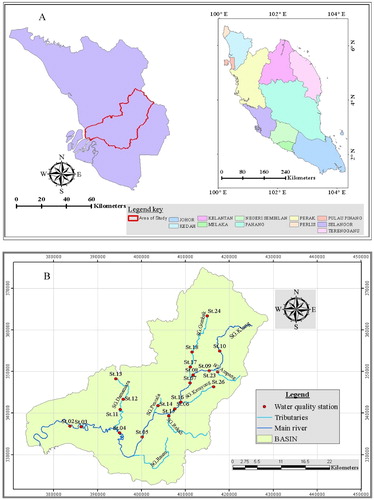
The Basin as shown in Figure includes Kuala Lumpur's Federal Territory, parts of Hulu Langat, Gombak, Petaling, and Klang districts in the State of Selangor, as well as the municipal regions of Shah Alam, Petaling Jaya, and Ampang Jaya. Klang River stems from the North-East region of Kuala Lumpur, which is abundant in mountains, spread over 25 kms. Before linking to the Malacca Strait at Port Klang and while crossing the Federal Territory as well as the region that is downstream of Kuala Lumpur, 11 major tributaries connect with the Klang River. The basin of the Klang River is located within two states in Malaysia, Kuala Lumpur and Selangor. Encompassing 120 km, Klang River drains 1,288 km2 area from the vertical mountain rain forests of the chief Central Range which falls along Peninsular Malaysia towards the mouth of the river in Port Klang (Directors, Citation2002). The catchment area within Peninsular Malaysia and the locations of the monitoring stations are shown in Figure .
Figure 2. (a) Location of Klang River Catchment and (b) water quality stations.
3. Methodology
3.1. Water quality monitoring data
The examination of the quality of the water is a crucial component in the water bodies’ management, preservation and treatment (Mei et al., Citation2011). Data regarding water quality were gathered on the basis of the in-situ measurements and laboratory assessment. The most general parameters which are measured are those associated with water pollution caused due to effluent discharge, sewage and land clearing. Parameters which are measured at the location include DO and pH. Laboratory assessments were performed to calculate the factors of the water quality, i.e. COD, BOD, TSS and AN. Additional data have also been obtained from the Department of Environment (DOE, Malaysia). Figure (b) shows the locations of the monitoring stations.
3.2. Calculation of the water quality indices
The DOE calculates the WQI based on the six parameters as mentioned before by using Equation bellow (Hameed et al., Citation2017):
(1)
(1) Where, WQI = Water quality index; SIDO = Sub-index of DO; SIBOD = Sub-index of BOD; SICOD = Sub-index of COD; SIAN = Sub-index of AN; SISS = Sub-index of TSS; SIpH = Sub-index of pH.
The sub-indices, which are included in Equation (1) above, calculated according to the best-fit relations given in Table .
Table 2. The calculations of the sub-index (Othman et al., Citation2012).
3.3. Collecting data and construction of modeling data matrix
With the aim to develop a model for the WQI employing ANNs, it is essential to obtain data for modeling and training purposes. The data for training must include sufficient number of cases, each including values for input as well as output parameters. Knowledge and proficiency in this problem domain and situations provide a primary idea which influences the input parameters (Jiang & Cotton, Citation2004).
As shown in Figure (b), the selected station has been chosen to be distributed in all tributaries and mainstream to cover all the basin area and depend on the land use. Also, the selection is done based on the data availability.
Previously, it has been mentioned that WQI is affected by 6 factors: DO, COD, BOD, pH, AN and SS. The required data were collected from the nine water quality monitoring stations in Klang River basin starting from 1997 to 2007. The sampling procedure has been made by the Department of Irrigate and Drainage (DID) in Malaysia where the sampling of most of station in this study has been made at least two time per week over the years, thus the seasonality of sampling has been taken in the consideration.
After gathering data, it is examined, validated and reorganized to create matrix of the training data which should contain sufficient number of cases, each having input and output values for the modeling. The rearranging of the initially gathered data is necessary for building a matrix for the model data. Data rearranging was performed using MS Excel software. The data matrix is regarded as the raw material which is required for the ANN model. Table illustrates a part of ANNs model matrix.
Table 3. Part of ANNs model matrix.
3.4. Analysis of ANNs model data
Before start modeling, data were analyzed to check the normality of data. Considering just those cases having complete numeric data for all parameters and not missing any data, around 941 cases fulfill the above-mentioned conditions in the duration 1997–2005. The data for the years 2006 and 2007 will be employed to assess the ANNs model. The ANNs model might do well over the whole space only when the data of training are uniformly or semi-uniformly distributed in the entire range of values for each of the parameters. As the current data are gathered using limited sources (9 stations), they possibly comprise clusters. Thus, the distribution assessment of every parameter across its range is tested. The standard deviation mean and ranges of all the different parameters are displayed in Table . From this table, it can be seen a high fluctuation in the range of these statistics. This variation in the statistics of parameters could influence the performance of ANN model. To simplify the process of modeling, the normalization process carried out where all data parameters normalized between 0 and 1.
Table 4. Mean, standard deviation and range of variables used in modeling.
3.5. Building ANNs model
The Artificial Neural Networks model was constructed using the SNN (i.e. STATISTICA Neural Networks). The technical steps in constructing and applying of the ANNs model are different for different tools used in the construction of the ANNs model.
Using SNN, the technical steps involved various procedures. First of all, the SNN data matrix was supplied to train the network by ‘importing’ or by using the data entry procedure. The input data represent the cases that are used by the network to train itself. Then, the input (i.e. Dependent) as well as the output (i.e. Independent) for the Artificial Neural Networks model was given as shown in Table . Around half of the cases were chosen for training; 25% each for calibration and testing. It is an arbitrarily selected amount and the expert can modify this percentage. The data set used for the test provides a way by which the network can recognize when it is time to stop the training and start calibration and testing (May et al., Citation2008). Further, the appropriate model of the network was selected from the networks available on the basis of the type of the problem and the data. Following several trials, MLP has been selected due to its high ability to standardize the problems involving high amount of nonlinearity and complexity. As soon as the network type is finalized, the conditions to end the training procedures are set prior to the training of the network. Training was regulated by certain conditions such as: target performance specifying the tolerance between the NN prediction and the actual output, the maximum iterations, the minimum permissible gradient and the maximum time of running. For preventing the possibility of the occurrence of memorization, calibration was performed. This calibration serves as a parameter that signifies that the network has been trained sufficiently and subsequently ending the process of iteration. When the training of the network has been completed satisfactorily, it is further examined against a collection of cases that were not used during the training period.
The ANN models have been built based on several input combination. The first model was based on all input parameters while other models based on only five inputs by suggesting that one of the inputs is missing each time. Therefore, five inputs scenarios will be tested.
The outcomes are then provided using a statistical representation. Regression analysis was used to measure the extent of correlation between the network output and the actual output. Correlation factor (r) of 1 indicates that it is an ideal model while a value of 0 suggests that it is an extremely bad model. Mathematically, the (r) values can be represented in Equation (Equation2(2)
(2) ) given below.
(2)
(2)
After several trials, MLP was decided as the most optimal neural network which has three layers: an input layer having 6 neurons, a hidden layer having seven neurons and lastly the output layer with one neuron. The six input neurons are: COD, BOD, DO, AN, SS and pH. The output neuron represents WQI. Additional performance indicators, like MAE (i.e. mean absolute error), ABS (i.e. maximum and minimum absolute error), RMSE (i.e. root mean square error), NRMSE (i.e. normalized root mean square error) have been used to assess the accuracy of the prediction of every model for better comparison.
4. Results and discussion
4.1. Regression statistics of ANNs model
In problems of regression, the aim of the NN is to learn a plotting from the input parameters to an output parameter. A network is efficient at regression in case it makes satisfactorily accurate predictions. SNN automatically computes the correlation coefficient (r) between the predicted and the actual outputs. An ideal prediction is one with a correlation coefficient of value 1. A correlation having value 1 does not necessarily suggest an absolute prediction (i.e. it only signifies a prediction that has an absolute linear correlation with actual outputs); even though in fact the coefficient of correlation is an excellent performance indicator. It also provides a well-known and simple means to evaluate the performance of NNs with usual least squares linear fitting methods. The below given Table shows the regression statistics values for the ANNs model (Sanikhani et al., Citation2019; Yaseen et al., Citation2018).
Table 5. Values of regression statistics for ANNs model with all input parameters.
The low value of S.D. Ratio, Error Mean and Abs E. Mean signifies that the inaccuracy between simulated and observed WQI values obtained by the ANNs model is not too high. The correlation coefficient's (r) high value signifies that the simulated values of WQI obtained by using the ANNs model agree well with the observed values of WQI.
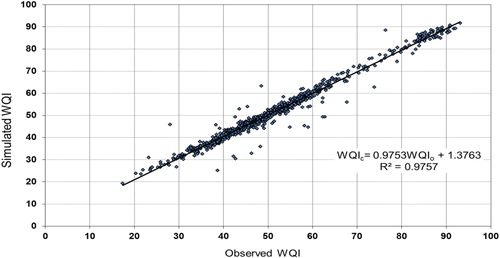
The correlation coefficient (r) between the observed and the predicted ANNs model output values is 98.78%. The correlation coefficient's (r) high value signifies that the simulated values of WQI obtained by using the ANNs model agree well with the observed values of WQI, a fact that gave an initial idea that ANNs model are efficient and practical. Figure shows a comparison of observed values of WQI and simulated WQI values obtained by applying ANNs for all the modeling data. The observed and predicted WQI, seem to be in good accord with R2 0.9757.
Figure 3. Correlation between the simulated and the observed WQI for all modeling data.
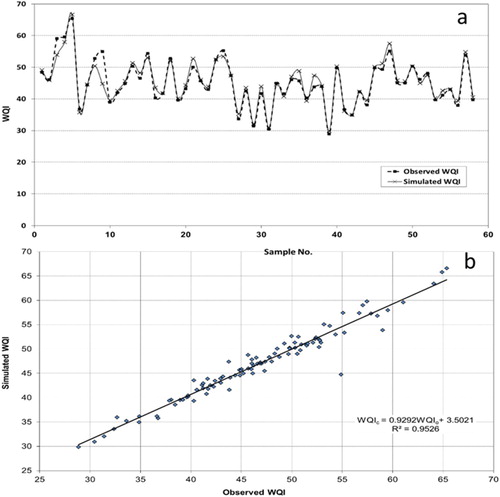
The correlation has been tested for all station which represent all range of model data from the period of January 1999 to June 1999 as shown in Figure . In addition, the comparison of simulated and the observed data for Station St.05 from 1997 to 2001 has been presented in Figure . It can be seen clearly that the results showed a high correlation between the observed and simulated WQI in both Figures and . It is clear that ANNs model achieved high performance through the high similarity rates, which observed over the complete period and for all stations data of model in Figures and .
Figure 4. (a) Comparison of the simulated WQI and the observed WQI for all stations in 1999 from January to June (b) Correlation between the simulated WQI and the observed WQI for all stations in 1999 from January to June.
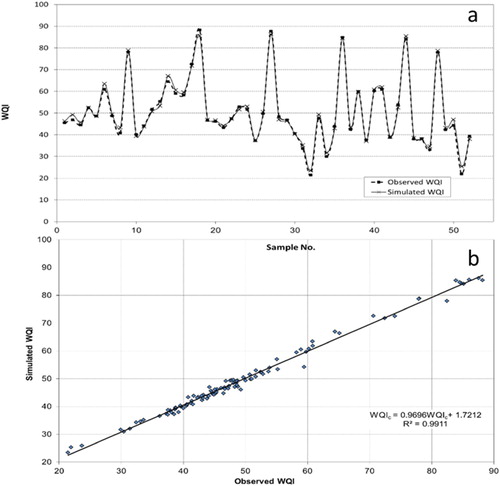
Figure 5. (a) Comparison of the simulated WQI and the observed WQI for station St.05 from 1997 to 2001 (b) Correlation between the simulated WQI and the observed WQI for station St.05 from 1997 to 2001.
Since that used data in modeling are from year 1997 to 2005, the ANNs model is tested using the data of year 2006. Comparison of simulated WQI and the observed WQI for all stations in year 2006 is presented in Figure .
Figure 6. (a) Comparison of the simulated WQI and the observed WQI in 2006 (b) Correlation between the simulated WQI and the observed WQI in 2006
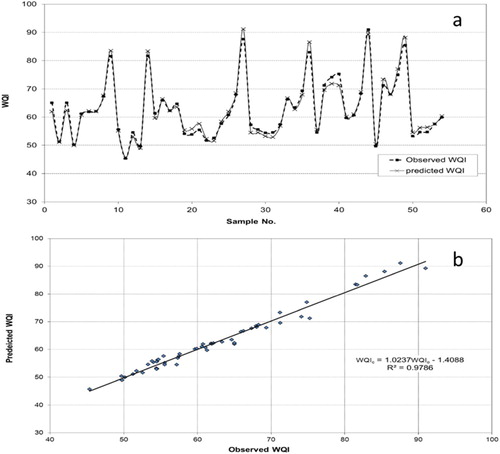
The observed and predicted WQI, seem to be in good accord with R2 0.9786. The correlation between the simulated and observed output values in year 2006 is 98.92%. It is very high correlation and indicates that the ANNs model is useful and applicable to calculate WQI.
4.2. Sensitivity analysis
Sensitivity assessment is used as an indicator of which input parameters are regarded as most important. It is used only for informative purposes. It can give significant insights into the effectiveness of the individual parameters. It rates the parameters according to the decline in the performance of the model which takes place if that parameter is no longer useful to the model. In doing this, it allocates a single rating value to every parameter. Nonetheless, the interdependence among the parameters signifies that no policy of single ratings for each parameter ever reflects the intricacy of the actual situation.
The ratio given in Table indicates the decline in the performance of the model when that parameter is not available for the model, so the most significant parameter is DO as it has the biggest ratio 2.99 while pH is not so significant as the ratio is 1.01, implying that almost no decline in the performance of the model will take place even if this parameter is not available to the model anymore. The importance other variables are presented in Table .
Table 6. Values of regression statistics for final ANNs model.
4.3. ANNs models for input scenarios
From the sensitivity analysis, the input parameters show a fluctuation in the importance to the WQI estimation. If one of these parameters is missing, the calculation of WQI is impossible task by using the WQI equation, therefore, a five ANNs model based on five input scenarios are presented. For each scenario one variable is missing. Table is presenting the performance indicator for six scenarios. It is clearly the results show that the best performance for the model when use all input variables which is can be consider as benchmark to compare with other scenarios results. The second presents the modeling performance when AN is missing from the input parameters. The highest value of r and the lowest value of all other indicators are presenting the highest accuracy of modeling. From Table , can conclude that the model with missing of DO parameter has lowest accuracy of WQI estimation based on all performance indicators. Meanwhile, the best performance for five input variables is seen when PH is missing. Therefore, it can be concluded that WQI can be estimated using ANN model with the missing of pH. These results from ANN models are similar to the sensitivity analysis that shows the importance of each model as shown in Table .
Table 7. The performance indicator for all input scenarios.
5. Conclusions
In this work, an artificial neural network model has been formulated for estimating the WQI of Klang River on the basis of various numbers of water quality parameters: BOD, DO, AN, COD, SS and pH. The methodology has proven it ability to estimate WQI with high accuracy in the condition of one of the parameters is missing.
The new model delivered quite good outcomes depending on the high correlation between the noted and projected values of WQI. The correlation coefficient (r) between the noted and the output computed values of the ANNs model is 98.78%. The high value of correlation coefficient (r) indicated that the computed WQI values by utilizing the ANNs model were in quite good accord with the noted WQI. This indicates that the ANNs model is beneficial and pertinent.
The ANNs model results and the sensitivity analysis proved that the most important variable that affects WQI is the DO and pH is less important variable. In spite of the deterioration of the accuracy for estimating the WQI when DO is missing but it is still with acceptable limits. For more accurate prediction of WQI, an ANN hybrid models or advanced AI models can be employed for future research.
Acknowledgments
We would like to express our thanks to the Department of Irrigation and Drainage, and the Department of Environment, Malaysia for their co-operation in performing this study. We would also like to extend our gratitude to the University of Malaya Research Grants (RU001-2017C, GPF070A-2018, RF015B-2018) and 2020106TELCO grant by the Innovation & Research Management Center (iRMC), Universiti Tenaga Nasional (UNITEN) for providing the financial support for this study.
Disclosure statement
No potential conflict of interest was reported by the author(s).
Additional information
Funding
References
- Adamowski, J., & Sun, K. (2010). Development of a coupled wavelet transform and neural network method for flow forecasting of non-perennial rivers in semi-arid watersheds. Journal of Hydrology, 390(1–2), 85–91. https://doi.org/10.1016/j.jhydrol.2010.06.033
- Alizadeh, M. J., Kavianpour, M. R., Danesh, M., Adolf, J., Shamshirband, S., & Chau, K. W. (2018). Effect of river flow on the quality of estuarine and coastal waters using machine learning models. Engineering Applications of Computational Fluid Mechanics, 12(1), 810–823. https://doi.org/10.1080/19942060.2018.1528480
- Anctil, F., Perrin, C., & Andréassian, V. (2004). Impact of the length of observed records on the performance of ANN and of conceptual parsimonious rainfall-runoff forecasting models. Environmental Modelling and Software, 19(4), 357–368. https://doi.org/10.1016/S1364-8152(03)00135-X
- Atasoy, M., Palmquist, R. B., & Phaneuf, D. J. (2006). Estimating the effects of urban residential development on water quality using microdata. Journal of Environmental Management, 79(4), 399–408. https://doi.org/10.1016/j.jenvman.2005.07.012
- Avvannavar, S. M., & Shrihari, S. (2008). Evaluation of water quality index for drinking purposes for river Netravathi, Mangalore, South India. Environmental Monitoring and Assessment, 143(1–3), 279–290. https://doi.org/10.1007/s10661-007-9977-7
- Bradley, R. M. (2010). Direct and indirect benefits of improving river quality: Quantifying benefits and a case study of the River Klang, Malaysia. The Environmentalist, 30(3), 228–241. https://doi.org/10.1007/s10669-010-9267-8
- Caddis, Ben, Nielsen, Chris, Hong, Wedge, Anun Tahir, Paridah, & Yenn Teo, Fang. (2012). Guidelines for floodplain development – a Malaysian case study. International Journal of River Basin Management, 10(2), 161–170. 10.1080/15715124.2012.688750
- Directors, A. D. B. B. of. (2002). Report and recommendation of the president to the Board of Directors on a proposed loan to Mongolia for the integrated development of basic urban services in provincial towns project (Vol. 31243). Asian Development Bank.
- Elzwayie, A., El-shafie, A., Yaseen, Z. M., Afan, H. A., & Allawi, M. F. (2017). RBFNN-based model for heavy metal prediction for different climatic and pollution conditions. Neural Computing and Applications, 28(8), 1991–2003. https://doi.org/10.1007/s00521-015-2174-7
- Ghorbani, M. A., Khatibi, R., Karimi, V., Yaseen, Z. M., & Zounemat-Kermani, M. (2018). Learning from multiple models using artificial intelligence to improve model prediction accuracies: Application to river flows. Water Resources Management, 32(13), 4201–4215. https://doi.org/10.1007/s11269-018-2038-x
- Hameed, M., Sharqi, S. S., Yaseen, Z. M., Afan, H. A., Hussain, A., & Elshafie, A. (2017). Application of artificial intelligence (AI) techniques in water quality index prediction: A case study in tropical region, Malaysia. Neural Computing and Applications, 28(1), 893–905. https://doi.org/10.1007/s00521-016-2404-7
- Heddam, S., & Kisi, O. (2018). Modelling daily dissolved oxygen concentration using least square support vector machine, multivariate adaptive regression splines and M5 model tree. Journal of Hydrology, 559, 499–509. https://doi.org/10.1016/j.jhydrol.2018.02.061
- Ho, J. Y., Afan, H. A., El-Shafie, A. H., Koting, S. B., Mohd, N. S., Jaafar, W. Z. B., Lai Sai, H., Malek, M. A., Ahmed, A. N., Mohtar, W. H. M. W., Elshorbagy, A., & El-Shafie, A. (2019). Towards a time and cost effective approach to water quality index class prediction. Journal of Hydrology, 575, 148–165. https://doi.org/10.1016/j.jhydrol.2019.05.016
- Jiang, H., & Cotton, W. R. (2004). Soil moisture estimation using an artificial neural network: A feasibility study. Canadian Journal of Remote Sensing, 30(5), 827–839. https://doi.org/10.5589/m04-041
- Karimi, S., Kisi, O., Shiri, J., & Makarynskyy, O. (2013). Neuro-fuzzy and neural network techniques for forecasting sea level in Darwin Harbor, Australia. Computers and Geosciences, 52, 50–59. https://doi.org/10.1016/j.cageo.2012.09.015
- Kido, M., Yustiawati, S., Sulastri, M. S., Hosokawa, T., Tanaka, S., Saito, T., Iwakuma, T., & Kurasaki, M. (2009). Comparison of general water quality of rivers in Indonesia and Japan. Environmental Monitoring and Assessment, 156(1-4), 317–329. https://doi.org/10.1007/s10661-008-0487-z
- Letcher, R. A., Croke, B. F. W., & Jakeman, A. J. (2007). Integrated assessment modelling for water resource allocation and management: A generalised conceptual framework. Environmental Modelling & Software, 22(5), 733–742. https://doi.org/10.1016/j.envsoft.2005.12.014
- Liu, W. C., & Chen, W. B. (2012). Prediction of water temperature in a subtropical subalpine lake using an artificial neural network and three-dimensional circulation models. Computers & Geosciences, 45, 13–25. doi: 10.1016/j.cageo.2012.03.010
- Luo, P., He, B., Takara, K., Razafindrabe, B. H. N., Nover, D., & Yamashiki, Y. (2011). Spatiotemporal trend analysis of recent river water quality conditions in Japan. Journal of Environmental Monitoring, 13(10), 2819. https://doi.org/10.1039/c1em10339c
- Maier, H. R., Jain, A., Dandy, G. C., & Sudheer, K. P. (2010). Methods used for the development of neural networks for the prediction of water resource variables in river systems: Current status and future directions. Environmental Modelling and Software, 25(8), 891–909. https://doi.org/10.1016/j.envsoft.2010.02.003
- Makarynska, D., & Makarynskyy, O. (2008). Predicting sea-level variations at the Cocos (Keeling) Islands with artificial neural networks. Computers and Geosciences, 34(12), 1910–1917. https://doi.org/10.1016/j.cageo.2007.12.004
- Malik, A., Kumar, A., Kisi, O., & Shiri, J. (2019). Evaluating the performance of four different heuristic approaches with Gamma test for daily suspended sediment concentration modeling. Environmental Science and Pollution Research, 26(22), 22670–22687. https://doi.org/10.1007/s11356-019-05553-9
- May, R. J., Dandy, G. C., Maier, H. R., & Nixon, J. B. (2008). Application of partial mutual information variable selection to ANN forecasting of water quality in water distribution systems. Environmental Modelling & Software, 23(10–11), 1289–1299. https://doi.org/10.1016/j.envsoft.2008.03.008
- Mei, K., Zhu, Y., Liao, L., Dahlgren, R., Shang, X., & Zhang, M. (2011). Optimizing water quality monitoring networks using continuous longitudinal monitoring data: A case study of Wen-Rui Tang River, Wenzhou, China. Journal of Environmental Monitoring, 13(10), 2755. https://doi.org/10.1039/c1em10352k
- Olyaie, E., Banejad, H., Chau, K.-W., & Melesse, A. M. (2015). A comparison of various artificial intelligence approaches performance for estimating suspended sediment load of river systems: A case study in United States. Environmental Monitoring and Assessment, 187(4), 189. https://doi.org/10.1007/s10661-015-4381-1
- Othman, F., M E, A. E., & Mohamed, I. (2012). Trend analysis of a tropical urban river water quality in Malaysia. Journal of Environmental Monitoring, 14(12), 3164–3173. https://doi.org/10.1039/c2em30676j
- Rubio-Arias, H., Contreras-Caraveo, M., Quintana, R. M., Saucedo-Teran, R. A., & Pinales-Munguia, A. (2012). An overall water quality index (WQI) for a man-made aquatic reservoir in Mexico. International Journal of Environmental Research and Public Health, 9(5), 1687–1698. https://doi.org/10.3390/ijerph9051687
- Sanikhani, H., Kisi, O., Maroufpoor, E., & Yaseen, Z. M. (2019). Temperature-based modeling of reference evapotranspiration using several artificial intelligence models: Application of different modeling scenarios. Theoretical and Applied Climatology, 135(1-2), 449–462. https://doi.org/10.1007/s00704-018-2390-z
- Sepahvand, A., Singh, B., Sihag, P., & Samani, A. N. (2019). Assessment of the various soft computing techniques to predict sodium absorption ratio (SAR). ISH Journal of Hydraulic Engineering, 5010. https://doi.org/10.1080/09715010.2019.1595185
- Sharma, A., Naidu, M., & Sargaonkar, A. (2013). Development of computer automated decision support system for surface water quality assessment. Computers & Geosciences, 51, 129–134. https://doi.org/10.1016/j.cageo.2012.09.007
- Stambuk-Giljanovic, N. (1999). Water quality evaluation by index in Dalmatia. Water Research, 33(16), 3423–3440. https://doi.org/10.1016/s0043-1354(99)00063-9
- Sudheer, K. P., Gosain, A. K., Mohana Rangan, D., & Saheb, S. M. (2002). Modelling evaporation using an artificial neural network algorithm. Hydrological Processes, 16(16), 3189–3202. https://doi.org/10.1002/hyp.1096
- Tao, H., Bobaker, A. M., Ramal, M. M., Yaseen, Z. M., Hossain, M. S., & Shahid, S. (2019). Determination of biochemical oxygen demand and dissolved oxygen for semi-arid river environment: Application of soft computing models. Environmental Science and Pollution Research, (Zolnikov 2013) 26(1), 923–937. https://doi.org/10.1007/s11356-018-3663-x
- Tung, T. M., & Yaseen, Z. M. (2020). A survey on river water quality modelling using artificial intelligence models: 2000-2020. Journal of Hydrology, 124670. https://doi.org/10.1016/j.jhydrol.2020.124670.
- Wan Mohtar, W. H. M., Abdul Maulud, K. N., Muhammad, N. S., Sharil, S., & Yaseen, Z. M. (2019). Spatial and temporal risk quotient based river assessment for water resources management. Environmental Pollution, 248, 133–144. https://doi.org/10.1016/j.envpol.2019.02.011
- Yaseen, Z. M., Awadh, S. M., Sharafati, A., & Shahid, S. (2018). Complementary data-intelligence model for river flow simulation. Journal of Hydrology, 567, 180–190. https://doi.org/10.1016/j.jhydrol.2018.10.020
- Yaseen, Z. M., Sulaiman, S. O., Deo, R. C., & Chau, K.-W. (2019). An enhanced extreme learning machine model for river flow forecasting: State-of-the-art, practical applications in water resource engineering area and future research direction. Journal of Hydrology, 569, 387–408. https://doi.org/10.1016/j.jhydrol.2018.11.069