
 ?Mathematical formulae have been encoded as MathML and are displayed in this HTML version using MathJax in order to improve their display. Uncheck the box to turn MathJax off. This feature requires Javascript. Click on a formula to zoom.
Abstract
Due to industrial development, the volume of carbon dioxide (CO2) is rapidly increasing.. Several techniques have been used to eliminate CO2 from the output gas mixtures. One of these methods is CO2 capturing by ionic liquids (ILs). Computational models for estimating the CO2 solubility in ILS is of utmost importance. In this research, a white box model in the form of a mathematical correlation using the largest data bank in literature is presented by the group method of data handling (GMDH). This research investigates the application of GMDH intelligent method as a powerful computational approach for predicting CO2 solubility in different ionic liquids with temperature lower and upper than 324 K. In this regard, 4726 data points including the solubility of CO2 in 60 ILs were used for model development Moreover, seven different ionic liquids were selected to perform the external test. To evaluate the validity and efficiency of the suggested model, regression analysis was implemented on the actual and estimated target values. As a result, a proper fit between the experimental and predicted data was obtained and presented by various figures and statistical parameters. It is also worth noting that the predicted negative values in the proposed models are considered zero. Also, the results of the established correlation were compared to other proposed models exist in the literature of ionic liquids. The terminal form of the models suggested by GMDH approach and obtained based on temperature are two simple mathematical correlations by exerting input parameters of temperature (T), pressure (P), critical temperature (Tc), critical pressure (Pc) and, acentric factor (ω) which does not suffer from the black box property of other neural network algorithms. The model suggested in this work, would be a promising one which can act as an efficient predictor for CO2 solubility estimation in ILs and is capable of being used in different industries.
1. Introduction
The world has faced an unprecedented and increasing utility of fossil fuels containing noticeable carbon content, due to human activities in recent years. These fuels are introduced as the main reason for greenhouse gas emissions. The well-known expression ‘greenhouse gas’, belongs to some particular atmospheric gases with a thermal infrared range between 5.6 μm and 1 cm (Ai et al., Citation2005; Baghban et al., Citation2016; Deolalkar et al., Citation2015; Saeidi et al., Citation2014; Tuckett, Citation2016). Several gases presented in the atmosphere can be considered as a member of greenhouse gases family (Sahoo & Ray, Citation2006). Carbon dioxide, as one of them, can result in destructive changes in climate and is essential to be eliminated from the gas mixtures of greenhouse gas resources (Baghban et al., Citation2015). Due to global warming and environmental problems caused by CO2 emission, using new strategies and cost-effective technologies for the removal of acid gases from their sources would be essential in the future (Adger & Brown, Citation1994; Nash & Lumetta, Citation2011). Up to now, several methods and technologies have been introduced to remove carbon dioxide from the flue gas mixtures produced by fossil fuels. The removal technologies consist of a (1) Selective carbon dioxide capturing from the gas mixtures. (2) Conversion of pure carbon dioxide into the supercritical state by compression. (3) Transferring and injection of the removed and compressed CO2 to a permanent underground or submarine storage reservoir (Soltanian et al., Citation2019; Ershadnia et al., Citation2020). Carbon dioxide capturing technologies with their advantages and disadvantages are divided into three categories: oxyfuel, pre-combustion, and post-combustion. In the oxyfuel CO2 removal method, the air is not used during the combustion and pure oxygen is used instead. In the pre-combustion technique, CO2 separation from the gas components is performed before the combustion process. On the contrary, the CO2 removal process is after combustion occurrence in the post-combustion method. As the most utilized carbon dioxide capturing technology in the industry, the post-combustion method, by itself, is classified into physical and chemical absorption, cryogenic or temperature reduction separation, adsorption, and membranes application techniques (Baghban et al., Citation2015; Liu et al., Citation2012; Mathieu, Citation2010). Among all of the mentioned technologies, absorption and separation of the target carbon dioxide with diverse amine aqueous solutions have been broadly used over the past years (Baghban et al., Citation2015; Bougie & Iliuta, Citation2010; Mangalapally et al., Citation2012). The most commonly used amines, with their benefits and defects, in CO2 capturing process, are monoethanolamine (MEA), N-methyl pyrrolidone (NMP), methyldiethanolamine (MDEA), diethanolamine (DEA), and piperazine (PZ) (Kuenemann & Fourches, Citation2017; Singh, Citation2011). Carbon dioxide elimination from the blends of synthesis gases, natural gases, and refinery gases using amine aqueous solutions, has been widely utilized from past to now. Besides their advantages, such volatile organic solvents have shown several detrimental effects such as corrosive byproducts generation when degraded, equipment failure due to water accumulation during desorption process and high quantity of evaporation trait (Baghban et al., Citation2017; Jou et al., Citation1982; Kennard & Meisen, Citation1984; Rho et al., Citation1997; Speyer et al., Citation2010). The significant issue of greenhouse gases, demands to seek and develop new, eco-friendly, and efficient technologies for optimum carbon dioxide elimination from the flue gases. Moreover, it is vital to search for novel solvents that are appropriate for acid gas removal applications. Nowadays, Ionic liquids (ILs) have presented unique and desirable properties as particular solvents required for CO2 capturing process. These kinds of solvents, unlike the amine solutions, are without any damaging effects on the environment and benefits both today's industry and scientific researches. ILs are complexes of cations and anions in an aqueous solvent exactly alike what forms NaCl solution. Light interface or vapor pressure, dissolution feasibility of diverse materials including organic, inorganic, and organometallic compounds, an impressive amount of thermal conductivity and stability, strong polarity and impossibility of mixing with organic solvents are some positive and favorable features of ILs in contrast with organic solvents. Such properties mentioned above, have led these unique and privileged solutions to be introduced as applied solvents for production of compounds with efficient thermal conductivity, metal ions removal, acid gases capturing, etc. Consequently, ILs can act as acceptable alternatives for other CO2 removal solvents. In the literature, several various pieces of research performed on ILs and its capability for carbon dioxide removal applications, are presented (Afzal et al., Citation2013; Ai et al., Citation2005; Baghban et al., Citation2017; Brennecke & Maginn, Citation2001; Costantini et al., Citation2005; Dash et al., Citation2011; S. Jang et al., Citation2010; Jou et al., Citation1982; Kennard & Meisen, Citation1984; Park et al., Citation2002; Rho et al., Citation1997; Sakhaeinia et al., Citation2010; Sánchez et al., Citation2007; Seddon, Citation1995; Shafiei et al., Citation2014; Shiflett et al., Citation2008; Shiflett & Yokozeki, Citation2006; Shin & Lee, Citation2008; Shokouhi et al., Citation2010; Song et al., Citation2010; Speyer et al., Citation2010; Tagiuri et al., Citation2014; Tatar et al., Citation2016; S. Zhang et al., Citation2005; Zhao et al., Citation2005). Besides all complexities and difficulties that might be faced when performing laboratory activities, some other negative points such as cost and time limitations and the risks and dangers made by experimental conditions must be considered (Barati-Harooni et al., Citation2017). Therefore, as a crucial issue, the utility of efficient and precise models required for phase behavior provision, makes it easier to evaluate process condition and related problems. Today, intelligent approaches such as an artificial neural network (ANN) and fuzzy logic, with their various methods, as recognized as appropriate modeling tools and good protectors for a phase behavior assessment (Barati-Harooni et al., Citation2017; Eslamimanesh et al., Citation2011; Gaines, Citation1976). These can help accurate and exact validation of experimental results based on statistics without considering precondition of input and output data. As a matter of fact, approaching reliable models for nonlinear databases comes to reality with such different precise methods (Baghban et al., Citation2019; Faizollahzadeh Ardabili et al., Citation2018; Ghalandari et al., Citation2019). Artificial neural network (ANN), a branch of artificial intelligence science, has been used extensively for relating inputs and outputs of different data sources and approaching acceptable models in diverse fields, as yet. ANNs have indicated a helpful and fruitful application for solubility modeling of different gases in ionic and non-ionic solutions (Baghban et al., Citation2019; Faizollahzadeh Ardabili et al., Citation2018; Ghalandari et al., Citation2019; Golzar et al., Citation2016; Mohanraj et al., Citation2015; Qiu-Hao & Yun-Long, Citation2006; Tatar et al., Citation2016; J. Zhang et al., Citation2016). As the ultimate purpose of the present research, CO2 absorption in ionic liquids with a particular ANN’s method proves what mentioned above. In the literature, several various ANNs methods have been utilized for carbon dioxide absorption modeling in ILs including: Adaptive Neuro-Fuzzy Inference System (ANFIS), Radial Basis Function Artificial Neural Network (RBF-ANN), Multi-Layer Perceptron Artificial Neural Network (MLP-ANN), Least Square Support Vector Machine (LSSVM), and Committee machine intelligent system (CMIS) (Ahmadi, Citation2012; Ahmadi, Ebadi, et al., Citation2013; Ahmadi & Shadizadeh, Citation2012; Baghban et al., Citation2015; Baghban et al., Citation2017; Barati-Harooni et al., Citation2017; Broomhead & Lowe, Citation1988; Eslamimanesh et al., Citation2011; Gaines, Citation1976; Heidari et al., Citation2016; Huang & Zhang, Citation1994; J.-S. Jang & Sun, Citation1995; Nilsson & Machines, Citation1965; Santos et al., Citation2013; Singh, Citation2011; Tatar et al., Citation2016). In these techniques, optimization of tuning parameters is performed by using some special algorithms such as Particle Swarm Optimization (PSO), Genetic algorithm (GA), Imperialist Competitive Algorithm (ICA), coupled simulated annealing (CSA), etc. (Ahmadi, Zendehboudi, et al., Citation2013; Baghban et al., Citation2015; Golzar et al., Citation2016; Hemmati-Sarapardeh et al., Citation2019; Lashkarbolooki et al., Citation2013; Qiu-Hao & Yun-Long, Citation2006; Shafiei et al., Citation2014; Vapnik & Vapnik, Citation1998; Zadeh, Citation1965). In 2017, Baghban et al. employed an extensive dataset aiming for CO2 absorption modeling in ILs. RBF-ANN, MLP-ANN, LSSVM, and ANFIS techniques were applied for their scientific work (Baghban et al., Citation2017). These methods are also known as artificial intelligent black box models. In such opaque approaches, as a negative aspect, the internal structure of the system is indeterminate or need not be considered for particular purposes. Thus, practically it is not possible to generate a logical and simple correlation between the input and output data collections (Ershadnia et al., Citation2020; Vapnik & Vapnik, Citation1998). In the present study, the group method of data handling (GMDH), as a novel and applicable method, was used to determine CO2 solubility in ionic liquids. This method is a significantly applicable one for non-linear and complicated cases treatment, besides not suffering from such black box ANN’s limitation manner. In other words, GMDH, as a white box method, makes it possible to detect inner components or logic of the system resulting in a simple and comprehensible mathematical correlation between inputs and output (Sahoo & Ray, Citation2006; Vapnik & Vapnik, Citation1998; Zendehboudi et al., Citation2013). The dataset used here is similar to what employed in Baghban et al. (Citation2017) paper except that instead of using conventional ANNs methods, the application of the GMDH technique for CO2 solubility in ILs was investigated. Moreover, just similar to what inspected in their article, CO2 solubility in a wide class of ionic liquids such as: [bmim][BF4], [bmim][PF6], [emim][EtSO4], [omim][BF4], [C8mim][PF6], [DMIm][Tf2N], [bmim][Tf2N], [HMIm][Tf2N], [P14,6,6,6][Tf2N], [THTDP][NTf2], [THTDP][Cl], [C6mim][BF4], [bmim][Ac], [EMIm][Tf2N], [C8-mim][Tf2N], [N4,1,1,1][NTf2], [bmim][Cl], [HMP][Tf2N], [BMP][Tf2N], [BMP][MeSO4], [HHEMEL], [c2mim][C(CN)3], [BHEAA], [HHEMEA], [BHEAL], [C7mpy][Tf2N], [C3mpy][Tf2N], [C9mpy][Tf2N], [C5mpy][Tf2N], [bmim][CH3SO4], [c2mim][SCN], [c2mim][N(CN)2], [emim][BF4], [C9mim][PF6], [C6mim][PF6], 1-Bromohexane, m-2-HEAA, [N1,8,8,8][NTf2], [P6,6,6,14][Cl], [Pyrr4,1][NTf2], 1-Methylimidazole, m-2-HEAF, [P14,6,6,6][Tf2N], [thtdp][phos], [thtdp][Br], [thtdp][dca], [emim][TFA], [emim][Ac], [C6mim][TfO], [C2mim][TfO], [C8mim][TfO], [C4mim][TfO], [hemim][BF4], [emim][PF6], [BMP][TfO], [bmmim][Tf2N], [P4441][Tf2N], [bmmim][Tf2N], [p(5)mpyrr][Tf2N], [HMIM][MeSO4], [C4mim][DCA], (Tuckett, Citation2016)[Tf2N], [TDC][TF2N], [TDC][DCN] and [EMMP][TF2N] was examined at this work.
2. Data set preparation
Applying extensive and valid databank aiming to proper and precise mathematical model achievement is a vital stage in the modeling process. In this study, a wide and perfect CO2 solubility database (including 5368 date points) where employed which are gathered from different references in the literature. This database contains pseudo temperature, pseudo pressure, temperature, pressure and acentric factor as input parameters that are used to make two accurate models capable of predicting carbon dioxide solubility in ionic liquids based on temperature as to the target data. It should be considered that the data points used here are similar to what Baghban et al. used in their scientific work (Baghban et al., Citation2017). A short description of the statistical properties of the data bank used in the current study is presented in Table . Each ionic liquid is distinct from its thermodynamic features of critical temperature, critical pressure, and acentric factor. Moreover, for inspecting the distribution condition of the input and output data points, histogram of data is prepared for them which is illustrated in Figure . Based on this figure, distribution desirability and normality of the input and output variables is confirmed by using such diagrams.
Figure 1. Histogram of residuals for inputs (P, T, Pc, Tc, ω) and output (CO2 solubility) in this study.
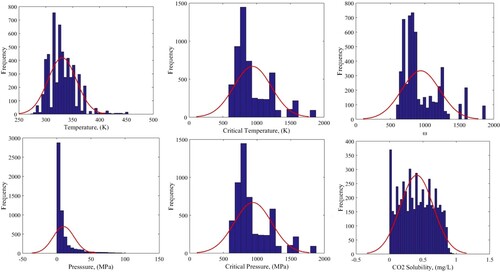
Table 1. Data properties used in this study.
3. Model development
3.1. Group method of data handling
As mentioned before, to encounter intricate computational problems, different intelligent approaches have been introduced. These smart techniques benefit various algorithms and can simplify complex nonlinear problems resulting in accurate modeling outputs. Group method of handling (GMDH), as one of the intelligent algorithms, correlates the input variables and the corresponding target by an explicit modeling approach. This algorithm was introduced by Ivakhnenko in 1972 for the first time (Zendehboudi et al., Citation2013). Shankar found out the self-organized acting feature of the GMDH approach in 1979 (Bunge, Citation1963). Thereinafter, some researchers studied this method more and published the obtained results. In their research, it is stated that the intelligent GMDH method is the most efficient one for pattern distinction, detection of function and short/long-term estimation of accidental processes in complicated systems (Nakhaeizadeh, Citation1992). In other words, it has been detected that other modeling techniques possess significant limitations when compared with the GMDH approach. This method has been utilized in different fields of science and engineering such as weather modeling, multi-sensor signal processing, acoustic and ultrasonic emissions, environmental systems, Eddy currents, medical diagnostics, marketing, X-Ray, etc. (Bunge, Citation1963; Dargahi-Zarandi et al., Citation2017; Farlow, Citation1984; A. Ivakhnenko & Krotov, Citation1984; A. G. Ivakhnenko et al., Citation1979; Sawaragi et al., Citation1979; Vapnik & Vapnik, Citation1998). It should be noted that the application of GMDH in chemistry and different branches of chemical engineering is rare and few scientific types of research have been implemented in these fields. However, in the present work, some of the related infrequent publications are referred to for someone who tends to gain additional information in the mentioned areas (Atashrouz et al., Citation2014; Atashrouz et al., Citation2015; Madala, Citation2019; Rostami et al., Citation2019; Varamesh, Hemmati-Sarapardeh, Moraveji, et al., Citation2017; Zendehboudi et al., Citation2012). GMDH also called polynomial neural network contains such a layered construction in which several independent neurons or nodes are joined to the primary structure. Every node in this structure is generated by the combination of quadratic polynomial equations of the previous independent neurons (Najafi-Marghmaleki et al., Citation2017). Ivakhnenko in his research presented the most appropriate form of quadratic polynomial expressions which are applicable in the GMDH method. In this method, input variables are related to the output of model by utilizing a particular series introduced by Volterra-Kolmogorov-Gabor as following (Baghban et al., Citation2017):
(1)
(1)
The variables applied in this kind of equation are defined as below:
: output parameter
In the next step, a matrix of output variables is generated based on the above equation. Afterward, input variables are incorporated using a quadratic polynomial and the new variables () created by this method are replaced with the neurons in the prior layers which are illustrated as follows:
(2)
(2)
Consequently, the new matrix of variables is in the form of . The coefficients of the above equation are determined by utilizing the least square method (LSM). The relation used to examine the similarity of the experimental and predicted data points is presented in Equation (3) (Hosseinzadeh et al., Citation2016; Madala, Citation2019).
(3)
(3)
In this equation, Nt and M signify the number of data points placed in a training class and the number of independent parameters, respectively. Then, the generic construction of matrix will be formed by employing quadratic polynomial as below:
(4)
(4)
(5)
(5)
(6)
(6)
In which n is the number of input variables, T symbolizes the transpose of matrix and A represents the vector of quadratic polynomial coefficients. Real data sets include training and testing data. Training data are applicable in obtaining coefficients of the equation, however, testing data help for specifying the best incorporation of two parameters. It must be checked whether the model output data and experimental data can be used in the condition below or not:
(7)
(7)
In this equation, if the condition of being lower than the error quantity is satisfied for δi2, then the new independent variable will be saved. Otherwise, it will be eliminated. The error value is calculated and saved in each step of iteration and once the minimum amount of error is obtained the algorithm is stopped.
3.2. Hybrid group method of handling
In the current study, the hybrid group method of handling as a proper type of GMDH method was applied. Due to the restrictions, the ordinary GMDH method encounters, this modified type of GMDH was developed and introduced. This technique benefits two exclusive properties: First, an instant combination of more than two input variables and second, nodal junction with different layers. The hybrid form of GMDH method is correlated as follows (Hosseinzadeh et al., Citation2016; A. Shariati & C. J. Peters, Citation2004; Varamesh, Hemmati-Sarapardeh, Dabir, et al., Citation2017; Varamesh, Hemmati-Sarapardeh, Moraveji, et al., Citation2017):
(8)
(8)
In Equation (8), l denotes the size of layers. In fact, this format of GMDH provides more interplay between the correlating parameters. Therefore, it is capable enough to treat complex systems (Varamesh, Hemmati-Sarapardeh, Dabir, et al., Citation2017).
4. Model appraisal
4.1 Error checking
In order to evaluate the behavior and precision of the model suggested by the GMDH technique, some statistical correlations including R-squared (R2), root mean square error (RMSE), and standard deviation (SD) are applied. These mathematical functions are presented below (Barati-Harooni et al., Citation2017; Y. Kim et al., Citation2005; A. Shariati & C. J. Peters, Citation2004; Tatar et al., Citation2016):
R-squared (R2).
Root mean square error (RMSE).
Standard deviation (SD).
In these relations, expresses solubility and exp and pre signify experimental and predicted, respectively. The statistical indices of the proposed model for CO2 solubility determination are reported in Table .
4.2. Graphical error plots
Applying graphical diagrams is another suitable way to evaluate the efficiency of the output model. Two types of graphical plots are utilized in this study: cross-plot and error distribution diagram. In cross-plot, the calculated data points versus experimental ones are demonstrated in a graphical diagram. It helps to assess the performance of the experimental data forecasting process. In the second type, the error deviation from a baseline named zero error line is illustrated. The zero line is a criterion for the obtained model accuracy and being far from this line is interpreted as the incompatibility of experimental and predicted data points resulting in lower efficiencies.
5. Results and discussion
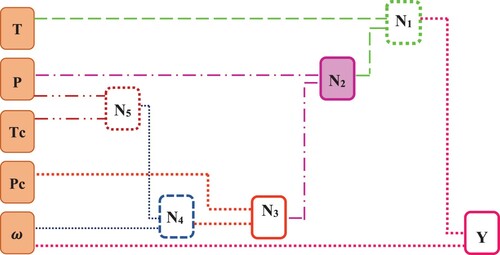
The present research applies a novel approach for CO2 solubility modeling in ionic liquids based on temperature (T), pressure (P), critical temperature (Tc), critical pressure (Pc), and acentric factor (ω), as independent input parameters. As it was stated earlier, an extensive data bank of 4726 data points were utilized to construct and develop the model and the hybrid GMDH algorithm was used for this purpose. The database was separated into two classes in which 80% of the data points belong to the training set and the remaining 20% includes the testing set. This classification was conducted by computerized random selection methods. As well as that, 642 data points including 7 different ionic liquids such as ([EMIm][Tf2N], [emim][TFA], [BMP][TfO], [bheal], [hhemel], [Tf2N], [P14,6,6,6][Tf2N]) were selected for external test. Another point must be accounted is that the predicted negative values in the proposed models are considered zero. In Figure , the schematic illustration of the proposed hybrid GMDH construction used to estimate CO2 solubility in ILs is exhibited. Here, for temperature lower than 324 K, the nodal network consists of single input and output layers and 5 middle ones. As the ultimate purpose of this research, the following correlations represent the mathematical output of the model (CO2 solubility calculation in ILs) developed by the Hybrid GMDH neural network.
Figure 2. A schematic of the proposed GMDH neural network.
Furthermore, in this research the other correlation was proposed to estimate CO2 solubility at range of temperature upper than 324 K exhibited at below:
In the above-mentioned correlations, pressure and critical pressure are in (MPa), temperature and critical temperature are in (K), CO2 solubility is in (mg/l) and acentric factor is a unitless parameter. In addition, the middle layers imply the neurons or virtual input parameters utilized in the GMDH algorithm. These variables, by themselves, are correlated with each other and/or actual statistical data bank parameters. To evaluate the accuracy of the suggested models, error analysis was conducted by the related statistical correlations for the entire databank. The results are presented in Table . As illustrated, the amount of R2 and RMSE for both testing and training set are remarkably close to 1 and 0, respectively. Moreover, the resemblance between the training set and testing one shown in this table, illustrates the lack of an overfitted model. Baghban et al. (Citation2017) developed a high-precision model for predicting CO2 solubility that reported less error than the model presented in this study. But this model is black box and its use requires special software. The model presented in this research is white box and it is possible to find out what happened inside the model. Also, Table demonstrates the statistical comparison between the proposed models in this study and other models available in the literature of CO2 solubility.
Table 2. Statistical parameters of the proposed model for determination of CO2 solubility.
Table 3. Statistical evaluation of the proposed models in this study and other models in the literature of CO2 solubility.
Figure 3. Cross plots of GMDH model and external test in predicting CO2 solubility, respectively.
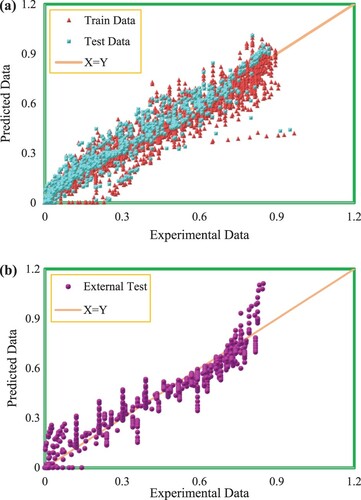
Figure 4. Error distribution of GMDH model in predicting CO2 solubility.
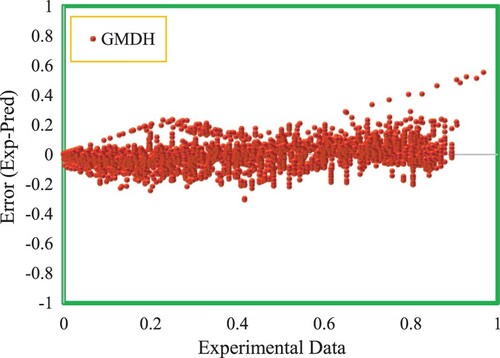
Figure 5. Histogram of residuals for the GMDH model at (a) training and (b) testing stages
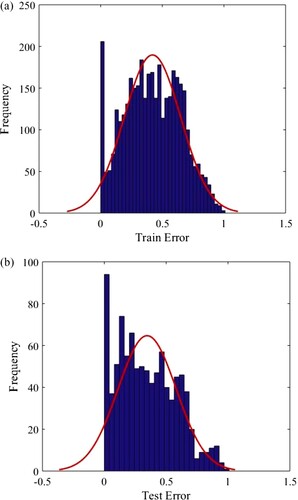
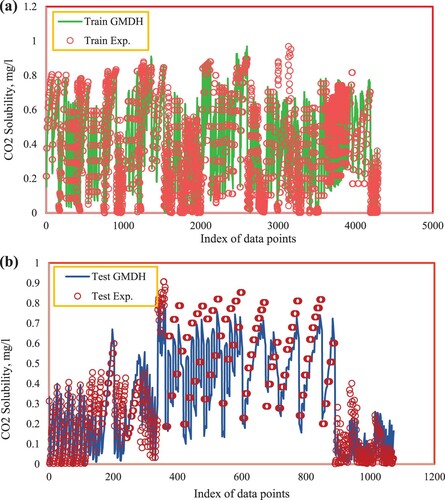
Consequently, due to the appropriate features enumerated, the hybrid group method of handling technique has presented great performance in CO2 solubility prediction in ILs. In Figure , testing and training data sets are drawn in a cross-plot for the model’s outputs. According to this figure, a high concentration of data points including testing and training ones is observed nearby the unit slope line meaning that a proper matching between the predicted and experimental data points has occurred. The efficiency of the model is also concluded from the values of R2 which is near 1 for both testing and training sets (R2test set = 0.90435, R2training set = 0.90595). Another significant graphical diagram used to evaluate the quality of the proposed model is displayed in Figure . As demonstrated, a dense class of data points is located around the horizontal error line which proves the good precision of the developed hybrid GMDH model. Histogram plots of residual are statistical tools to specify the performance of the model and are an indication of the discrepancy of the actual and predicted values. The distribution of residuals for testing and training data points are displayed in Figure . As shown in this figure, the differences between the actual and estimated data points track a normal distribution concluded from the symmetrical bell form of the histograms of residuals. The great accuracy of the ultimate model of this research is also proved by Figure in which the comparison of real and predicted target values by considering the entire data points including the testing and training sub data is demonstrated. Based on this figure, the output values estimated by the suggested hybrid GMDH follow the trend of the actual CO2 solubility data points in an exact way. Consequently, the claim of the precise and efficient performance of the proposed modeling technique is confirmed.
Figure 6. (a,b) Experimental versus GMDH predicted mole fraction of CO2 at training and testing stages.
In order to find out the effect of each input variable on the output of model (CO2 solubility in ILs), a particular function known as relevancy factor is used. As a particular tool, this mathematical correlation can help to find the effect of input parameters with high impact on the output (Baghban et al., Citation2017; Yim & Lim, Citation2013; Zendehboudi et al., Citation2012). The values of the mentioned function vary between -1 and 1 in which the positive sign determines a direct relationship between the input applied in the relevancy factor relation and output, however, the negative sign shows an inverse one. Larger absolute amount of relevancy factor means that the output parameter is affected by the corresponding input more than other inputs. Relevancy factor is measured based on the following relation:
(12)
(12) where
and
belong to the ith and average values of the kth input, respectively .
is the symbol of ith value of predicted solubility and
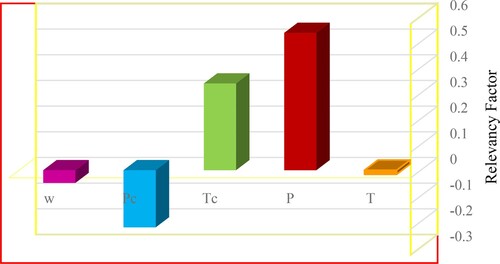
shows the mean value of solubilities. k can be each of input parameters of temperature, pressure, critical temperature, critical pressure and acentric factor. The relevancy factor for each input variable (P, T, Pc, Tc, ω) was calculated by means of Equation (12). The obtained results are displaced in Figure . According to this figure, among the input parameters, pressure has the highest value of relevancy factor followed by critical temperature. As a result, CO2 solubility in ILs is dependent to pressure more than the other input variables. In addition, all of the input parameters except critical pressure possess positive relevancy factor so that changing each of them will alter the output value in a direct manner. On the country, CO2 solubility in ILs represents an opposite behavior against critical pressure. In other words, CO2 solubility lowers by increasing critical pressure (Hemmati-Sarapardeh et al., Citation2020; Menad et al., Citation2019; Mokarizadeh et al., Citation2020).
Figure 7. Sensitivity analysis of GMDH model to find out the effect of inputs on CO2 solubility in ILs.
In order to compare the experimental and predicted result values and check the physical validity of the proposed model, variation of CO2 solubility in one ionic liquid ([bmim][Tf2N]) against input parameters of pressure and temperature was investigated in Figure . In this figure, the exact matching between the actual and estimated output results signify the high quality of the proposed hybrid GMDH method.
Figure 8. (a,b) Experimental data and predict data by GMDH model for CO2 solubility of [bmim][Tf2N] and [EMIm][Tf2N] respectively at different pressure and temperature.
![Figure 8. (a,b) Experimental data and predict data by GMDH model for CO2 solubility of [bmim][Tf2N] and [EMIm][Tf2N] respectively at different pressure and temperature.](/cms/asset/f1b5e998-3ca3-4a90-a605-037498ad483e/tcfm_a_1842250_f0008_oc.jpg)
With the purpose of outlier determination in data source, William’s plot was applied in which standardized residuals versus hat value are plotted. Hat values are calculated using hat matrix which is formulated as below:
(13)
(13) where X stands to the m × n matrix and m and n are sample size and model variables, respectively. Moreover, the following relation is used to obtain the leverage limit:
(14)
(14)
William’s plot for the present study is shown in Figure in which doubtful and reliable data points are determined. Regarding to this figure, the enclosed data points presented between the standardized residuals (y = –3 and y = 3) and leverage limit are considered as valid data points, while the others out of this domain are known as outliers. Experimental data which are identified as outliers based on the leverage approach are listed in Table . As reported in this table, 236 data points of the databank containing 5368 data are placed in the outlier category.
Figure 9. Detection of the probable outliers and applicability domain of the developed model.
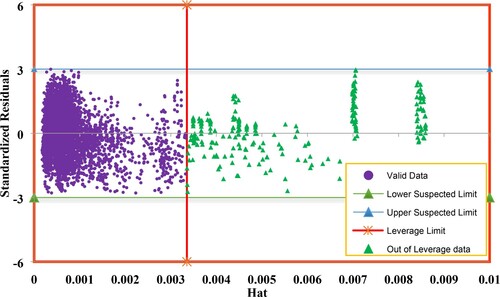
Table 4. Experimental data which are out of the applicability domain of the GMDH model based on the leverage approach.
Figure depicts the pressure as one of the input parameters for two ionic liquids([bmim][Tf2N] and (Broomhead & Lowe)) versus the laboratory output data and predicted data in this study to investigate the effect of input variables on the performance of the GMDH model. As the laboratory data report, with increasing pressure, the carbon dioxide solubility increases and also the model presented in this research reports an increasing trend for all data in the figure.
Figure 10. (a,b) Detects the effect of boundaries on the performance of the GMDH model by two ionic liquids ([bmim][Tf2N] and (Broomhead & Lowe)).
![Figure 10. (a,b) Detects the effect of boundaries on the performance of the GMDH model by two ionic liquids ([bmim][Tf2N] and (Broomhead & Lowe)).](/cms/asset/9c9bed20-0289-4343-a47c-1e6b5e5b6ffc/tcfm_a_1842250_f0010_oc.jpg)
6. Conclusions
In the current study, the performance of a particular smart algorithm for estimation of CO2 solubility in 67 types of ionic liquids as a function of temperature (T), pressure (P), critical temperature (Tc), critical pressure (Pc) and, acentric factor (ω) was examined. For this purpose, a comprehensive data source (5368 data points) similar to what was used in Baghban et al. paper was applied to be used during the CO2 solubility modeling process (Baghban et al., Citation2017). It should be noted that in the present research 4726 data points including 60 ionic liquids were applied to develop two models and 642 data points including 7 ionic liquids were selected for the external test. These two models were developed for temperature lower and upper than 324 K. Baghban et al. utilized LSSVM, ANFIS, MLP-ANN, and RBF-ANN intelligent methods aiming to predict CO2 solubility in different ionic liquids. In comparison with the enumerated methods, hybrid GMDH neural network as the technique used in this research, illustrated acceptable accuracy which was shown by the statistical parameters calculated. The mean square (R2) value for the suggested GMDH model obtained 0.90435 which was a little lower than its value in the aforementioned modeling algorithms (R2GMDH = 0.92, R2LSSVM = 0.9942, R2ANFIS = 0.91685, R2MLP-ANN = 0.9715, R2RBF-ANN =0.9789) nevertheless, a suitable matching between the actual and output amounts of the proposed model is represented which is interpreted as the efficient performance of the GMDH algorithm to predict CO2 solubility in ILs. In addition, the output of the GMDH algorithm is a simple and explicit mathematical relation. This property is the principal advantage of this technique over the other artificial neural network methods in which black box systems are used. Consequently, the model obtained in the present research as a dependable tool can help various technologies such as CO2 sequestration and gas purification to have an acceptable prediction of CO2 solubility in various ionic liquids when there is little information about experimental data points.
For some ionic liquids, including [bheaa], [P6,6,6,14][Cl], [bheal], [hhemea], [N1,8,8,8][NTf2], [DMIm][Tf2N], [HMIm][Br], [N4111][Ntf2], and [emim][BF4], very few laboratory data are available in the literature. It is suggested to measure the CO2 solubility in these ionic liquids over a wider range of temperature and pressure. Also, in general, the temperature range used for ionic liquids in this study is between 271.11 and 453.15 K and the pressure range is between 0.0089 and 100.12 MPa, which in future studies, it is suggested to measure the CO2 solubility for these ionic liquids outside this temperature and pressure range. Furthermore, this model can be used in the temperature and pressure range developed for the 67 ionic liquids mentioned, and outside this range the model probably reports a high error.
Acknowledgements
The support of Alexander von Humboldt Foundation is acknowledged. We acknowledge the ‘Open Access Funding by the Publication Fund of the TU Dresden’.
Disclosure statement
No potential conflict of interest was reported by the author(s).
Additional information
Funding
References
- Adger, W. N., & Brown, K. (1994). Land use and the causes of global warming. John Wiley & Sons.
- Afzal, W., Liu, X., & Prausnitz, J. M. (2013). Solubilities of some gases in four immidazolium-based ionic liquids. The Journal of Chemical Thermodynamics, 63, 88–94. https://doi.org/https://doi.org/10.1016/j.jct.2013.03.007
- Ahmadi, M. A. (2012). Neural network based unified particle swarm optimization for prediction of asphaltene precipitation. Fluid Phase Equilibria, 314, 46–51. https://doi.org/https://doi.org/10.1016/j.fluid.2011.10.016
- Ahmadi, M. A., Ebadi, M., Shokrollahi, A., & Majidi, S. M. J. (2013). Evolving artificial neural network and imperialist competitive algorithm for prediction oil flow rate of the reservoir. Applied Soft Computing, 13(2), 1085–1098. https://doi.org/https://doi.org/10.1016/j.asoc.2012.10.009
- Ahmadi, M. A., & Shadizadeh, S. R. (2012). New approach for prediction of asphaltene precipitation due to natural depletion by using evolutionary algorithm concept. Fuel, 102, 716–723. https://doi.org/https://doi.org/10.1016/j.fuel.2012.05.050
- Ahmadi, M. A., Zendehboudi, S., Lohi, A., Elkamel, A., & Chatzis, I. (2013). Reservoir permeability prediction by neural networks combined with hybrid genetic algorithm and particle swarm optimization. Geophysical Prospecting, 61(3), 582–598. https://doi.org/https://doi.org/10.1111/j.1365-2478.2012.01080.x
- Ai, N., Chen, J., & Fei, W. (2005). Solubility of carbon dioxide in four mixed solvents. Journal of Chemical & Engineering Data, 50(2), 492–496. https://doi.org/https://doi.org/10.1021/je049696s
- Atashrouz, S., Pazuki, G., & Alimoradi, Y. (2014). Estimation of the viscosity of nine nanofluids using a hybrid GMDH-type neural network system. Fluid Phase Equilibria, 372, 43–48. https://doi.org/https://doi.org/10.1016/j.fluid.2014.03.031
- Atashrouz, S., Pazuki, G., & Kakhki, S. S. (2015). A GMDH-type neural network for prediction of water activity in glycol and poly (ethylene glycol) solutions. Journal of Molecular Liquids, 202, 95–100. https://doi.org/https://doi.org/10.1016/j.molliq.2014.12.013
- Baghban, A., Ahmadi, M. A., & Shahraki, B. H. (2015). Prediction carbon dioxide solubility in presence of various ionic liquids using computational intelligence approaches. The Journal of Supercritical Fluids, 98, 50–64. https://doi.org/https://doi.org/10.1016/j.supflu.2015.01.002
- Baghban, A., Bahadori, M., Lee, M., Bahadori, A., & Kashiwao, T. (2016). Modelling of CO2 separation from gas streams emissions in the oil and gas industries. Petroleum Science and Technology, 34(14), 1291–1299. https://doi.org/https://doi.org/10.1080/10916466.2016.1200079
- Baghban, A., Jalali, A., Shafiee, M., Ahmadi, M. H., & Chau, K.-W. (2019). Developing an ANFIS-based swarm concept model for estimating the relative viscosity of nanofluids. Engineering Applications of Computational Fluid Mechanics, 13(1), 26–39. https://doi.org/https://doi.org/10.1080/19942060.2018.1542345
- Baghban, A., Mohammadi, A. H., & Taleghani, M. S. (2017). Rigorous modeling of CO2 equilibrium absorption in ionic liquids. International Journal of Greenhouse Gas Control, 58, 19–41. https://doi.org/https://doi.org/10.1016/j.ijggc.2016.12.009
- Barati-Harooni, A., Najafi-Marghmaleki, A., & Mohammadi, A. H. (2017). Efficient estimation of acid gases (CO2 and H2S) absorption in ionic liquids. International Journal of Greenhouse Gas Control, 63, 338–349. https://doi.org/https://doi.org/10.1016/j.ijggc.2017.05.014
- Blanchard, L. A., Gu, Z., & Brennecke, J. F. (2001). High-pressure phase behavior of ionic liquid/CO2 systems. The Journal of Physical Chemistry B, 105(12), 2437–2444. https://doi.org/https://doi.org/10.1021/jp003309d
- Bougie, F., & Iliuta, M. C. (2010). CO2 absorption into mixed aqueous solutions of 2-amino-2-hydroxymethyl-1, 3-propanediol and piperazine. Industrial & Engineering Chemistry Research, 49(3), 1150–1159. https://doi.org/https://doi.org/10.1021/ie900705y
- Brennecke, J. F., & Maginn, E. J. (2001). Ionic liquids: Innovative fluids for chemical processing. AIChE Journal, 47(11), 2384–2389. https://doi.org/https://doi.org/10.1002/aic.690471102
- Broomhead, D. S., & Lowe, D. (1988). Radial basis functions, multi-variable functional interpolation and adaptive networks.
- Bunge, M. (1963). A general black box theory. Philosophy of Science, 30(4), 346–358. https://doi.org/https://doi.org/10.1086/287954
- Carvalho, P. J., Alvarez, V. H., Marrucho, I. M., Aznar, M., & Coutinho, J. A. (2010). High carbon dioxide solubilities in trihexyltetradecylphosphonium-based ionic liquids. The Journal of Supercritical Fluids, 52(3), 258–265. https://doi.org/https://doi.org/10.1016/j.supflu.2010.02.002
- Costantini, M., Toussaint, V. A., Shariati, A., Peters, C. J., & Kikic, I. (2005). High-pressure phase behavior of systems with ionic liquids: Part IV. Binary system carbon dioxide+ 1-hexyl-3-methylimidazolium tetrafluoroborate. Journal of Chemical & Engineering Data, 50(1), 52–55. https://doi.org/https://doi.org/10.1021/je049870c
- Dargahi-Zarandi, A., Hemmati-Sarapardeh, A., Hajirezaie, S., Dabir, B., & Atashrouz, S. (2017). Modeling gas/vapor viscosity of hydrocarbon fluids using a hybrid GMDH-type neural network system. Journal of Molecular Liquids, 236, 162–171. https://doi.org/https://doi.org/10.1016/j.molliq.2017.03.066
- Dash, S. K., Samanta, A. N., & Bandyopadhyay, S. S. (2011). (Vapour+ liquid) equilibria (VLE) of CO2 in aqueous solutions of 2-amino-2-methyl-1-propanol: New data and modelling using eNRTL-equation. The Journal of Chemical Thermodynamics, 43(8), 1278–1285. https://doi.org/https://doi.org/10.1016/j.jct.2011.03.016
- Deolalkar, S., Shah, A., & Davergave, N. (2015). Designing green cement plants. Butterworth-Heinemann.
- Ershadnia, R., Amooie, M. A., Shams, R., Hajirezaie, S., Liu, Y., Jamshidi, S., & Soltanian, M. R. (2020). Non-Newtonian fluid flow dynamics in rotating annular media: Physics-based and data-driven modeling. Journal of Petroleum Science and Engineering, 185, Article 106641. https://doi.org/https://doi.org/10.1016/j.petrol.2019.106641
- Ershadnia, R., Wallace, C. D., & Soltanian, M. R. (2020). CO2 geological sequestration in heterogeneous binary media: Effects of geological and operational conditions. Advances in Geo-Energy Research, 4(4), 392–405. https://doi.org/https://doi.org/10.46690/ager.2020.04.05
- Eslamimanesh, A., Gharagheizi, F., Mohammadi, A. H., & Richon, D. (2011). Artificial neural network modeling of solubility of supercritical carbon dioxide in 24 commonly used ionic liquids. Chemical Engineering Science, 66(13), 3039–3044. https://doi.org/https://doi.org/10.1016/j.ces.2011.03.016
- Faizollahzadeh Ardabili, S., Najafi, B., Shamshirband, S., Minaei Bidgoli, B., Deo, R. C., & Chau, K.-W. (2018). Computational intelligence approach for modeling hydrogen production: A review. Engineering Applications of Computational Fluid Mechanics, 12(1), 438–458. https://doi.org/https://doi.org/10.1080/19942060.2018.1452296
- Farlow, S. J. (1984). Self-organizing methods in modeling: GMDH type algorithms (Vol. 54). CRC Press.
- Gaines, B. R. (1976). Foundations of fuzzy reasoning. International Journal of Man-Machine Studies, 8(6), 623–668. https://doi.org/https://doi.org/10.1016/S0020-7373(76)80027-2
- Ghalandari, M., Ziamolki, A., Mosavi, A., Shamshirband, S., Chau, K.-W., & Bornassi, S. (2019). Aeromechanical optimization of first row compressor test stand blades using a hybrid machine learning model of genetic algorithm, artificial neural networks and design of experiments. Engineering Applications of Computational Fluid Mechanics, 13(1), 892–904. https://doi.org/https://doi.org/10.1080/19942060.2019.1649196
- Golzar, K., Modarress, H., & Amjad-Iranagh, S. (2016). Evaluation of density, viscosity, surface tension and CO2 solubility for single, binary and ternary aqueous solutions of MDEA, PZ and 12 common ILs by using artificial neural network (ANN) technique. International Journal of Greenhouse Gas Control, 53, 187–197. https://doi.org/https://doi.org/10.1016/j.ijggc.2016.08.008
- Gutkowski, K., Shariati, A., & Peters, C. (2006). High-pressure phase behavior of the binary ionic liquid system 1-octyl-3-methylimidazolium tetrafluoroborate+ carbon dioxide. The Journal of Supercritical Fluids, 39(2), 187–191. https://doi.org/https://doi.org/10.1016/j.supflu.2006.07.017
- Heidari, E., Sobati, M. A., & Movahedirad, S. (2016). Accurate prediction of nanofluid viscosity using a multilayer perceptron artificial neural network (MLP-ANN). Chemometrics and Intelligent Laboratory Systems, 155, 73–85. https://doi.org/https://doi.org/10.1016/j.chemolab.2016.03.031
- Hemmati-Sarapardeh, A., Amar, M. N., Soltanian, M. R., Dai, Z., & Zhang, X. (2020). Modeling CO2 solubility in water at high pressure and temperature conditions. Energy & Fuels, 34(4), 4761–4776. https://doi.org/https://doi.org/10.1021/acs.energyfuels.0c00114
- Hemmati-Sarapardeh, A., Dabir, B., Ahmadi, M., Mohammadi, A. H., & Husein, M. M. (2019). Modelling asphaltene precipitation titration data: A committee of machines and a group method of data handling. The Canadian Journal of Chemical Engineering, 97(2), 431–441. https://doi.org/https://doi.org/10.1002/cjce.23254
- Hosseinzadeh, M., Hemmati-Sarapardeh, A., Ameli, F., Naderi, F., & Dastgahi, M. (2016). A computational intelligence scheme for estimating electrical conductivity of ternary mixtures containing ionic liquids. Journal of Molecular Liquids, 221, 624–632. https://doi.org/https://doi.org/10.1016/j.molliq.2016.05.059
- Huang, S. H., & Zhang, H.-C. (1994). Artificial neural networks in manufacturing: Concepts, applications, and perspectives. IEEE Transactions on Components, Packaging, and Manufacturing Technology: Part A, 17(2), 212–228. https://doi.org/https://doi.org/10.1109/95.296402
- Ivakhnenko, A., & Krotov, G. (1984). Multiplicative and additive nonlinear GMDH algorithm with factor degree optimization. Avtomatika, 3, 13–18.
- Ivakhnenko, A. G., Krotov, G. I., Visotsky, V. N., & Halfon, E. (1979). Identification of the mathematical model of a complex system by the self-organization method. In Theoretical systems ecology: Advances and case studies (pp. 33–38). Academic Press.
- Jacquemin, J., Husson, P., Majer, V., & Gomes, M. F. C. (2006). Low-pressure solubilities and thermodynamics of solvation of eight gases in 1-butyl-3-methylimidazolium hexafluorophosphate. Fluid Phase Equilibria, 240(1), 87–95. https://doi.org/https://doi.org/10.1016/j.fluid.2005.12.003
- Jang, S., Cho, D.-W., Im, T., & Kim, H. (2010). High-pressure phase behavior of CO2 + 1-butyl-3-methylimidazolium chloride system. Fluid Phase Equilibria, 299(2), 216–221. https://doi.org/https://doi.org/10.1016/j.fluid.2010.09.039
- Jang, J.-S., & Sun, C.-T. (1995). Neuro-fuzzy modeling and control. Proceedings of the IEEE, 83(3), 378–406. https://doi.org/https://doi.org/10.1109/5.364486
- Jou, F. Y., Mather, A. E., & Otto, F. D. (1982). Solubility of hydrogen sulfide and carbon dioxide in aqueous methyldiethanolamine solutions. Industrial & Engineering Chemistry Process Design and Development, 21(4), 539–544. https://doi.org/https://doi.org/10.1021/i200019a001
- Karadas, F., Köz, B., Jacquemin, J., Deniz, E., Rooney, D., Thompson, J., & Atihan, M. (2013). High pressure CO2 absorption studies on imidazolium-based ionic liquids: Experimental and simulation approaches. Fluid Phase Equilibria, 351, 74–86. https://doi.org/https://doi.org/10.1016/j.fluid.2012.10.022
- Kennard, M. L., & Meisen, A. (1984). Solubility of carbon dioxide in aqueous diethanolamine solutions at elevated temperatures and pressures. Journal of Chemical and Engineering Data, 29(3), 309–312. https://doi.org/https://doi.org/10.1021/je00037a025
- Kim, Y., Choi, W., Jang, J., Yoo, K.-P., & Lee, C. (2005). Solubility measurement and prediction of carbon dioxide in ionic liquids. Fluid Phase Equilibria, 228, 439–445. https://doi.org/https://doi.org/10.1016/j.fluid.2004.09.006
- Kim, J. E., Kim, H. J., & Lim, J. S. (2014). Solubility of CO2 in ionic liquids containing cyanide anions: [c2mim][SCN],[c2mim][N (CN) 2],[c2mim][C (CN) 3]. Fluid Phase Equilibria, 367, 151–158. https://doi.org/https://doi.org/10.1016/j.fluid.2014.01.042
- Kim, S. A., Yim, J.-H., & Lim, J. S. (2012). High-pressure phase behavior of binary mixtures containing methylpyrrolidinium derivative ionic liquids and carbon dioxide. Fluid Phase Equilibria, 332, 28–34. https://doi.org/https://doi.org/10.1016/j.fluid.2012.07.006
- Kuenemann, M. A., & Fourches, D. (2017). Cheminformatics modeling of amine solutions for assessing their CO2 absorption properties. Molecular Informatics, 36(7), Article 1600143. https://doi.org/https://doi.org/10.1002/minf.201600143
- Kurnia, K., Harris, F., Wilfred, C., Mutalib, M. A., & Murugesan, T. (2009). Thermodynamic properties of CO2 absorption in hydroxyl ammonium ionic liquids at pressures of (100–1600) kPa. The Journal of Chemical Thermodynamics, 41(10), 1069–1073. https://doi.org/https://doi.org/10.1016/j.jct.2009.04.003
- Lashkarbolooki, M., Shafipour, Z. S., Hezave, A. Z., & Farmani, H. (2013). Use of artificial neural networks for prediction of phase equilibria in the binary system containing carbon dioxide. The Journal of Supercritical Fluids, 75, 144–151. https://doi.org/https://doi.org/10.1016/j.supflu.2012.12.032
- Liu, H., Huang, J., & Pendleton, P. (2012). Tailoring ionic liquids for post-combustion CO2 capture. In M. I. Attalla (Ed.), Recent advances in post-combustion CO2 capture chemistry (pp. 153–175). ACS Publications.
- Madala, H. R. (2019). Inductive learning algorithms for complex systems modeling. CRC press.
- Mangalapally, H. P., Notz, R., Asprion, N., Sieder, G., Garcia, H., & Hasse, H. (2012). Pilot plant study of four new solvents for post combustion carbon dioxide capture by reactive absorption and comparison to MEA. International Journal of Greenhouse Gas Control, 8, 205–216. https://doi.org/https://doi.org/10.1016/j.ijggc.2012.02.014
- Mathieu, P. (2010). Oxyfuel combustion systems and technology for carbon dioxide (CO2) capture in power plants. In M. M. Maroto-Valer (Ed.), Developments and innovation in carbon dioxide (CO2) capture and storage technology (pp. 283–319). Elsevier.
- Mattedi, S., Carvalho, P. J., Coutinho, J. A., Alvarez, V. H., & Iglesias, M. (2011). High pressure CO2 solubility in n-methyl-2-hydroxyethylammonium protic ionic liquids. The Journal of Supercritical Fluids, 56(3), 224–230. https://doi.org/https://doi.org/10.1016/j.supflu.2010.10.043
- Menad, N. A., Hemmati-Sarapardeh, A., Varamesh, A., & Shamshirband, S. (2019). Predicting solubility of CO2 in brine by advanced machine learning systems: Application to carbon capture and sequestration. Journal of CO2 Utilization, 33, 83–95. https://doi.org/https://doi.org/10.1016/j.jcou.2019.05.009
- Mohanraj, M., Jayaraj, S., & Muraleedharan, C. (2015). Applications of artificial neural networks for thermal analysis of heat exchangers – a review. International Journal of Thermal Sciences, 90, 150–172. https://doi.org/https://doi.org/10.1016/j.ijthermalsci.2014.11.030
- Mokarizadeh, H., Atashrouz, S., Mirshekar, H., Hemmati-Sarapardeh, A., & Pour, A. M. (2020). Comparison of LSSVM model results with artificial neural network model for determination of the solubility of SO2 in ionic liquids. Journal of Molecular Liquids, Article 112771. https://doi.org/https://doi.org/10.1016/j.molliq.2020.112771
- Najafi-Marghmaleki, A., Barati-Harooni, A., Tatar, A., Mohebbi, A., & Mohammadi, A. H. (2017). On the prediction of Watson characterization factor of hydrocarbons. Journal of Molecular Liquids, 231, 419–429. https://doi.org/https://doi.org/10.1016/j.molliq.2017.01.098
- Nakhaeizadeh, G. (1992). Application of machine learning to solving industrial problems. In P. Gritzmann, R. Hettich, R. Horst, & E. Sachs (Eds.), Operations research’91 (pp. 560–563). Springer.
- Nash, K. L., & Lumetta, G. J. (2011). Advanced separation techniques for nuclear fuel reprocessing and radioactive waste treatment. Elsevier.
- Nilsson, N., & Machines, L. (1965). Foundations of trainable pattern classifying systems. McGraw-Hill.
- Park, J.-Y., Yoon, S. J., Lee, H., Yoon, J.-H., Shim, J.-G., Lee, J. K., Min, B. Y., & Eum, H.-M. (2002). Density, viscosity, and solubility of CO2 in aqueous solutions of 2-Amino-2-hydroxymethyl-1, 3-propanediol. Journal of Chemical & Engineering Data, 47(4), 970–973. https://doi.org/https://doi.org/10.1021/je0200012
- Qiu-Hao, H., & Yun-Long, C. (2006). Assessment of karst rocky desertification using the radial basis function network model and GIS technique: A case study of Guizhou Province, China. Environmental Geology, 49(8), 1173–1179. https://doi.org/https://doi.org/10.1007/s00254-005-0162-4
- Ramdin, M., Olasagasti, T. Z., Vlugt, T. J., & de Loos, T. W. (2013). High pressure solubility of CO2 in non-fluorinated phosphonium-based ionic liquids. The Journal of Supercritical Fluids, 82, 41–49. https://doi.org/https://doi.org/10.1016/j.supflu.2013.06.004
- Rho, S.-W., Yoo, K.-P., Lee, J. S., Nam, S. C., Son, J. E., & Min, B.-M. (1997). Solubility of CO2 in aqueous methyldiethanolamine solutions. Journal of Chemical & Engineering Data, 42(6), 1161–1164. https://doi.org/https://doi.org/10.1021/je970097d
- Rostami, A., Hemmati-Sarapardeh, A., & Mohammadi, A. H. (2019). Estimating n-tetradecane/bitumen mixture viscosity in solvent-assisted oil recovery process using GEP and GMDH modeling approaches. Petroleum Science and Technology, 37(14), 1640–1647. https://doi.org/https://doi.org/10.1080/10916466.2018.1531885
- Saeidi, S., Amin, N. A. S., & Rahimpour, M. R. (2014). Hydrogenation of CO2 to value-added products – a review and potential future developments. Journal of CO2 Utilization, 5, 66–81. https://doi.org/https://doi.org/10.1016/j.jcou.2013.12.005
- Sahoo, G. B., & Ray, C. (2006). Predicting flux decline in crossflow membranes using artificial neural networks and genetic algorithms. Journal of Membrane Science, 283(1–2), 147–157. https://doi.org/https://doi.org/10.1016/j.memsci.2006.06.019
- Sakhaeinia, H., Taghikhani, V., Jalili, A. H., Mehdizadeh, A., & Safekordi, A. A. (2010). Solubility of H2S in 1-(2-hydroxyethyl)-3-methylimidazolium ionic liquids with different anions. Fluid Phase Equilibria, 298(2), 303–309. https://doi.org/https://doi.org/10.1016/j.fluid.2010.08.027
- Sánchez, L. G., Meindersma, G., & De Haan, A. (2007). Solvent properties of functionalized ionic liquids for CO2 absorption. Chemical Engineering Research and Design, 85(1), 31–39. https://doi.org/https://doi.org/10.1205/cherd06124
- Santos, R., Rupp, M., Bonzi, S., & Fileti, A. (2013). Comparison between multilayer feedforward neural networks and a radial basis function network to detect and locate leaks in pipelines transporting gas. Chemical Engineering Transactions, 32, 1375–1380. https://doi.org/https://doi.org/10.3303/CET1332230
- Sawaragi, Y., Soeda, T., Tamura, H., Yoshimura, T., Ohe, S., Chujo, Y., & Ishihara, H. (1979). Statistical prediction of air pollution levels using non-physical models. Automatica, 15(4), 441–451. https://doi.org/https://doi.org/10.1016/0005-1098(79)90018-9
- Seddon, K. (1995). Room-temperature ionic liquids: Neoteric solvents for clean catalysis. Kinetics and Catalysis, 37(5), 693–697.
- Shafiei, A., Ahmadi, M. A., Zaheri, S. H., Baghban, A., Amirfakhrian, A., & Soleimani, R. (2014). Estimating hydrogen sulfide solubility in ionic liquids using a machine learning approach. The Journal of Supercritical Fluids, 95, 525–534. https://doi.org/https://doi.org/10.1016/j.supflu.2014.08.011
- Shariati, A., & Peters, C. (2004). High-pressure phase behavior of systems with ionic liquids: II. The binary system carbon dioxide+ 1-ethyl-3-methylimidazolium hexafluorophosphate. The Journal of Supercritical Fluids, 29(1–2), 43–48. https://doi.org/https://doi.org/10.1016/S0896-8446(03)00032-9
- Shariati, A., & Peters, C. J. (2004). High-pressure phase behavior of systems with ionic liquids: Part III. The binary system carbon dioxide+ 1-hexyl-3-methylimidazolium hexafluorophosphate. The Journal of Supercritical Fluids, 30(2), 139–144. https://doi.org/https://doi.org/10.1016/j.supflu.2003.09.001
- Shiflett, M. B., Kasprzak, D. J., Junk, C. P., & Yokozeki, A. (2008). Phase behavior of carbon dioxide + [bmim][Ac] mixtures. The Journal of Chemical Thermodynamics, 40(1), 25–31. https://doi.org/https://doi.org/10.1016/j.jct.2007.06.003
- Shiflett, M. B., & Yokozeki, A. (2006). Solubility and diffusivity of hydrofluorocarbons in room-temperature ionic liquids. AIChE Journal, 52(3), 1205–1219. https://doi.org/https://doi.org/10.1002/aic.10685
- Shin, E.-K., & Lee, B.-C. (2008). High-pressure phase behavior of carbon dioxide with ionic liquids: 1-alkyl-3-methylimidazolium trifluoromethanesulfonate. Journal of Chemical & Engineering Data, 53(12), 2728–2734. https://doi.org/https://doi.org/10.1021/je8000443
- Shokouhi, M., Adibi, M., Jalili, A. H., Hosseini-Jenab, M., & Mehdizadeh, A. (2010). Solubility and diffusion of H2S and CO2 in the ionic liquid 1-(2-hydroxyethyl)-3-methylimidazolium tetrafluoroborate. Journal of Chemical & Engineering Data, 55(4), 1663–1668. https://doi.org/https://doi.org/10.1021/je900716q
- Singh, P. (2011). Amine based solvent for CO2 absorption. From molecular structure to process.
- Soltanian, M. R., Hajirezaie, S., Hosseini, S. A., Dashtian, H., Amooie, M. A., Meyal, A., … & Zhang, X. (2019). Multicomponent reactive transport of carbon dioxide in fluvial heterogeneous aquifers. Journal of Natural Gas Science and Engineering, 65, 212–223. https://doi.org/https://doi.org/10.1016/j.jngse.2019.03.011
- Song, H. N., Lee, B.-C., & Lim, J. S. (2010). Measurement of CO2 solubility in ionic liquids:[BMP][TfO] and [P14, 6, 6, 6][Tf2N] by measuring bubble-point pressure. Journal of Chemical & Engineering Data, 55(2), 891–896. https://doi.org/https://doi.org/10.1021/je9005085
- Speyer, D., Ermatchkov, V., & Maurer, G. (2010). Solubility of carbon dioxide in aqueous solutions of N-methyldiethanolamine and piperazine in the low gas loading region. Journal of Chemical & Engineering Data, 55(1), 283–290. https://doi.org/https://doi.org/10.1021/je9003383
- Tagiuri, A., Sumon, K. Z., & Henni, A. (2014). Solubility of carbon dioxide in three [Tf2N] ionic liquids. Fluid Phase Equilibria, 380, 39–47. https://doi.org/https://doi.org/10.1016/j.fluid.2014.07.015
- Tatar, A., Barati, A., Yarahmadi, A., Najafi, A., Lee, M., & Bahadori, A. (2016). Prediction of carbon dioxide solubility in aqueous mixture of methyldiethanolamine and N-methylpyrrolidone using intelligent models. International Journal of Greenhouse Gas Control, 47, 122–136. https://doi.org/https://doi.org/10.1016/j.ijggc.2016.01.048
- Tuckett, R. P. (2016). The role of atmospheric gases. In T. M. Letcher (Ed.), Climate change (pp. 375–397). Elsevier.
- Vapnik, V., & Vapnik, V. (1998). Statistical learning theory Wiley. New York, 1, 624.
- Varamesh, A., Hemmati-Sarapardeh, A., Dabir, B., & Mohammadi, A. H. (2017). Development of robust generalized models for estimating the normal boiling points of pure chemical compounds. Journal of Molecular Liquids, 242, 59–69. https://doi.org/https://doi.org/10.1016/j.molliq.2017.06.039
- Varamesh, A., Hemmati-Sarapardeh, A., Moraveji, M. K., & Mohammadi, A. H. (2017). Generalized models for predicting the critical properties of pure chemical compounds. Journal of Molecular Liquids, 240, 777–793. https://doi.org/https://doi.org/10.1016/j.molliq.2017.05.023
- Yim, J.-H., & Lim, J. S. (2013). CO2 solubility measurement in 1-hexyl-3-methylimidazolium ([HMIM]) cation based ionic liquids. Fluid Phase Equilibria, 352, 67–74. https://doi.org/https://doi.org/10.1016/j.fluid.2013.05.005
- Yim, J.-H., Song, H. N., Lee, B.-C., & Lim, J. S. (2011). High-pressure phase behavior of binary mixtures containing ionic liquid [HMP][Tf2N],[OMP][Tf2N] and carbon dioxide. Fluid Phase Equilibria, 308(1–2), 147–152. https://doi.org/https://doi.org/10.1016/j.fluid.2011.06.023
- Yokozeki, A., Shiflett, M. B., Junk, C. P., Grieco, L. M., & Foo, T. (2008). Physical and chemical absorptions of carbon dioxide in room-temperature ionic liquids. The Journal of Physical Chemistry B, 112(51), 16654–16663. https://doi.org/https://doi.org/10.1021/jp805784u
- Yuan, X., Zhang, S., Liu, J., & Lu, X. (2007). Solubilities of CO2 in hydroxyl ammonium ionic liquids at elevated pressures. Fluid Phase Equilibria, 257(2), 195–200. https://doi.org/https://doi.org/10.1016/j.fluid.2007.01.031
- Zadeh, L. A. (1965). Fuzzy sets. Information and Control, 8(3), 338–353. https://doi.org/https://doi.org/10.1016/S0019-9958(65)90241-X
- Zendehboudi, S., Ahmadi, M. A., James, L., & Chatzis, I. (2012). Prediction of condensate-to-gas ratio for retrograde gas condensate reservoirs using artificial neural network with particle swarm optimization. Energy & Fuels, 26(6), 3432–3447. https://doi.org/https://doi.org/10.1021/ef300443j
- Zendehboudi, S., Ahmadi, M. A., Mohammadzadeh, O., Bahadori, A., & Chatzis, I. (2013). Thermodynamic investigation of asphaltene precipitation during primary oil production: Laboratory and smart technique. Industrial & Engineering Chemistry Research, 52(17), 6009–6031. https://doi.org/https://doi.org/10.1021/ie301949c
- Zhang, J., Feng, Q., Wang, S., Zhang, X., & Wang, S. (2016). Estimation of CO2–brine interfacial tension using an artificial neural network. The Journal of Supercritical Fluids, 107, 31–37. https://doi.org/https://doi.org/10.1016/j.supflu.2015.08.010
- Zhang, S., Yuan, X., Chen, Y., & Zhang, X. (2005). Solubilities of CO2 in 1-butyl-3-methylimidazolium hexafluorophosphate and 1, 1, 3, 3-tetramethylguanidium lactate at elevated pressures. Journal of Chemical & Engineering Data, 50(5), 1582–1585. https://doi.org/https://doi.org/10.1021/je050046d
- Zhao, H., Xia, S., & Ma, P. (2005). Use of ionic liquids as ‘green’ solvents for extractions. Journal of Chemical Technology & Biotechnology: International Research in Process, Environmental & Clean Technology, 80(10), 1089–1096.