
 ?Mathematical formulae have been encoded as MathML and are displayed in this HTML version using MathJax in order to improve their display. Uncheck the box to turn MathJax off. This feature requires Javascript. Click on a formula to zoom.
Abstract
The propeller wake can cause vibrations on the rudder surface, which worsen the noise and reliability. The vibration monitoring of the rudder operating in the propeller wake with fluid-structure interaction (FSI) method is still challenging. In the present study, the structural response during propeller-rudder interaction is investigated using detached eddy simulation. Three-dimensional distributions of loads, stresses, and deformations are discussed. The leading and trailing edges exhibit the strongest deformations in opposite directions, which are S-shaped. The strongest lateral deformation occurs between the tip vortex and hub vortex regions. In the tip vortex region, the dominant lateral vibrations fluctuate at the blade passing frequency (BPF) and shaft frequency (SF). However, the 75 Hz-fluctuation becomes significant at the trailing edge of the rudder. In the hub vortex region, the lateral deformation fluctuates mainly at 75 Hz except the area near the leading edge. There are weak vibrations occurring at the natural frequencies of the rudder when the natural frequencies of the rudder are much higher than the SF and BPF. However, the plate in the propeller suffers intense vibrations at the frequencies near the natural frequencies, where the natural frequencies of the plate are close to SF and BPF.
Subject classification codes:
1. Introduction
The vibrations on the rudder operating in the propeller wake play an important role in the reliability and noise of the vessel. The wake of propellers represents a non-uniform flow field structure with intense periodic characteristics (Mascio et al., Citation2014; Wang et al., Citation2017). When the propeller wake vortex collides with a body or rudder, its fluid load fluctuations are transmitted via vortex-body interactions. This results in complex structural responses that directly relate to vibrations and noises. Accordingly, the fluid-structure interaction (FSI) cannot be overlooked during in-depth studies related to this phenomenon.
As the propeller has a finite number of blades, the flow field in its wake is generally non-uniform. This has been confirmed using the laser Doppler velocimetry method and numerical studies (Felli et al., Citation2008; Gong et al., Citation2018; Stella et al., Citation2000; Zhang & Jaiman, Citation2019). The properties of complex propeller wake fields are generally dependent on the number of blades or blade passing frequency (BPF). Felli et al. (Citation2011) observed the double-helix breakdown of propeller vortices in the far field of a propeller wake field. Mascio et al. (Citation2014) studied propeller wake vortexes. They demonstrated that the flows in the wake of a propeller exhibit intense, turbulent fluctuations, which were strongly correlated with the BPF of the propeller. Kumar and Mahesh (Citation2017) analysed the axial evolution of the propeller wake and found that the coherent tip vortex breaks up immediately when the propeller wake begins to destabilize. However, the hub vortex remains coherent even in the far wake.
It has been long known that the propeller vortex developing aft of a propeller interacts with the rudder. Generally, the propeller wake can induce changes in hydrodynamic properties such as the lift and thrust. Abramowski et al. (Citation2010) discovered that the thrust efficiency of a propeller can be improved by installing a streamline rudder in its wake. He and Kinnas (Citation2017) found that the propeller vortex induces a loss of lift in the rudder. Sun et al. (Citation2018) observed that rudders in the propeller wake experience a fluctuating force that oscillates at the BPF. Paik et al. (Citation2012) showed that the wake flow field of a propeller affects the rudder cavitation. Using inviscid numerical simulations, Li (Citation1996) found that the rudder splits the propeller wake vortex into two parts. Furthermore, the wake flow field was found to be misaligned on both sides of the rudder along its span. Felli et al. (Citation2009) and Felli and Falchi (Citation2011) used experimental methods to analyze such misalignments, which were found to be caused by the spanwise gradient of the circulation and asymmetric perturbations induced by the flow roll-up at the blade tip. Sun et al. (Citation2018) demonstrated that the propeller wake does not exhibit any spanwise misalignments until it reaches the leading edge of the rudder.
Vortexes are important structures in propeller wake as their interactions with bodies can induced loads that cause structural vibrations (Rockwell, Citation1998). Such vortex-body interactions have been observed in a variety of settings including aerospace, water pumps, ships, and marine engineering applications. This issue dates back to the 1980s, when studies were focused on the noise produced by these interactions (Howe, Citation1988, Citation1989). Marshall (Citation1994) and Marshall and Yalamanchili (Citation1994) studied changes in the bending and cross-sectional plane of line vortexes when cut by a blade. They found that the bending of the line vortex is directly related to the ratio of the blade thickness to the ambient vortex core radius. In particular, the line vortex bends only slightly at small ratios. When a line vortex is cut by a blade, the vortex core radii changes. As a result, the vortex force on the blade depends on the radius of the vortex core in the interaction region. Marshall and Grant (Citation1996) found that the vorticity field agglomerates into a thin vortex ribbon near the blade leading edge. They also found that the vortex-induced suction force acting on the blade is directly proportional to the square of the vortex circulation. The movements of the vortex also affect the boundary layer of solid structures. Studies have demonstrated that intense changes occur in the boundary layer during vortex-solid wall interactions (Hirsa et al., Citation2000; Shi et al., Citation1991; Wu et al., Citation2006). Affes and Conlisk (Citation1993) studied the unsteady boundary layer during the collision between a vortex filament and circular cylinder. They found that the vortex motion leads to boundary layer separation. Furthermore, they observed that the secondary flow patterns of the boundary layer resemble a horseshoe vortex. Jiang et al. (Citation2015) conducted viscous numerical simulations of the flow over a rod-foil configuration. They found that the collision between the upstream and downstream vortices is one of the main causes of turbulent fluctuations.
Analyses of the structural deformations and vibrations are highly relevant for hydrodynamic and structural design and several FSI models have been raised (Jiang et al., Citation2019; Salih et al., Citation2019). Ghalandari et al. (Citation2019) investigated the flutter speed of a wing with presented differential quadrature method. The research was performed under subsonic regime which modeled by Wagner function. Many studies had proved that there are pressure fluctuations on the rudder surface induced by propeller wake. Muscari et al. (Citation2017) employed detached eddy simulations (DES) to analyze the coupling between the rudder and wake of a simplified single-blade rotor. They installed probes on the rudder surfaces to monitor the pressure acting upon them. They found that pressure fluctuations on the rudder are predominantly determined by the BPF. A study by Yilmaz et al. (Citation2019a) confirmed that intense pressure fluctuations occur on the rudder surfaces. Hu et al. (Citation2019a) used large eddy simulations (LES) to study the wake of a contra-rotating propeller. They found that the cutting of the forward propeller tip vortex by the aft propeller reduces its axial vorticity. Wang et al. (Citation2019) noted that fluctuations of turbulent kinetic energy are highly significant near the rudder surfaces and strongly correlate with the propeller BPF. Based on LES, Hu et al. (Citation2019b) similarly found that pressure fluctuations over the rudder surface are strongly correlated with the BPF. They also found that the pressure fluctuations caused by the tip vortex of single-bladed rotors are more intense than those caused by four-bladed rotors. Propeller vortex-rudder collisions also involves intense fluid-structure interaction processes. For example, Turnock and Wright (Citation2000) compared the results of coupled and uncoupled numerical simulations of such interactions. They found that a coupled numerical simulation is much more accurate in simulating the pressure distribution on the rudder. However, this research focused on the steady-state variations in the rudder’s stress and strain, rather than the structural vibration.
Despite these early observations (Marshall, Citation1994; Marshall & Grant, Citation1996; Marshall & Yalamanchili, Citation1994; Muscari et al., Citation2017; Turnock & Wright, Citation2000), the mechanism of the rudder vibrations induced by propeller wake has remained unclear. In the present study, a fluid-structure interaction model is employed to investigate the vibrations in the propeller-rudder interactions. Simulations are carried out using STAR-CCM+, which allows direct simulation of the FSI. The fluids are simulated using DES, and the structural deformations and vibrations of a both ends fixed-rudder are simulated using the finite volume solid stress method. The dominant frequencies of the vibrations are obtained with fast Fourier transform (FFT). The distributions of deformations and vibrations are analysed and compared, which will enhance the design of the propeller-rudder system.
2. Mathematical models
2.1. Fluid model
The k–ω SST DES model is employed to simulate the turbulence in the flow filed. The transport equations of the turbulent kinetic energy (k) and turbulence dissipation rate (ω) of the k–ω SST model are respectively expressed as (Shur et al. Citation2008)
(1)
(1)
(2)
(2) where
is the mean velocity, k is turbulent kinetic energy, μ is the dynamic viscosity, ρ is the density, fβ* is the free-shear modification factor, fβ is the vortex-stretching modification factor, ω0 and k0 are the ambient turbulence values for counteracting turbulence decay, Pk and Pω are production terms, Sk and Sω are source terms, and σk, σω, α*, β*, φ1, and φ2 are model coefficients. The calculation of these model coefficients can be found in the user guide of STAR-CCM+ (SIEMENS, Citation2019).
2.2. Fluid-structure interactions
To calculate the structural stresses, the finite volume solid stress model is used whose governing equations are expressed as
(3)
(3)
(4)
(4) where M, ρs, and Vs are the mass, density, and volume of the solid structure, respectively, us is the solid displacement, bs is the total volume force per unit volume, and σ is the Cauchy stress tensor.
3. Numerical setup and uncertainty analysis
3.1. Numerical setup
An E779A propeller and a rudder having the NACA0020 profile, whose geometric characteristics are listed in Table , are selected for this study. The configurations are the same as that used by Hu et al. (Citation2019b, Citation2020). The simulations are performed within a cubic computational domain of dimensions (l × w × h) 12.5D × 5.0D × 5.0D, where D is the diameter of the propeller. To simulate the rotations of the propeller and deformations of the rudder, the computational domain is divided into fluid domain, rotation domain, deformation buffer, and rudder domain (Figure ). The distance between the propeller and rudder is set at 0.5D. The most intense interactions between the rudder and propeller vortex only occur in a small section of the rudder surface within the wake flow field. Therefore, the rudder domain is only applied over a 600 mm span of the rudder. The upper and lower end plates of the rudder are fixed. The rudder material is Al, whose density, Young’s modulus, and Poisson’s ratio are 2.702 × 10³ kg/m3, 6.8 × 10⁴ MPa, and 0.33, respectively. To buffer the rudder deformations, a deformation buffer is applied around the rudder domain. The reference frame is constructed on the propeller, and the X-axis is aligned with the axis of the propeller.
Figure 1. Configuration of the propeller and rudder. (a) General view; (b) Top view.
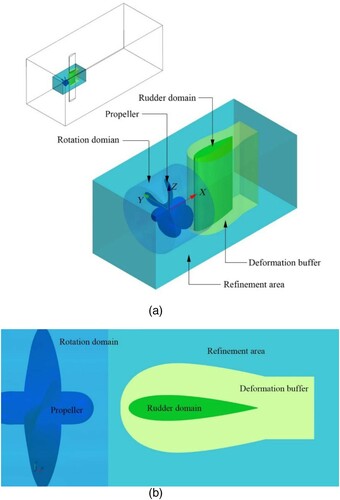
Table 1. Geometric characteristics.
According to Mascio et al. (Citation2014) and Muscari et al. (Citation2017), a time step corresponding to 1° of propeller rotation is sufficient to accurately resolve the vortex of an E779A propeller. Moreover, Yilmaz et al. (Citation2019b) reduced the time step to 0.81° of propeller rotation. Based on these results, the time step is set to Δt = 5.00 × 10⁻⁵ in this study, which corresponds to 0.45° of propeller rotation.
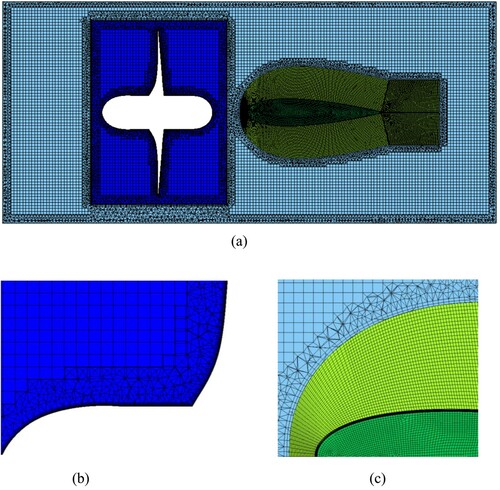
We have deliberately chosen to overlook the deformations of the propeller as it is assumed to be a fully rigid, non-deforming structure. A solid mesh is therefore not constructed for its internal regions. The fluid and rotation domains are meshed using hexahedral cells. Prism layers are constructed on the interfaces among the fluid domain, rotation domain, and deformation buffer. A transitional layer is formed by inserting pyramid cells and tetrahedral cells between these prism layers and the hexahedral cells. For an accurate calculation of boundary layer, the cells in the boundary layer need special treatment. The prism layer mesher is employed, and 10 prism layers are created for the boundary mesh. The first boundary layers near the propeller and rudder are obtained using y+ = 10 with a growth rate of 1.2. The mesh of the refined region is shown in Figure .
Figure 2. Meshing details of the refined domains, propeller, and near-rudder region. (a) Distribution of meshes in the refined domains, (b) Boundary layer mesh near the propeller, (c) Meshes of the rudder and transitional region.
3.2. Uncertainty analysis
The standard uncertainty analysis proposed by Roache (Citation1997) and ITTC (Citation2002) is employed to verify the reliability of present meshing strategy. Thus, results of fine, medium, and coarse meshes are evaluated with a grid refinement ratio of . All three meshes are constructed with the same boundary layer meshing and time step. Owing to a lack of experimental data, the comparison shown in Table is conducted using data reported by Hu et al. (Citation2020). This table provides the discrepancy (ϵ21 and ϵ32), convergence ratio (RG), order of accuracy (PG), error estimation (δ), correction factor (CG), and uncertainty (UG) among the results of adjacent meshes. In the present work, the theoretical order of accuracy PGest is 2. These variables can be calculated using Equations (5–11):
(5)
(5)
(6)
(6)
(7)
(7)
(8)
(8)
(9)
(9)
(10)
(10)
(11)
(11) where Si represents KT, 10KQ and CF, ϵ21 represents the discrepancy between the results of fine grid and medium grid, and ϵ32 represents that between the results of medium grid and coarse grid. As RG < 1, the discrepancies decrease with cell size.
Table 2. Grid resolution uncertainty analysis.
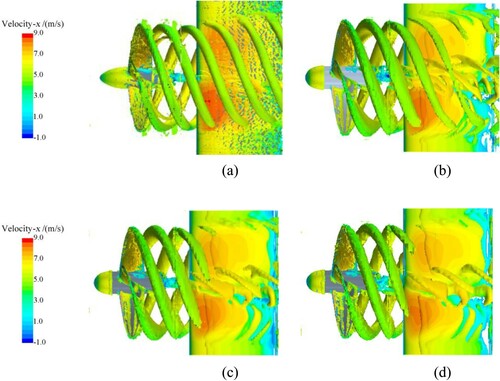
As the structural deformations and structural vibrations occurring in the rudder due to the propeller vortex are the focus of this study, comparing only the hydrodynamic coefficients is insufficient. Therefore, we extend the grid convergence analysis to the wake of the propeller. Figure illustrates the distribution of the vertical vorticity of the rudder in each grid, and Figure shows the vortex structures of the propeller, obtained using a Q-criterion of 1000/S2. The comparison is carried out between the results of present simulation and those by Hu et al. (Citation2020), in which the Q-criterion used is 1000/S2. The same value of Q-criterion is employed in present simulation. Vertical vorticity ‘Vorticity-z’ and Q-criterion can be obtained using Equations (12–13). In these figures, the vortex core and vortex tube are better defined with an increasingly refined grid. The relationship between the misalignment of the propeller tip vortex and the direction of the propeller’s rotation is consistent with that observed by Li (Citation1996).
(12)
(12)
(13)
(13)
Figure 3. Distribution of vertical vorticity near the rudder. (a) Hu et al. (Citation2020), (b) Fine, (c) Medium, (d) Coarse.
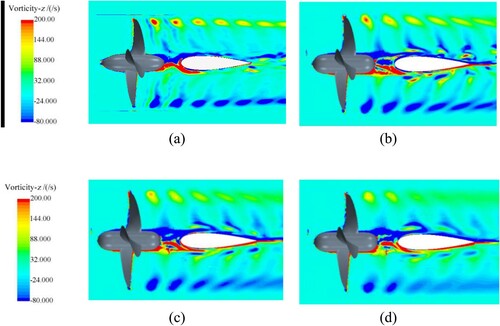
Figure 4. Vortex structures of the propeller in grids with varying levels of refinement. (a) Hu et al. (Citation2020), (b) Fine, (c) Medium, (d) Coarse.
From Table and Figures and , the results using the fine grid are similar to those of Hu et al. (Citation2020) in terms of hydrodynamic properties and the near-rudder flow field. Hence, the fine mesh is reliable for this study. This flow domain configuration and fine cell size are used in following sections.
4. Analysis of flow field
The wake of a propeller is composed of spatial non-uniform flows causing non-uniform stresses and deformations on the rudder. Therefore, the research focus on the flow field near the rudder should be applied at first. It is necessary to study the temporal and frequency characteristics of the pressure fluctuations generated by the propeller wake.
4.1. Distribution of pressure and velocity
Figure shows the distributions of pressure and velocity near the rudder at the instant of 6 T (where T is the period of one propeller rotation). The flow-field cross sections correspond to Z = 0.50D, 0.25D, 0, −0.25D, and −0.50D. A reference pressure of 101 325 Pa is used. The difference in pressures between the two sides of the rudder reaches its maximum at Z = ±0.25D. The pressure of the flow field is significantly lowered on both sides of the rudder at Z = 0. The velocity in the X direction (Vx) reaches its maximum at Z = ±0.25D. The axial velocities Vx in the flow field are symmetric about the X-Z plane at Z = 0, while the distributions of Vx are not completely symmetrical at Z = ±0.5D and Z = ±0.25D. At Z = 0.25D, Vx is larger on the Y < 0 side than on the Y > 0 side, and vice versa occurs at Z = −0.25D. A similar asymmetric distribution of Vx is also observed at Z = ±0.50D. A high-Vx wake flow only appears on one side of the rudder at these positions.
Figure 5. Pressure and velocity distributions. (a) Pressure, (b) Vx, (c) Vy, (d) Vz.
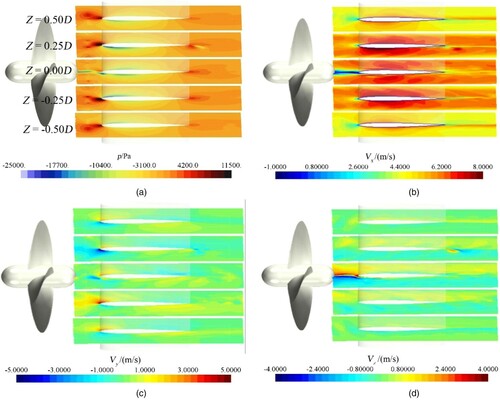
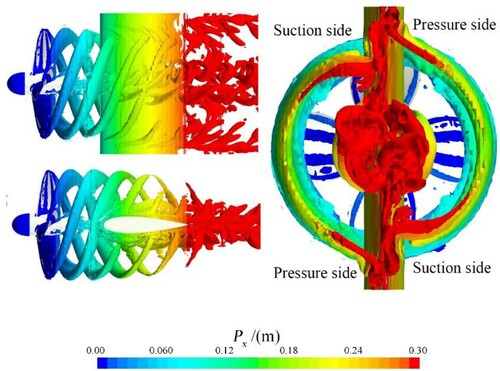
The difference of Vx between the two sides of the rudder is caused by the misalignment of the propeller tip vortex with the rudder, as shown in Figure . The propeller tip vortex undergoes spanwise and chordwise displacements as it collides with the rudder. This is consistent with the findings reported by Johnston and Sullivan (Citation1992). The X-position function Px in Figure is colored for easily determining the direction of the tip vortex misalignment, which is towards the -Z and + Z directions on the Y < 0 and Y > 0 sides, respectively. The rudder surfaces can be divided into pressure and suction sides based on the direction of the propeller tip vortex and the pressure distribution shown in Figure (a). In particular, on the suction sides, the tip vortex tube bends towards the smaller circle. On the pressure sides, the tip vortex tube develops along the outer circle. Comparing Figures 5(c) and 6, the lateral velocity, Vy, is higher around the leading edge of the rudder. At the same spanwise position, the suction and pressure sides exhibit Vy in the opposite direction. At the same chordwise position, the Vy on the same side of the rudder always point in the same direction. As shown in Figure (d), the direction of Vz corresponds to the misalignment of the propeller tip vortex shown in Figure , where the maximum Vz occurs in the hub vortex flow.
Figure 6. Displacement of the propeller vortex.
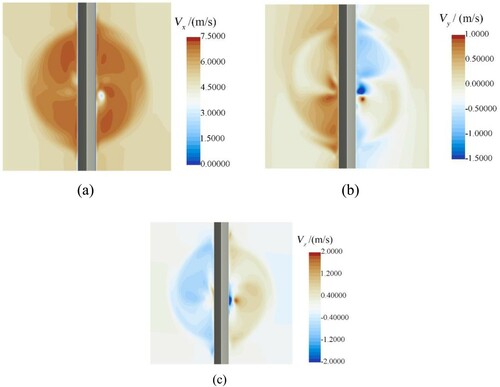
The distributions of Vx, Vy, and Vz at X = 0.6D and X = 0.9D are shown in Figures and . At X = 0.6D, Vx shows a spanwise misalignment (in the Z direction) along the rudder, and the maximum Vx occurs between the tip vortex and hub vortex. Moreover, the axial velocities (Vx) on the suction sides are greater than those on the pressure sides. At these sections, Vy and Vz on different sides of the rudder spread in opposite directions. At X = 0.6D, the lateral velocities (Vy) are higher on the suction side, whereas they are higher on the pressure side at X = 0.9D. In the near-rudder flow field, Vx is observed to be the dominant component of the wake flow. The maximum Vx occurs between the tip and hub vortices. Although the Vz values at X = 0.6D and X = 0.9D are similar, Vx and Vy both decrease along the X axis.
Figure 7. Distribution of velocities near the rudder (X = 0.6D). (a) Vx, (b) Vy, (c) Vz.
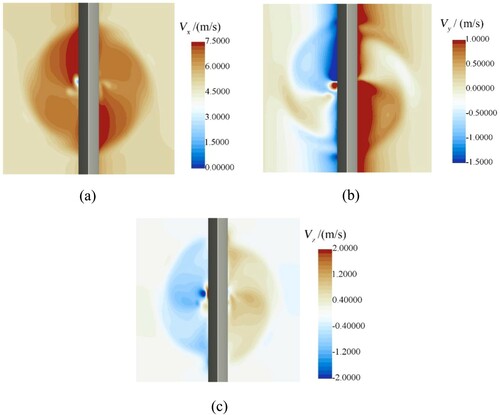
Figure 8. Distribution of velocities near the rudder (X = 0.9D). (a) Vx, (b) Vy, (c) Vz.
4.2. Pressure fluctuations on the rudder
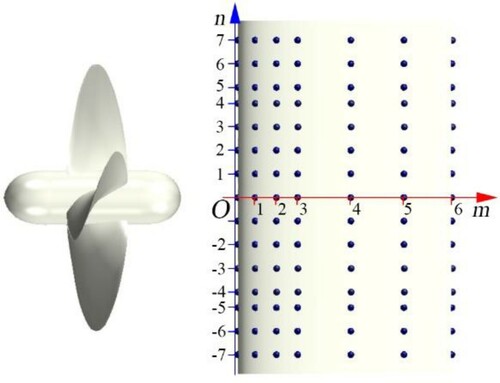
Mascio et al. (Citation2014) and Wang et al. (Citation2017) both noted that the propeller wake vortex is temporally non-uniform. To study the periodicity of the pressure fluctuations and structural vibrations, virtual probes are placed on the rudder. These virtual probes will not impact the flow filed and the structural characteristics of the rudder. A two-dimensional m-n coordinate system is constructed so that the position of each probe can be distinguished using its (m, n) coordinates (Figure ). In this coordinate system, m (m = 0–6) and n (n = −7–7) indicate the chordwise and spanwise positions along the rudder, respectively. Values for n = ±6, ±5, ±4, ±2, and ±1 correspond to ±0.50D, ±0.41D, ±0.35D, ±0.26D, and ±0.09D spanwise locations (where D is the diameter of the propeller). The probes at n = ±6 are located directly behind the blade tip of propeller (Z = ±0.5D). The probes at n = 0 are placed directly behind the propeller hub. The probes at m = 0 and m = 6 are located at the leading and trailing edges of the rudder, respectively. A value of m = 1 represents the 0.08C chordwise position, and m = 2, 3, 4, and 5 correspond to the 0.18C, 0.28C, 0.53C, and 0.78C chordwise positions (where C is the chord length of the rudder). To facilitate subsequent comparisons and analysis, we define the n = 0 and n = ±6 positions as the hub vortex and tip vortex regions, respectively.
Figure 9. Layout of the probes.
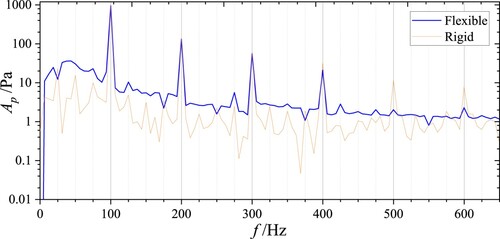
The pressure fluctuations shown in Figure are monitored by probes (0–6, 6) located in the tip vortex region. The results obtained by modeling the rudder as a flexible and as a fully rigid structure are compared. The pressure fluctuates in an intense, periodic manner with different amplitudes. The pressure fluctuations of adjacent probes at coordinates (1, 6) and (2, 6) are observed to exhibit a phase difference. This will exacerbate the deformation of the rudder. Comparing the coupled and uncoupled results, the pressure fluctuations on the rudder surface are clearly smoother when the rudder is assumed to be a fully rigid. Figure illustrates the FFT results on the pressure fluctuations recorded by probe (0, 6). Both FFT results are dominated by pressure fluctuations whose frequencies correspond to the BPF of the propeller (100 Hz) and its harmonics. However, the flexible rudder also exhibits intense pressure fluctuations at non-integer multiples of the BPF. Additionally, the pressure fluctuations corresponding to the 5th and 6th order harmonics of the BPF (500 and 600 Hz, respectively) are significantly weaker in the flexible case than that in the rigid case. Peaks and valleys are prominent in the FFT results for the rigid rudder, whereas the results are generally smoother for the flexible rudder.
Figure 10. Pressure fluctuations monitored by probes (0–6, 6). (a) Flexible rudder, (b) Rigid rudder.
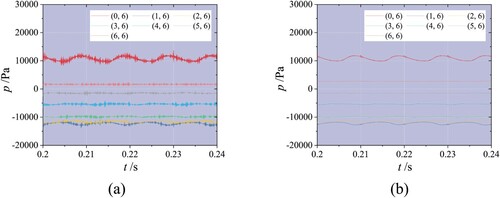
Figure 11. Comparison between the frequency domain features of pressure fluctuations for a rigid and a flexible rudder.
The FFT is used to extract the power spectral density (PSD) of the pressure fluctuations given in Figure (a), as shown in Figure . The maximum amplitude of fluctuation always occurs at a BPF (100 Hz) for all of the probes. The amplitude at this frequency decreases along the chord of the rudder. Although large amplitudes of fluctuation also occur at the harmonics of the BPF, they decrease rapidly with increasing frequencies.
Figure 12. PSD of the pressure fluctuations at probes (0–6, 6).
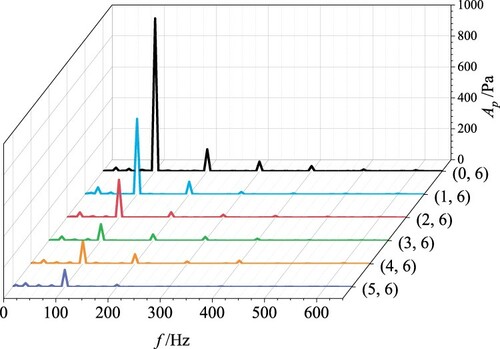
Figure shows the PSD of the pressure fluctuations at n = 0 and n = −6. Comparing Figure (a,b), and 12, most of the pressure fluctuations caused by the tip vortex aggregate around the BPF and its harmonics. Although pressure fluctuations also occur at the shaft frequency (SF, 25 Hz), their amplitudes are much smaller than those at the BPF. The pressure fluctuations caused by the hub vortex are much more complex. Figure (a) shows that the pressure fluctuations at the SF are much more intense than those occurring at the BPF. Furthermore, intense hub vortex-induced pressure fluctuations occur at the harmonics of the SF (50, 75, and 125 Hz). Although the hub and tip vortices generate pressure fluctuations at different frequencies, these fluctuations generally weaken along the chord of the rudder.
Figure 13. PSD of the pressure on the rudder surface. (a) hub vortex region, (b) tip vortex region.
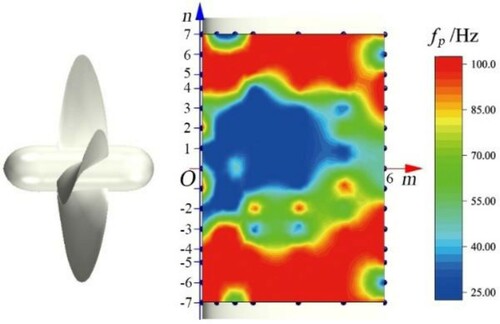
Hu et al. (Citation2019b) noted that the pressure fluctuations are relatively weak in the area between the hub and tip vortex regions. However, they still can affect the structural deformations of the rudder. Therefore, the pressure fluctuations in the area between the hub and tip vortex regions are investigated. The amplitudes of the pressure fluctuations, Ap, on the rudder surface are shown in Figure . Pressure fluctuations are intense at the leading edge. The most intense pressure fluctuations occur at probe (1, 0), which is directly behind the propeller hub. Relatively intense pressure fluctuations are also detected by the probes at (0, 5–6) and (0, −5 to −6), which are behind the propeller tip vortex. Significant pressure fluctuations are also detected by probes (6, 2–3) and (−6, 2–3) on the trailing edge of the rudder. The frequencies corresponding to the Ap in Figure are shown in Figure . The results show that the pressure fluctuations mainly occur at 100 Hz in the tip vortex region and at 25 Hz in the hub vortex region. The region with intense pressure fluctuations close to probe (1, 0) extends upwards and rearwards. The region dominated by 25 Hz fluctuations also extends in the upwards–rearwards direction.
Figure 14. Distributions of pressure fluctuations.
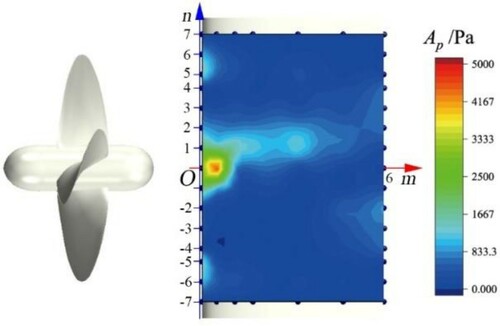
Figure 15. Dominant frequencies of pressure fluctuations.
4.3. Summary
The propeller vortex induces intense spatiotemporal inhomogeneity in the flow field near the rudder. High pressures can be observed between the tip vortex and hub vortex. The Vz on opposite sides of a rudder act in opposite directions. Vy is higher on the suction side of the leading edge, whereas it is higher on the pressure side of the trailing edge. The pressures on the sides of the rudder fluctuate significantly, especially in the hub and tip vortex regions. The most intense pressure fluctuations occur in the hub vortex region. The dominant pressure fluctuations in the hub and tip vortex regions fluctuate at 25 and 100 Hz.
5. Analysis of structural response
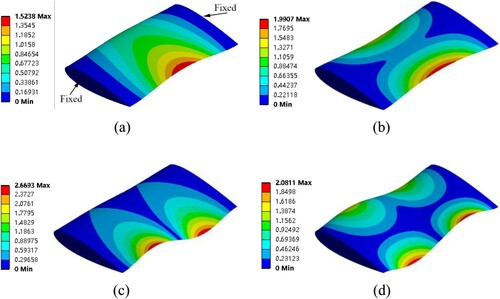
Section 4 analyses the non-uniform pressure distributions on the rudder surface as well as the flow fields near the rudder. These non-uniformities induce deformations and vibrations on the rudder. In this section, the stress and deformation of the rudder are studied. As a basement, the modal analysis is carried out in Figure . In the modal analysis, the rudder is fixed at its two ends. The constraint conditions are shown in Figure (a). The first mode is primarily bending, while the second mode contains twisting. The vibrations on the trailing edge are more severe. The natural frequencies of these two fixed ends of rudder is much larger than the BPF of the propeller.
Figure 16. Natural frequencies of the rudder. (a) Mode 1 (1596.3 Hz), (b) Mode 2 (2391.6 Hz), (c) Mode 3 (3756.2 Hz), (d) Mode 4 (5055.4 Hz).
5.1. Evolution of the propeller vortex
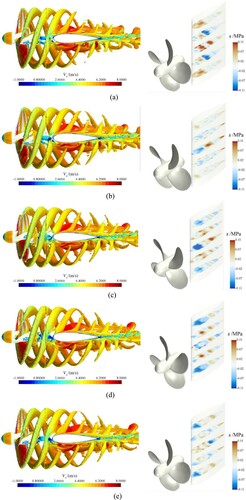
The propeller tip vortex passes the leading edge of the rudder with a period of 0.25T. We therefore analyze the propeller tip vortex and stresses of the rudder at various instances within a 0.25T period, as shown in Figure . As the propeller tip vortex approaches the leading edge of the rudder, the vortex tube begins to bend and deform. These observations are consistent with the findings of Marshall (Citation1994). When the propeller tip vortex flows past the leading edge of the rudder, the tip vortex branch in suction side separates from the rudder surface. In contrast, the tip vortex branch in the pressure side remains in contact with the rudder surface and joins the boundary layer to form a ‘continuously adhering’ structure. The stresses of the rudder thus undergo a set of changes that are temporally related to the evolution of the tip vortex. However, the largest stresses in the rudder always occur at the sections Z = ±0.25D and Z = 0. These results are consistent with the pressure and velocity distributions shown in Figure . Figure shows that the characteristics of the tip vortex are different on the pressure and suction sides, and these variations lead to different structural stresses. Considering the differences between the suction and pressure sides is important when analyzing the structural deformations of a rudder.
Figure 17. Vortex evolutions (left) and distributions of structural stresses (right). (a) 5.75T, (b) 5.8125T, (c) 5.875T, (d) 5.9375T, (e) 6T
5.2. Stress fluctuations on the rudder
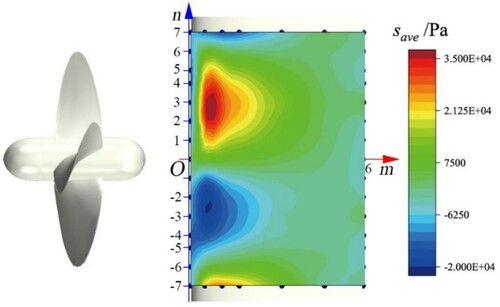
In Section 4.2, the rudder surface is observed to experience intense pressure fluctuations oscillating at 25, 50, 75, and 100 Hz, which are a major cause of the structural vibrations. With the time-averaged stresses in Figure , the average stress, save, is found to be highest at a chordwise position of 0.08C. The save at 0.26D is larger than that at −0.26D. The save at the area directly behind the propeller hub are close to 0. A high stress also appears at 0.59D, which is near the fixed end. The direction of save occurring in that area is opposite that at 0.26D.
Figure 18. Distribution of time-averaged stresses on the rudder surface.
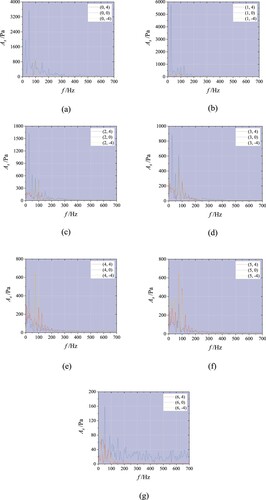
The PSDs of the stresses corresponding to n = 0 and n = ±4 acting on the rudder surface are compared in Figure . Note that most of the stress fluctuations oscillate at frequencies between 0 and 200 Hz. Extremely intense stress fluctuations occurring at 25 and 50 Hz are observed in the hub vortex region. However, probes ((0, 4) and (0, −4)) in the tip vortex region report intense stress fluctuations only at 100 Hz. In the tip vortex region, the stress fluctuation at 75 Hz begins to intensify after 0.08C and its amplitude eventually exceeds that of the BPF stress fluctuation at 0.28C (m = 3). The 125 Hz stress fluctuation also begins to intensify after 0.18C. The low-frequency stress fluctuations (e.g. the 25 Hz stress fluctuation) begin to grow and strengthen after 0.53C (m = 4). They culminate at the trailing edge of the rudder. At this position, the 25, 50, and 75 Hz stress fluctuations are more intense than the 100 Hz stress fluctuation, and their amplitudes decrease with increasing frequency. In the hub vortex region, the stress fluctuations are especially intense near the leading edge of the rudder (m = 0–1). Additionally, the 75 Hz stress fluctuation becomes intense only around 0.28C and 0.78C. The stress fluctuations in the hub vortex region mainly occur within the 25–75 Hz frequencies. However, intense stress fluctuations at higher frequencies (>200 Hz) also occur at the trailing edge of the rudder (m = 5–6).
Figure 19. PSD of the structural stress, s. (a) m = 0, (b) m = 1, (c) m = 2, (d) m = 3, (e) m = 4, (f) m = 5, (g) m = 6
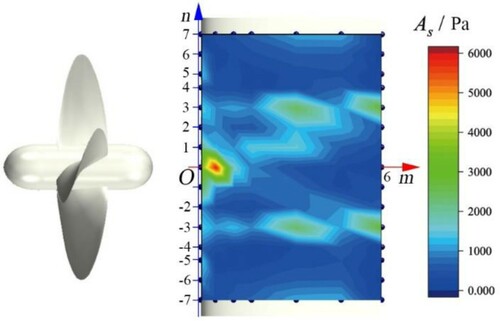
A comparison of Figures and clearly indicates that the spectral features of the pressure and stress on the rudder surface are not entirely identical. Therefore, the maximum stress fluctuation amplitudes of the rudder surface, As, are shown in Figure . The most intense stress fluctuations occur around a chordwise position of 0.08C in the hub vortex region. Additionally, intense stress fluctuations also occur around a spanwise position of 0.26D.
Figure 20. Distributions of stress fluctuations.
5.3. Vibrations on the rudder
The distribution of deformations is detected by the probes on the rudder surface, as shown in Figure . First, the distribution of time-averaged deformations in the Y direction, dyave, is analysed in Figure . Similar to the time-averaged stresses, the maximum dyave occurs in the first 0.28C of the rudder. The spanwise position corresponds to the region between the tip vortex and hub vortex regions. Significant dyave are also can be observed in these spanwise positions at the trailing edge of the rudder. The deformations dyave in the pressure side and suction side are opposite each other. The deformations dyave at same spanwise position on the leading and trailing edges of the rudder also show this trend. In general, the deformations acting on the rudder seem to twist around its center.
Figure 21. Time-averaged deformations in the Y direction.
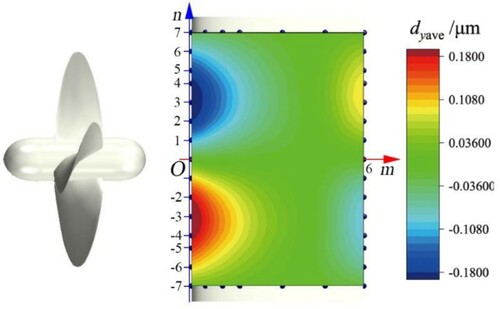
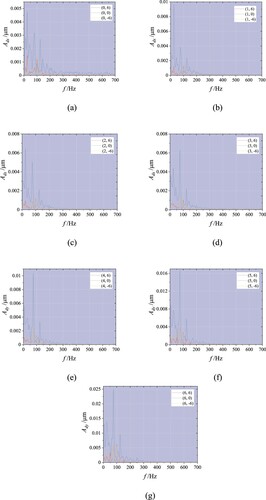
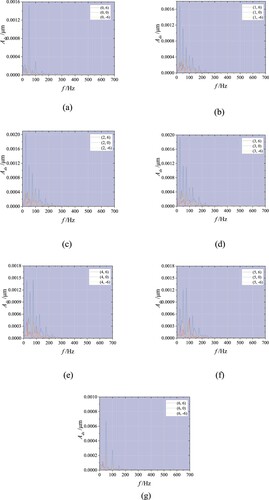
Figure illustrates the frequency domain characteristics of dy recorded by the probes. It can be seen that the fluctuations on the pressure and suction sides are very similar. In the tip vortex region near the leading edge (m = 0–1), intense lateral vibrations can be observed at 25 Hz (SF) and 100 Hz (BPF). The 75 Hz-fluctuation of dy becomes more apparent after 0.18C, attaining an amplitude similar to the 100 Hz fluctuation at 0.28C (m = 3). At 0.53C and 0.78C, the amplitudes of the 75 Hz fluctuation exceed that of the 100 Hz fluctuation. At the trailing edge of the rudder, the amplitudes of the 75 and 100 Hz (BPF) fluctuations are very similar. Intense 25, 50, 75, and 125 Hz vibrations occur in the hub vortex area. The 25 Hz-vibration is the dominant vibration in the first 0.18C of the rudder (m = 0–2). For the remainder of the rudder, the 75 Hz vibration is dominant, and its amplitude increases along the rudder chord. At probe (6, 6), the amplitude of the 75 Hz vibration is 0.025 μm. Although no large lateral deformation can be observed at hub vortex region, the lateral vibrations at hub vortex region are more intense than that at tip vortex region.
Figure 22. PSD of lateral vibrations. (a) m = 0, (b) m = 1, (c) m = 2, (d) m = 3, (e) m = 4, (f) m = 5, (g) m = 6
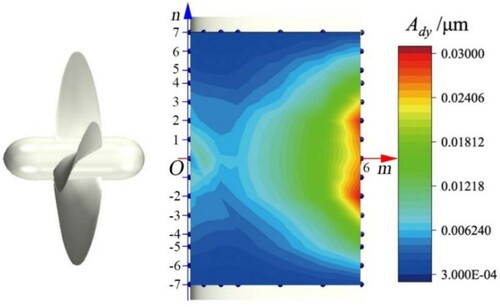
The maximum dy amplitude at each probe, Ady, is plotted in Figure for comparing the intensities of their fluctuations across the rudder surface. The largest Ady values occur behind the propeller hub, especially near the trailing edge, while those behind the tip vortex are much lower. Note that the Ady values are symmetrical about the X-axis (m-axis). The stresses on the upper half (suction side) of the rudder are larger than those in the lower half. Besides, Ady is larger on the pressure side in the area near the trailing edge.
Figure 23. Distributions of lateral vibrations.
The time-averaged deformations of the rudder surface dxave are shown in Figure . The largest deformation in the X direction (dxave) appears in the first 0.28C of the rudder. Furthermore, dxave is larger on the suction side than that on the pressure side. Figure shows that there is no time-averaged stress in the hub vortex region of the rudder surface. Similarly, dxave is also 0 in the hub vortex region. As a whole, dxave appears to be lower than dyave. The frequency-domain characteristics shown in Figure indicate that the dominant dx fluctuation at the leading edge oscillates at 50 Hz in both the tip and hub vortex regions. Behind the leading edge, the most significant dx fluctuations on the rudder surface oscillate at 25, 50, 75, 100, and 125 Hz. In the front part of the rudder (0.08C–0.28C), the dominant dx fluctuations on the rudder surface behind the hub and tip oscillate at 25 and 50 Hz, respectively. However, the tip vortex region also exhibits fluctuations at 25 and 75 Hz with amplitudes similar to the 50 Hz-fluctuation. Moving further down the chord of the rudder (0.53C–0.78C), the dominant dx fluctuations behind the hub oscillate at 75 and 50 Hz. At the trailing edge of the rudder, the rudder surface behind the hub and tip exhibits oscillations in the X direction only at 50 and 100 Hz.
Figure 24. Distribution of time-averaged deformations in the X direction.
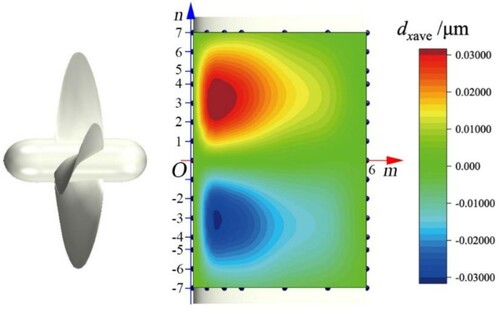
Figure 25. PSD of axial vibrations. (a) m = 0, (b) m = 1, (c) m = 2, (d) m = 3, (e) m = 4, (f) m = 5, (g) m = 6
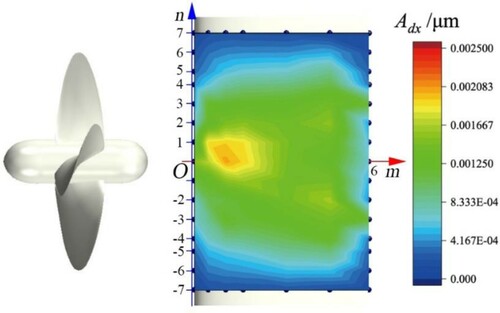
The maximum amplitudes of the axial vibrations on the rudder surface are shown in Figure . The most intense axial vibrations occur at 0.28C, directly behind the propeller hub. Deformation fluctuations with amplitudes greater than 0.00125 μm occur throughout the range of −0.35D–0.35D. Although significant pressure fluctuations are detected by the probes behind the tip vortex ((0, 5–6) and (0, −5 to −6)), dx at these locations are small. The stress fluctuations at most of the positions along the trailing edge are relatively weak. However, intense axial vibrations are detected at probes (6, ±3) and (5, ±2) (Figure ). These intense axial vibrations correlate well with the observed stress fluctuations.
Figure 26. Distributions of axial vibrations.
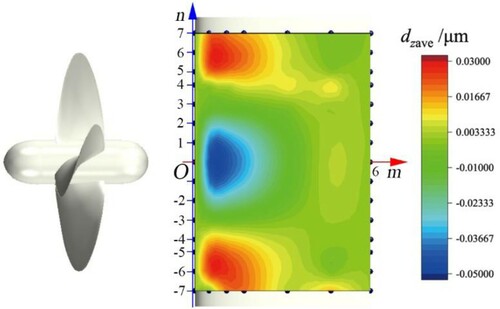
Large deformations in the Z direction are obtained in the first 0.28C of the rudder (Figure ). The maximum positive dzave occurs directly behind the blade tip (on the suction side at n = 6 and on pressure side at n = −6). The maximum negative dzave value is found in the hub vortex region. The region exhibiting large Z direction deformations ranges from n = 6 to probe (5, 4), and from n = −6 to probe (5, −7). However, the Z direction deformations measured by probes (5, −4) and (5, 7) are relatively weak. This misalignment in the distribution of dz is generally consistent with the misalignment of the propeller wake vortex. Comparing the dx and dz values shown in Figures and , it can be observed that the values of dx and dz are close to each other, and both smaller than dy. Furthermore, the positive dx values are larger in magnitude than the negative dy values. Additionally, the negative dz values are larger in magnitude than the positive dz values.
Figure 27. Distribution of time-averaged deformations in the Z direction.
Frequency domain analysis provides an intuitive way to understand rudder vibrations. The dz fluctuations are accordingly subjected to a frequency domain analysis, with the results shown in Figure . Probe (0, 0) detected dz fluctuations oscillating at the SF, but small-amplitude fluctuations of 0.0001 μm occur widely at a frequency range of 0–700 Hz. Probe (6, 0) also detected intense high-frequency fluctuations more intense than those at (0, 0). However, the strongest dz fluctuation at (6, 0) oscillates at a frequency of 75 Hz. In Figure , the 100 Hz oscillation is not the dominant dx fluctuation in the hub vortex region. However, in Figure , the most intense dz fluctuation oscillates at the BPF (100 Hz) in the hub vortex region. In the area behind the blade tip, the dz fluctuations are weak at the leading and trailing edges, but intense in the middle of the rudder. Probes (0, ±6) and (6, ±6) exhibit weak dz fluctuations that have maximum amplitudes <0.00025 μm. At probes (1, ±6), the 50, 75, and 125 Hz fluctuations begin to increase in strength. The amplitudes corresponding to these frequencies are all >0.0004 μm. Note that the BPF (100 Hz) fluctuation is still dominant at this position. At 0.28C, the amplitude of the 75 Hz fluctuation exceeds that of the BPF fluctuation. Furthermore, the amplitudes of the 50 and 125 Hz fluctuations also begin to approach that of the BPF fluctuation. This occurs at the position corresponding to the thickest part of the rudder. At 0.53C–0.78C, the dz fluctuations of the rudder surface behind the tip vortex mainly oscillate at 75 Hz.
Figure 28. PSD of structural displacements in the Z direction. (a) m = 0, (b) m = 1, (c) m = 2, (d) m = 3, (e) m = 4, (f) m = 5, (g) m = 6.
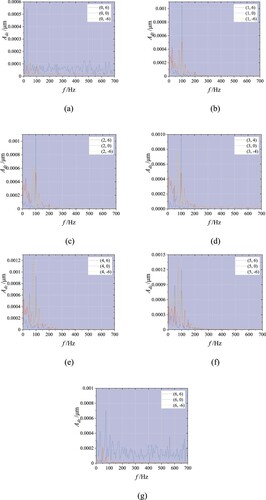
Figure shows the distribution of maximum dz amplitudes, Adz, on the rudder surface. The largest Adz values occur behind the blade tip instead of the propeller hub. Note that Adz is especially high on the pressure side. The area behind the propeller hub does show intense dz fluctuations, but only at (1–2, 1) and (5, 0). The largest Adz values on the trailing edge occur at probes (6, ±3) and (6, 0), while they are almost 0 in the area between these probes.
Figure 29. Distributions of vertical vibrations.
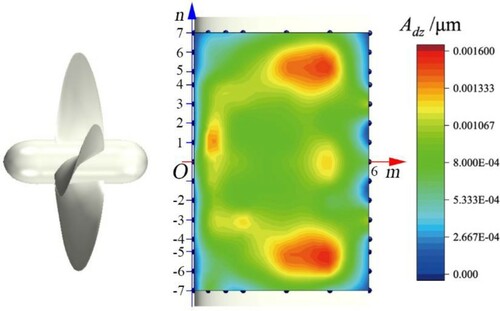
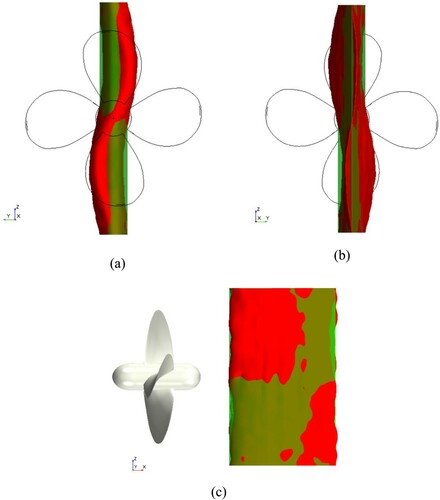
Figure illustrates the overall deformations of the rudder scaled by a factor of 100,000 for easy visibility. The figure indicates that the deformations of the first half of the rudder occur in the same direction as the propeller rotation. The propeller wake causes the leading and trailing edges of the rudder to bend in opposite directions in an S-shape along the pressure and suction sides. Lateral deformation is dominantly observed in the rudder. The maximum dy occurs at the ±0.26D spanwise positions. Other than at the rudder’s fixed ends, the lateral deformations are the smallest directly behind the propeller hub. Additionally, S-shaped deformations are induced in the leading and trailing edges in X direction. The trailing edge in the upper part of the rudder deforms in the -X direction, while the leading edge in the lower part of the rudder deforms in the X direction. Furthermore, the deformations of the leading edge of the rudder are in the same directions as those of the propeller vortex rotation. Although vy is generally weaker than both vx and vz, the deformations of the rudder surface are greatest in the Y direction.
Figure 30. Deformation of the rudder (green: initial state; red: deformation). (a) +X view, (b) −X view, (c) +Y view.
The deformation of the rudder is similar to the fourth mode shape in Figure . The fourth natural frequencies of the two ends fixed rudder is 5055.4 Hz. Hence, the PSD of lateral vibrations obtained by (0–6, 2) are discussed in Figure . Lateral vibrations occurring at the frequencies>2000Hz are weak.
Figure 31. PSD of lateral vibrations (probes (0–6, 2)).
5.4. Structural response of the plate
The vibrations of the rudder have been obtained in the propeller-rudder interaction. However, the natural frequencies are much larger than the excitation frequencies. Hence, a plate fixed at two ends has been used to replace the rudder. The structural response of a plate operating in the propeller wake has been study with same propeller, same rotation speed, and advance velocity. The configuration of the propeller-plate system layout of the probes are shown in Figure . The plate is fixed at two ends, and natural frequencies of the plate are much smaller than that of the two ends-fixed rudder (Figure ).
Figure 32. Configuration of the propeller and plate.
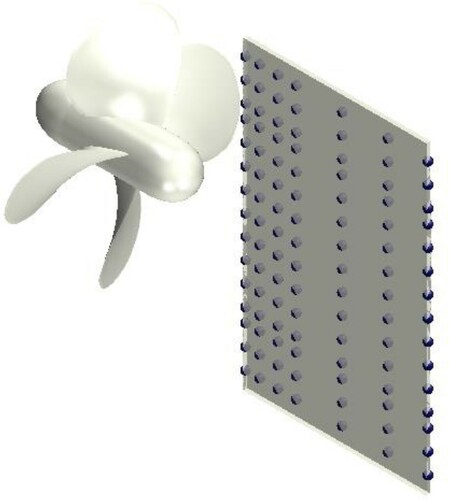
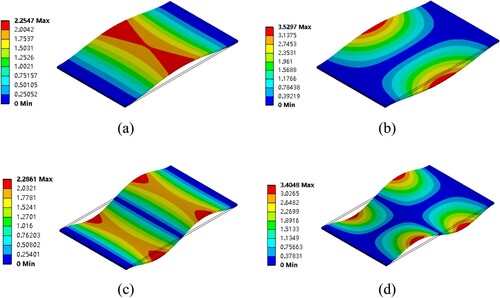
Figure 33. Mode shapes and natural frequencies of the plate. (a) Mode 1 (244.36 Hz), (b) Mode 2 (354.14 Hz), (c) Mode 3 (673.18 Hz), (d) Mode 4 (838.07 Hz),
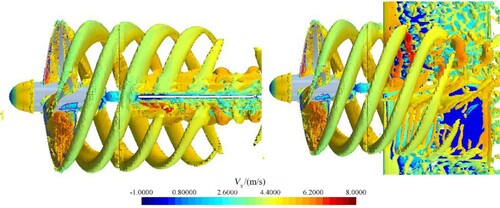
The propeller tip vortex also undergoes spanwise and chordwise displacements when the tip vortex encounters the plate (Figure ). The relationship between the rotation and displacement directions is same as that in the propeller-rudder interaction.
Figure 34. Vortex evolution in the propeller-plate interaction.
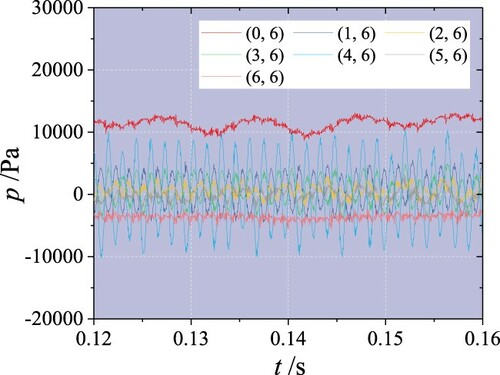
The pressure fluctuations on the probes (0–6, 6) are shown in Figure . For the probe placed at the front of the leading edge of the plate (probe (0, 6)), the pressure fluctuation is similar to that in the Figure . However, for probes placed at the side of the plate, the pressure fluctuations are different from those obtained by probes in the propeller-rudder interaction.
Figure 35. Pressure fluctuations monitored by probes (0–6, 6).
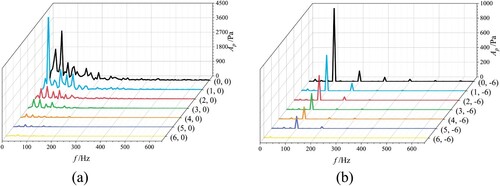
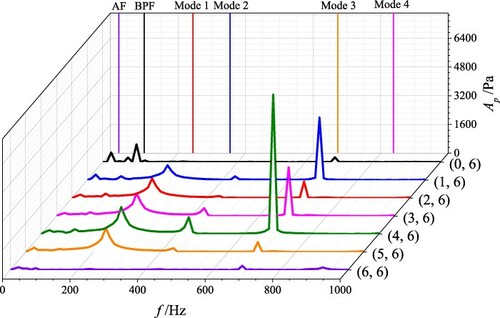
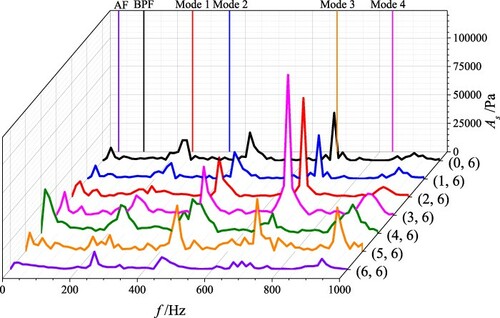
For a further comparison, frequency domain features are performed by FFT (Figure ). More intense fluctuations at SF and BPF can be observed at the leading edge of the plate. The two ends-fixed plate has smaller natural frequencies than the two ends fixed rudder, while the BPF are fixed at 100 Hz. In the propeller-plate interaction, the SF and BPF are closer to natural frequencies of the plate. At the first three natural frequencies, intense pressure fluctuations can be observed, especially for probes (1–4, 6). Pressure fluctuations on the leading edge of the plate are dominant at SF and BPF. At the side of the plate, the pressure fluctuations at the SF and BPF are much weaker than the pressure fluctuations at the first three natural frequencies. The most intense fluctuation appears at the third natural frequency.
Figure 36. PSD of the pressure on the probes (0–6, 6).
In the propeller-plate interaction, the pressure fluctuations on the plate surface can be impacted by the natural frequencies of the plate. Then the stress fluctuations and vibrations with this BPF are be investigated (Figure ). For the probe located at the leading edge of the plate (probe (0, 6)), more intense fluctuations can be observed in the SF and the frequencies near the natural frequencies. The fluctuations at the BPF are weak, while the most intense fluctuation appears at 687.50 Hz, which is close to the third natural frequency (673.18 Hz). For the stress fluctuations on the rudder side, intense fluctuations also occur at the 687.50 Hz.
Figure 37. PSD of the stress fluctuations on the probes (0–6, 6).
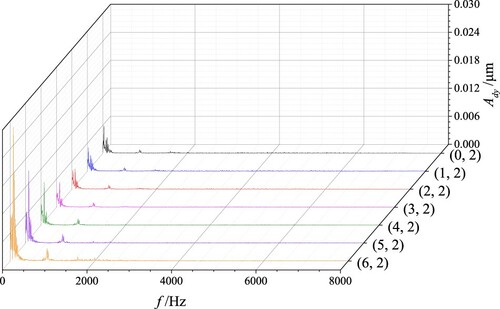
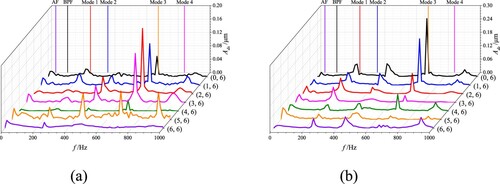
For the plate surface in the tip vortex region, intense stress fluctuations can be observed at 925 Hz, which is near the fourth natural frequency. However, at this frequency, no apparent dy fluctuation or lateral vibration can be obtained (Figure ). The dy fluctuations are more intense at SF and frequencies near the first/second/third natural frequencies. The most intense lateral vibration appears at the frequencies near the third natural frequencies. In the hub vortex region, the dominant lateral vibration occurs near the second natural frequency (Figure ). In contrary, the lateral vibrations occurring at 600–1000 Hz are weak. Consistent with Figure , the dx and dz fluctuations in the tip vortex region are also dominant at the frequencies near the third natural frequencies (Figure ).
Figure 38. PSD of the dy on the probes (0–6, 6).
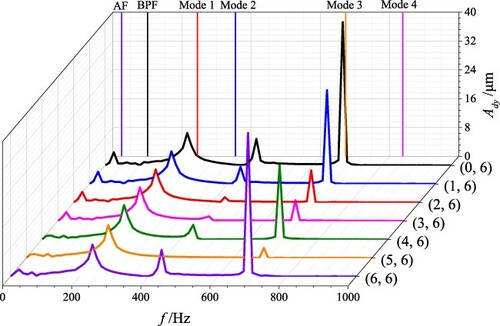
Figure 39. PSD of the dy on the probes (0–6, 0).
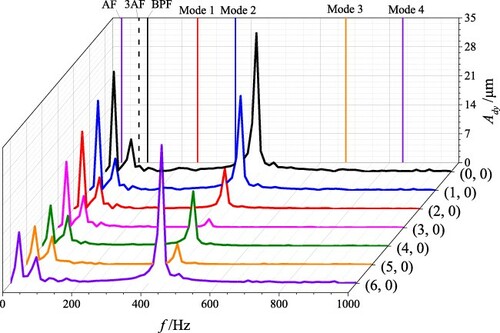
Figure 40. PSD of the dx and dz on the probes (0–6, 6). (a) dx, (b) dz.
According to Figure , the second mode shape is twisting in Z axis, and the third mode shape is bending. In the third mode, the most intense vibration occur at the tip vortex region, while the vibrations in the hub vortex region are close to zero (Figure (c)). In the second mode shape, the vibrations concentrate at the leading edge and trailing edge. For the plate surface in the tip vortex region, the lateral vibrations occurring near the third natural frequencies are much more intense at the leading edge (probe (0, 6)) and trailing edge (probe (6, 6)), which consistent with third mode shape. The dominant lateral vibrations on the probes (0, 0) and (6, 0) are more intense than that on the probes (1–5, 0). Hence, in the present propeller-plate interaction, the natural frequency plays a more important role in the propeller-induced vibrations of the plate.
5.5. Summary
The rudder exhibits high stresses and intense stress fluctuations in the area between the hub and tip vortex regions. However, despite these significant fluctuations, the time-averaged stress of the hub vortex region is zero. In the tip vortex region, the stress fluctuations are dominated by BPF oscillations at the leading edge, 75 Hz oscillations at positions between 0.28C and 0.53C, and SF oscillations at positions beyond that. Unlike the tip vortex region, the axial-frequency stress fluctuations are entirely dominant in the hub vortex region.
Lateral deformation is the main component of rudder deformation. The largest lateral and axial deformations both occur in the first 0.28C of the rudder. These deformations are also larger on the suction side than that on the pressure side. At 0.28C, the axial deformation fluctuations are significant, but the lateral vibrations are weak. The lateral deformations of the trailing edge are opposite those of the leading edge. Although the lateral deformations at the trailing edge are small, their fluctuations are quite intense. The lateral vibrations in the tip vortex region are dominated by vibrations at the BPF and SF near the leading edge. The 75 Hz vibration gradually becomes dominant after the 0.28C position. The axial deformations in the tip vortex region exhibit significant vibrations at the SF, the second/third-order harmonic of the SF, and the BPF. The lateral and axial deformations of the hub vortex region both average to almost zero, though the axial deformations exhibit intense fluctuations. The lateral and axial vibrations of the hub vortex region mainly occur at SF at the area near the leading edge of the rudder. However, the lateral vibrations gradually become dominated by the 75 Hz vibrations after 0.28C.
In the first 0.28C of the rudder, the vertical deformation is apparent in the hub vortex region, and that in the tip vortex region is significant. Additionally, the vertical deformations of the rudder surface are offset in the same direction as the misalignment of the tip vortex. In the tip vortex region, the vertical vibrations in the first 0.18C are dominating at the SF and BPF. After 0.28C, the 75 Hz vertical vibration becomes dominant. In the hub vortex region, the vertical vibrations oscillate at the SF, 75 Hz, and the BPF. The interaction between the rudder and propeller tip vortex leads to S-shaped deformations in the rudder. These deformations are most significant in the trailing and leading edges, where they act in opposite directions.
Spanwise and chordwise displacements of the tip vortex of the propeller are also can be observed in the propeller-plate interaction. Due to the natural frequencies of the plate are closer to the excitation frequencies, the natural frequency plays a more important role in the propeller induced vibration of the plate than the propeller.
6. Conclusion
DES is used to analyze the structural responses of the rudder in the propeller-rudder interaction. Next, frequency domain analyses are used to conduct three-dimensional comparisons of the pressure, stresses, and vibrations acting on the rudder. The relationship between the natural frequencies and structural response have also been studied with a plate.
The results indicate that the flow field pressure near the rudder is high in the area between the tip vortex and hub vortex regions. Additionally, the two sides of the rudder exhibit vertical velocities in opposite directions. Pressure fluctuations are much more intense in the hub vortex region than tip vortex region. Moreover, they mainly oscillate at the SF and BPF in the hub vortex and tip vortex regions.
The maximum stress on the rudder is located in the area between the hub vortex and tip vortex regions. The stress fluctuations are especially intense in this area and the propeller hub region. The stress fluctuations in the tip vortex region mainly oscillate at the BPF and SF near the leading and trailing edges. Intense axial-frequency fluctuations occur in the middle of the rudder. The area between the tip vortex and hub vortex regions also exhibits the highest deformation velocities at the leading and trailing edges. The lateral deformation velocities are the largest in the first 0.53C of the rudder, and the vertical deformation velocities are the largest at the trailing edge of the rudder.
In the tip vortex region, the lateral vibrations are dominated by the SF and BPF oscillations at the leading edge. However, the 75 Hz fluctuation becomes quite significant at positions beyond 0.53C. In the hub vortex region, the lateral vibrations near the leading edge mostly occur at the SF. These vibrations mainly oscillate at 75 Hz at all other positions. The deformation fluctuations of the tip vortex and hub vortex regions are intense at the trailing edge but weak at the leading edge. The amplitudes of the axial and vertical vibrations are generally weaker than those of lateral vibrations. The maximum amplitude of the lateral vibration occurs in the area between the tip vortex and hub vortex regions. However, that of the vertical vibration occurs in both the tip vortex and hub vortex regions. In particular, vertical deformations in the tip vortex region also exhibit offsets in the same direction as the misalignment of the tip vortex. The most significant deformations of the rudder occur at its leading and trailing edges, both of which exhibit S-shaped deformations in opposite directions. When the natural frequencies are close to the excitation frequencies, the former play a more important role in causing vibrations and deformations.
Limited by the length of the paper, only the two ends-fixed rudder has been considered. However, since the support conditions also have strong influence on the vibration of a rudder operating in propeller wake, their influence can be studied in future.
Acknowledgements
This research was supported in part with computational resources at the Harbin Engineering University. We would like to thank Xu Wang and Yingzhu Wang, and so on, for their help and guidance. We would also like to thank the anonymous reviewers and the editors for their comments.
Disclosure statement
No potential conflict of interest was reported by the author(s).
Additional information
Funding
References
- Abramowski, T., Handke, J., & Szelangiewicz, T. (2010). Numerical analysis of influence of streamline rudder on screw propeller efficiency. Polish Maritime Research, 17(2), 18–22. https://doi.org/https://doi.org/10.2478/v10012-010-0013-4
- Affes, R., & Conlisk, A. T.. (1993). The three-dimensional boundary-layer flow due to a vortex filament outside a circular cylinder. In 31st Aerospace Sciences Meeting, 11 January 1993 - 14 January 1993. Reno, NV, USA. https://doi.org/https://doi.org/10.2514/6.1993-212
- Felli, M., Camussi, R., & Felice, F. D. (2011). Mechanisms of evolution of the propeller wake in the transition and far fields. Journal of Fluid Mechanics, 682, 5–53. https://doi.org/https://doi.org/10.1017/jfm.2011.150
- Felli, M., & Falchi, M. (2011). Propeller tip and hub vortex dynamics in the interaction with a rudder. Experiments in Fluids, 51(5), 1385–1402. https://doi.org/https://doi.org/10.1007/s00348-011-1162-7
- Felli, M., Guj, G., & Camussi, R. (2008). Effect of the number of blades on propeller wake evolution. Experiments in Fluids, 44(3), 409–418. https://doi.org/https://doi.org/10.1007/s00348-007-0385-0
- Felli, M., Roberto, C., & Guj, G. (2009). Experimental analysis of the flow field around a propeller-rudder configuration. Experiments in Fluids, 46(1), 147–164. https://doi.org/https://doi.org/10.1007/s00348-008-0550-0
- Ghalandari, M., Shamshirband, S., Mosavi, A., & Chaw, K. W. (2019). Flutter speed estimation using presented differential quadrature method formulation. Engineering Applications of Computational Fluid Mechanics, 13(1), 804–810. https://doi.org/https://doi.org/10.1080/19942060.2019.1627676
- Gong, J., Guo, C. Y., Zhao, D. G., Wu, T. C., & Song, K. W. (2018). A comparative DES study of wake vortex evolution for ducted and non-ducted propellers. Ocean Engineering, 160, 78–93. https://doi.org/https://doi.org/10.1016/j.oceaneng.2018.04.054
- He, L., & Kinnas, S. A. (2017). Numerical simulation of unsteady propeller/rudder interaction. International Journal of Naval Architecture and Ocean Engineering, 9(6), 677–692. https://doi.org/https://doi.org/10.1016/j.ijnaoe.2017.02.004
- Hirsa, A., Lopez, J. M., & Kim, S. (2000). Evolution of an initially columnar vortex terminating normal to a no-slip wall. Experiments in Fluids, 29(4), 309–321. https://doi.org/https://doi.org/10.1007/s003489900086
- Howe, M. S. (1988). Contributions to the theory of sound production by vortex-airfoil interaction with application to vortices with finite axial velocity defect. Proceedings of the Royal Society A: Mathematical, Physical and Engineering Sciences, 420(1858), 157–182. https://doi.org/https://doi.org/10.1098/rspa.1988.0122
- Howe, M. S. (1989). On unsteady surface forces, and sound produced by the normal chopping of a rectilinear vortex. Journal of Fluid Mechanics, 206, 131–153. https://doi.org/https://doi.org/10.1017/S0022112089002259
- Hu, J., Wang, Y., Zhang, W., Chang, X., & Zhao, W. (2019a). Tip vortex prediction for contra-rotating propeller using large eddy simulation. Ocean Engineering, 194, 106410, 1-17. https://doi.org/https://doi.org/10.1016/j.oceaneng.2019.106410
- Hu, J., Zhang, W. P., Guo, H., Sun, S. L., Chen, F., & Guo, C. (2020). Numerical simulation of propeller wake vortex–rudder interaction in oblique flows. Ships and Offshore Structures, 16(2), 144–155. https://doi.org/https://doi.org/10.1080/17445302.2020.1711630
- Hu, J., Zhang, W. P., Sun, S. L., & Guo, C. (2019b). Numerical simulation of vortex–rudder interactions behind the propeller. Ocean Engineering, 190, 106446, 1-14. https://doi.org/https://doi.org/10.1016/j.oceaneng.2019.106446
- ITTC. (2002). QM Procedure 7.5-03-01-01.
- Jiang, J., Cai, H., Ma, C., Qian, Z., Chen, K., & Wu, P. (2019). A ship propeller design methodology of multi-objective optimization considering fluid-structure interaction. Engineering Applications of Computational Fluid Mechanics, 12(1), 28–40. https://doi.org/https://doi.org/10.1080/19942060.2017.1335653
- Jiang, Y., Mao, M. L., Deng, X. G., & Liu, H. Y. (2015). Numerical investigation on body-wake flow interaction over rod-airfoil configuration. Journal of Fluid Mechanics, 779, 1–35. https://doi.org/https://doi.org/10.1017/jfm.2015.419
- Johnston, R. T., & Sullivan, J. P. (1992). Unsteady wing surface pressures in the wake of a propeller. AIAA Journal, 30(5), 644–651. https://doi.org/https://doi.org/10.2514/3.46393
- Kumar, P., & Mahesh, k. (2017). Large eddy simulation of propeller wake instabilities. Journal of Fluid Mechanics, 814, 361–396. https://doi.org/https://doi.org/10.1017/jfm.2017.20
- Li, D. Q. (1996). A non-linear method for the propeller-rudder interaction with the slipstream deformation taken into account. Computer Methods in Applied Mechanics and Engineering, 130(1–2), 115–132. https://doi.org/https://doi.org/10.1016/0045-7825(96)80458-0
- Marshall, J. S. (1994). Vortex cutting by a blade. I – general theory and a simple solution. AIAA Journal, 32(6), 1145–1150. https://doi.org/https://doi.org/10.2514/3.12113
- Marshall, J. S., & Grant, J. R. (1996). Penetration of a blade into a vortex core: Vorticity response and unsteady blade forces. Journal of Fluid Mechanics, 306, 83–109. https://doi.org/https://doi.org/10.1017/S0022112096001243
- Marshall, S. J., & Yalamanchili, R. (1994). Vortex cutting by a blade, part II: Computations of vortex response. AIAA Journal, 32(7), 1428–1436. https://doi.org/https://doi.org/10.2514/3.12212
- Mascio, D. A., Muscari, R., & Dubbioso, G. (2014). On the wake dynamics of a propeller operating in drift. Journal of Fluid Mechanics, 754, 263–307. https://doi.org/https://doi.org/10.1017/jfm.2014.390
- Muscari, R., Dubbioso, G., & Mascio, D. A. (2017). Analysis of the flow field around a rudder in the wake of a simplified marine propeller. Journal of Fluid Mechanics, 814, 547–569. https://doi.org/https://doi.org/10.1017/jfm.2017.43
- Paik, B. G., Kim, G. D., Kim, K. S., Kim, K. Y., & Suh, S. B. (2012). Measurements of the rudder inflow affecting the rudder cavitation. Ocean Engineering, 48, 1–9. https://doi.org/https://doi.org/10.1016/j.oceaneng.2012.03.005
- Roache, P. J. (1997). Quantification of uncertainty in computational fluid dynamics. Annual Review of Fluid Mechanics, 29(1), 123–160. https://doi.org/https://doi.org/10.1146/annurev.fluid.29.1.123
- Rockwell, D. (1998). Vortex-body interactions. Annual Review of Fluid Mechanics, 30(1), 199–229. https://doi.org/https://doi.org/10.1146/annurev.fluid.30.1.199
- Salih, S. Q., Aldlemy, M. S., Rasani, M. R., Ariffin, A. K., Ya, T. M. Y. S. T., Al-Ansari, N., Yaseen, Z. M., & Chau, K.-W. (2019). Thin and sharp edges bodies-fluid interaction simulation using cut-cell immersed boundary method. Engineering Applications of Computational Fluid Mechanics, 13(1), 860–877. https://doi.org/https://doi.org/10.1080/19942060.2019.1652209
- Shi, Z., Wu, J. M., & Wu, J. Z. (1991). Symmetric and asymmetric jets in a uniform crossflow. 29th aerospace sciences meeting (AIAA), 07 January 1991 - 10 January 1991, Reno, Nevada. https://doi.org/https://doi.org/10.2514/3.46393
- Shur, M. L., Spalart, P. R., Strelets, M. K., & Travin, A. K. (2008). A hybrid RANS-LES approach with delayed-DES and wall-modelled LES capabilities. International Journal of Heat and Fluid Flow, 29(6), 1638–1649. https://doi.org/https://doi.org/10.1016/j.ijheatfluidflow.2008.07.001
- SIEMENS. (2019). STAR-CCM+ user guide (version: 14.02), pp. 7515–7565.
- Stella, A., Guj, G., & Felice, F. D. (2000). Propeller wake flowfield analysis by means of LDV phase sampling techniques. Experiments in Fluids, 28(1), 1–10. https://doi.org/https://doi.org/10.1007/s003480050001
- Sun, C., Wang, C., Sun, S. X., Chang, X., & Zhang, L. (2018). Numerical prediction analysis of the fluctuating pressure and rudder force of full-scale hull-propeller-rudder system. Ocean Engineering, 147, 580–590. https://doi.org/https://doi.org/10.1016/j.oceaneng.2017.11.006
- Turnock, S. R., & Wright, A. M. (2000). Directly coupled fluid structural model of a ship rudder behind a propeller. Marine Structures, 13(1), 53–72. https://doi.org/https://doi.org/10.1016/S0951-8339(00)00009-5
- Wang, L., Guo, C. L., Su, Y. M., Xu, P., & Wu, T. (2017). Numerical analysis of a propeller during heave motion in cavitating flow. Applied Ocean Research, 66, 131–145. https://doi.org/https://doi.org/10.1016/j.apor.2017.05.001
- Wang, L., Guo, C. L., Xu, P., & Su, Y. (2019). Analysis of the wake dynamics of a propeller operating before a rudder. Ocean Engineering, 188, 106250. https://doi.org/https://doi.org/10.1016/j.oceaneng.2019.106250
- Wu, J. Z., Ma, H. Y., & Zhou, M. D.. (2006). Vorticity and vortex dynamics. ISBN: 978-3-540-29028-5 (pp. 435–439). Berlin, Heidelberg: Springer.
- Yilmaz, N., Aktas, B., Sezen, S., Atlar, M., Fitzsimmons, P., & Felli, M. (2019a). Numerical investigations of propeller-rudder-hull interaction in the presence of tip vortex cavitation. In The sixth international symposium on marine propulsors, 26 May - 30 May, 2019. Rome, Italy.
- Yilmaz, N., Atlar, M., & Khorasanchi, M. (2019b). An improved mesh adaption and refinement approach to cavitation simulation (MARCS) of propellers. Ocean Engineering, 171, 139–150. https://doi.org/https://doi.org/10.1016/j.oceaneng.2018.11.001
- Zhang, Q., & Jaiman, R. K. (2019). Numerical analysis on the wake dynamics of a ducted propeller. Ocean Engineering, 171, 202–224. https://doi.org/https://doi.org/10.1016/j.oceaneng.2018.10.031