
 ?Mathematical formulae have been encoded as MathML and are displayed in this HTML version using MathJax in order to improve their display. Uncheck the box to turn MathJax off. This feature requires Javascript. Click on a formula to zoom.
ABSTRACT
Complex two-phase flow phenomena in wellbores after sour gas kick may lead to severe well control incidents. By bridging the gas solubility, H2S phase transition and flow equations, a two-phase flow model is established under conditions of transient and non-isothermal states in wellbores, which is well validated against the two-phase flow experimental data. The following conclusions are drawn in the article: (1) a higher dissolved quantity and larger density of invaded sour gas containing H2S and CH4 in drilling fluids makes the detection of gas influx with high H2S content more difficult at an early stage; (2) when the mixed fluids move up to the wellhead, the release of the dissolved gas, the sharp decline of density of sour gas and the phase transition of H2S reduce the annulus pressure and induce complicated well control risks; (3) during H2S and CH4 influx, there are five major parameters that impact the bottom-hole pressure, which are evaluated for well control analysis. The proposed model shows a strong capacity to exhibit proper control of the wellhead back pressure, which can help to prevent the phase transition of H2S and reduce risks to well control.
1. Introduction
Gas reservoirs with a high content of hydrogen sulfide (H2S) are commonly referred to as sour gas or acid gas reservoirs, which are widely distributed around the world. More than 400 gas reservoirs containing H2S have been identified, most of which are located in Canada, the United States, Russia, China and the Middle East (Al-Jaberi et al., Citation2017). About 60% of natural gas resources discovered in the world contain H2S, and about 10% of the gas fields containing H2S are high-sulfur gas fields, most of which are found in marine strata (Table ; Zhou, Citation2017). In China, a quarter of natural gas fields are sour gas reservoirs, which are located in the Sichuan Basin, the Tarim Basin, the Bohai Bay Basin, the Ordos Basin, etc. (Zhu et al., Citation2004). For example, more than two-thirds of the gas fields in the Sichuan Basin contain H2S, and the highest fraction concentration of H2S exceeds 30% of the total volume. Carbonate reservoirs of the Tazhong area in the Tarim Basin contain H2S, which are generally medium-high sulfur content natural gas, and the highest fraction concentration of H2S exceeds 45% of the total volume. The maximum concentration of H2S in the Zhaolanzhuang gas field located in the Bohai Bay Basin reaches 92% of the volume fraction (Yuan, Citation2006).
Table 1. Distribution of high-sulfur gas fields in the world.
A kick happens when formation fluids invade the wellbore owing to the difference between pore pressure and annulus pressure (Vajargah & Van Oort, Citation2015). Sour gas reservoirs are typically located in marine carbonate formations and the formation conditions are complex with narrow safety pressure windows. Thus, kicks readily occur during the exploration of sour gas reservoirs, especially those with high H2S content, which commonly causes complicated incidents. The phase transition of H2S might change significantly because annulus temperature and pressure decline near the wellhead. Simultaneously, there is a great change in the sour gas solubility. Thus, complex two-phase flow phenomena in annuli after sour gas kick might lead to serious well control incidents. Multiple severe blowouts have occurred over the past few decades. A deadly blowout of pure H2S was determined in the Zhao-48 well of the Bohai Bay Basin, China. In 1999, an underground blowout incident occurred in the Luojia2 well with a high H2S concentration. In 2003, the Chongqing ‘12.23’ gas blowout was confirmed to be partially related to H2S phase change, when the Luojia 16H well was being drilled (Dou et al., Citation2013; Huse & He, Citation2010). A sour gas blowout occurred in the Larq-3 well, which was followed by explosions and fires and was only controlled after 53 days. In Texas, USA, more than 200 blowout incidents were determined in the past decade, including 28 sour gas cases with a high H2S content. Similar well control incidents of sour gas were reported in Canada, the Middle East and Russia (He, Citation2008). Therefore, two-phase transient flow and well control analysis during a sour gas kick have become critical for drilling operations in sour gas reservoirs with high H2S content.
As is known, serious well control incidents could result from sour gas influx with high H2S content. There is a lack of study of two-phase transient flows with high H2S fractions in sour gas influx. In most existing two-phase flow models describing gas kick, only conventional natural gas and mud are considered in the analysis of wellbore flow and well control (Ambrus et al., Citation2015; Avelar et al., Citation2009; Choe et al., Citation2005; Ghalandari et al., Citation2019; Lage et al., Citation2003; Nickens, Citation1987; Perez-Tellez et al., Citation2003; Salih et al., Citation2019; Santos, Citation1991; Udegbunam et al., Citation2015; Xu et al., Citation2018), whereas the flow characteristics of sour gas with high H2S content are significantly different from those of conventional gases. Therefore, these research results cannot benefit well control operations as sour gas invades. Limited research has been conducted on sour gas influx when it is mixed with H2S. Few publications deal with kick or well control in the case of sour gas or pure H2S (Dou et al., Citation2012, Citation2013; Shi et al., Citation2008; Sun et al., Citation2012, Citation2013; Yuan, Citation2006; Zhang et al., Citation2010). Previous research on this topic does not integrate the influx rate with reservoir seepage flow, which was considered to be a constant from sour gas reservoir to annulus. There is a lack of quantitative evaluation of the major factors that influence wellbore flow and well control safety. Furthermore, the effect of heat transfer, sour gas solubility in mud and the H2S phase transition in the process of invaded mixed fluid traveling upwards have been neglected. Sun et al. (Citation2012, Citation2013) and He et al. (Citation2017) have included the solubility of H2S in the study of fluid flow within wellbores, whereas other factors were not considered such as two-phase flow heat transfer in wellbores and reservoir–wellbore coupling. He et al. (Citation2017) only simulated sour gas kick during Managed Pressure Drilling (MPD) operations, which is different from sour gas influx during conventional drilling. For supercritical CO2 influx, Dou et al. (Citation2019, Citation2021) studied the mechanisms of CO2 phase transition along with transient flow. The physical properties, flow behavior and phase characteristics of H2S and CO2 are very different. Only pure CO2 fluid was studied in their research.
After sour gas of high H2S fraction invades the wellbore, H2S dissolves in the water-based mud and subsequently changes from liquid to gas as the invaded fluid flows up through the wellbore. The annulus temperature and pressure of two-phase mixed fluids interact with each other. The properties and flow parameters of wellbore fluid vary significantly with the temperature and pressure changes. Therefore, based on three governing equations (continuity, momentum and energy conservation), this research article aims to establish a two-phase flow model under conditions of transient and non-isothermal states in wellbores to simulate sour gas with high H2S content kick. Transient flow characteristics, sour gas properties and the phase change of H2S could be investigated with the proposed model. Annulus pressure variation and well control risk could be analyzed in such research. Also, the effects of some of the main operating parameters of kick on the Bottom-Hole Pressure (BHP) and flow behavior during H2S and CH4 influx could be evaluated. This research could provide theoretical fundamentals and technical support during sour gas reservoir drilling.
2. Mathematical model development
2.1. Model hypothesis
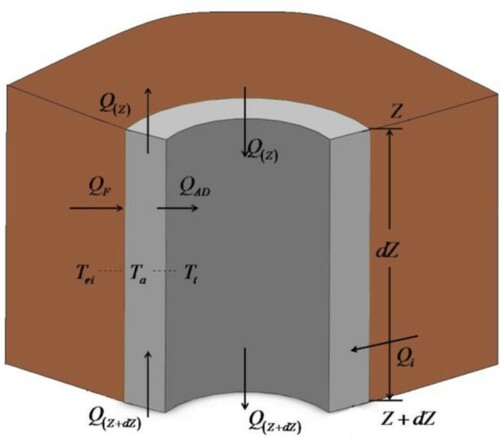
Figure demonstrates a schematic diagram of the transient flow process for two-phase fluid and heat transfer during high H2S content sour gas influx. The governing equations are restricted to the following major assumptions.
The fluids are assumed to move in a one-dimensi-onal way in the wellbore, not considering radial flow.
The invaded fluid Qi is assumed as the source term of the energy conservation equations.
We neglect heat transfer phenomena between the gas and the liquid.
It is assumed that drilling cuttings do not influence heat transfer and fluid flow within the annulus.
The properties of drilling mud are considered to remain constant within wellbores.
Figure 1. Schematic of two-phase flow during high H2S content sour gas influx.
2.2. Flow and energy equations for transient flow in wellbores
Drilling fluids circulate normally within the wellbore before sour gas enters, as shown in Figure . This circulation process includes the following segments. First, the drilling fluid flows downwards within the drill string from Q(Z) to Q(Z + dZ) reaching the drill bit. After circulation out of the drill bit, the drilling fluid flows upwards within the annulus from Q(Z + dZ) to Q(Z). The drilling fluid circulates out of the annulus to the surface.
The flow through the wellbore during high H2S content sour gas influx consists of the following three parts.
High H2S content sour gas enters into the bottom hole.
The invaded sour gas mixes with the drilling fluid and then they move up together.
Only drilling fluid without gas invasion flows in the uppermost section of the annulus.
The continuity and momentum equations of part (1) are shown in Equations (1) and (3), respectively. There is a lack of a sour gas influx qi in part (2) in comparison to part (1). part (3) is a simple drilling fluid single-phase flow.
2.2.1. Continuity conservations
Equation (1) is the continuity conservation equation of free gas, liquid and dissolved gas. Equation (Equation3(4)
(4) ) is the momentum conservation equation of the liquid phase and the free gas phase. In the liquid phase, the dissolved gas is mixed up with the drilling fluid.
(1)
(1)
(2)
(2) where A is annulus area (m2); E is the volume fraction of drilling fluids (dimensionless);
represents time (s);
is the fluid density (kg/m3);
represents the axial position (m);
is the superficial velocity (m/s);
is the gas influx rate per unit length (kg/m·s); and
is the dissolved amount of gas influx per unit length (kg/m·s). The subscript
is free gas,
is dissolved gas and
is drilling fluid.
2.2.2. Momentum conservation equations
Equation (3) shows the momentum conservationequation:
(3)
(3) where
represents the gravitational constant, 9.81 m/s2 and
represents the inclination angle with reference to the vertical direction (°). The subscript
represents friction pressure.
In this research, we apply the mechanistic model of Perez-Tellez et al. (Citation2003) to estimate the pressure gradient of gas–liquid two-phase flow.
In addition, we apply the friction factor expression proposed by Chen (Citation1979), which responds to the relative roughness and the Reynolds number.
2.2.3. Energy conservation equations
In Figure , the heat source of micro unit dZ in the annulus consists of two parts: the heat inflow Q(Z + dZ) from the lower annulus and the heat inflow QF from the formation. The heat loss of micro unit dZ also consists of two parts: the heat outflow Q(Z) from the annulus upside and heat QAD transfer from annulus to drill string. Note that the heat source Qi brought by the sour gas invasion should be considered in the bottom hole. The following equations are derived based on the energy conservation equation.
Energy conservation equation for annulus fluid flow is given by Equation (4):
(4)
(4) The invaded fluid Qi from sour gas reservoirs into the annulus is considered as the additional heat source in the bottom hole, as shown in Equation (5):
(5)
(5) The steady-state energy equation of two-phase flow within the annulus is deduced as shown in Equation (6):
(6)
(6) where h represents the specific enthalpy (kJ/kg).
Similarly, the steady-state energy equation of two-phase flow in the bottom hole is given by Equation (7):
(7)
(7) Therefore, the steady energy equation for single-phase flow within the drill string is given by Equation (8):
(8)
(8) where
is the drill string area (m2).
We apply the unsteady-state heat transfer equation for QAD and the steady-state heat transfer equation for QF proposed by Kabir et al. (Citation1996).
The research results summarized by Dou et al. (Citation2013) and Abadi et al. (Citation2020) on two-phase flow heat transfer coefficients for different flow patterns, such as bubble flow, dispersed bubble flow, slug flow, churn flow and annulus flow, are used in this article.
2.3. Auxiliary equation
2.3.1. Physical properties of H2S and high H2S content sour gas
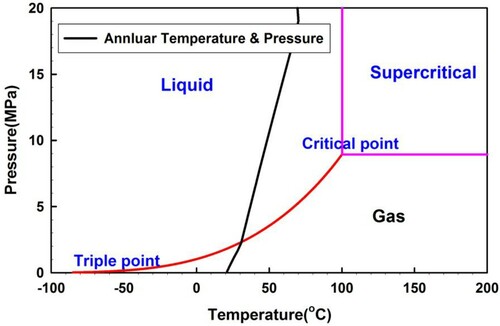
H2S is generally in the liquid state in gas reservoirs, which is caused by a high formation pressure and temperature. H2S changes from the liquid state to the gaseous state owing to the decline in wellbore pressure and temperature when the mixed fluid flows up along the wellbore as shown in Figure . H2S might become supercritical at deep or ultra-deep depths because the annulus temperature and pressure exceed the critical states of H2S, as shown in Figure . The critical point of H2S is about 100.22°C (373.37 K) temperature and 8.963 MPa pressure. In this case, H2S initially has supercritical status, which is subsequently changed to liquid as it flows upwards and finally to gas in the wellhead area.
Figure 2. Phase state diagram of H2S. The black line illustrates H2S phase transition caused by change of annulus temperature and pressure as the invaded H2S travels up along the wellbore.
2.3.2. Equation of state for H2S
For pure or mostly pure H2S, this article uses the Helmholtz free energy Equation Of State (EOS) for H2S proposed by Sakoda and Uematsu (Citation2004) (SU-EOS). SU-EOS is a function of reduced temperature and density with 23 terms on the basis of selected measurements. SU-EOS consists of the ideal-gas state contribution, , and the residual real fluid contribution,
, and is expressed by Equation (9):
(9)
(9) where
is the Helmholtz energy (dimensionless);
is the inverse reduced temperature (dimensionless);
is the reduced density (dimensionless);
represents temperature (K);
is the fluid density (kg/m3);
is the critical temperature of H2S (K); and
is the critical density of H2S (kg/m3).
(10)
(10)
(11)
(11) where
,
,
,
,
,
,
and
are non-analytic coefficients (dimensionless).
The SU-EOS is valid for temperatures from the triple point temperature (187.67 K) to 760 K at pressures up to 170 MPa based on selected experimental data for PρT, caloric and saturation properties. The predicted results with smooth behavior calculated by the model are verified by experimental thermodynamic property data of H2S in the fluid phase. Taking H2S density as an example, the maximum uncertainty of density is below 0.7%.
This research uses the prediction equation for viscosity and thermal conductivity of H2S that was proposed by Chung et al. (Citation1988) and summarized by Reid et al. (Citation1987).
2.3.3. Properties equations of high H2S content sour gas
Sour gas compressibility factors were calculated by combining the Dranchuk–Purvis–Robinson (DPR) model and the Dranchuk–Abu–Kassem (DAK) model along with the Wichert–Aziz (WA) method (Guo et al., Citation2008). Additionally, a fully predictive method due to Galliero et al. (Citation2010) was applied for the calculation of sour gas viscosity.
2.3.4. Solubility of H2S and CH4
Currently, water-based drilling fluids are usually used for sour gas reservoirs. Water-based drilling fluids are mainly made up of fresh water or brine, bentonite and a small amount of other chemical agents. In this drilling fluid, fresh water or salt water are the most important components. Therefore, a thermodynamic model (Duan et al., Citation2007) calculating the solubility of H2S with high prediction accuracy in pure water and in aqueous NaCl solutions (0–6 M, 273–500 K, 0–200 bar) is adopted to analyze the dissolution characteristics of H2S and CH4 in water-based drilling fluids. Compared with the experimental data, the prediction uncertainty of H2S solubility from this model is below 7%.
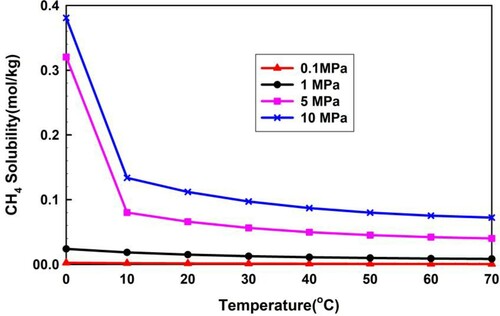
As is known, CH4 is the major part of conventional natural gas. For differentiating the dissolution characters between H2S and CH4, the previously published model of Duan and Mao (Citation2006) is used to calculate CH4 solubility in pure water and aqueous NaCl solutions. The model is valid for the temperature range 273–523 K, pressure up to 200 MPa and salt concentration range 0–6 mol·kg−1. The approximate uncertainties of properties calculated with the model are verified by experimental data.
Figures and show the calculated solubility of H2S and CH4 in pure water using the Duan's model. The solubility amount of H2S is much more than that of CH4, which could put at risk well control operation.
Figure 3. Calculated H2S solubility in pure water using the Duan model.
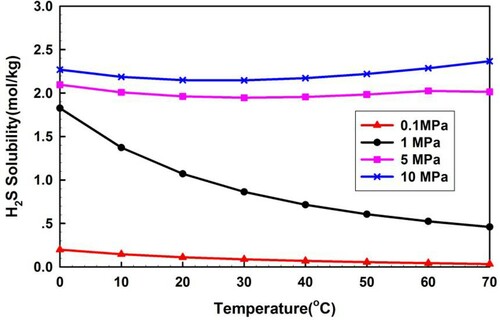
Figure 4. Calculated CH4 solubility in pure water using the Duan model.
2.3.5. Formation percolation model
In this article, the sour gas influx rate was estimated from a model proposed by Zeng and Zhao (Citation2008) that used the Forchheimer number to quantify non-Darcy flow accurately in gas reservoirs.
2.3.6. Slip equation
The velocities differ between the gas phase and the liquid phase, which is caused by gravitational effects, referred to as a ‘slip velocity’. The free gas rising velocity proposed by Zuber and Findlay (Citation1965) is presented in Equation (Equation12(13)
(13) ):
(12)
(12) where
is the gas flow velocity (m/s);
is the profile parameter (dimensionless); and
is the gas slippage velocity (m/s).
There are many research articles on the profile parameter and slippage velocity. In this article, we use the relationship of and
presented by Hasan et al. (Citation2010).
3. Model solution and validation
3.1. Initial conditions
Sour gas of high H2S fraction invades the annulus, which changes the single steady-state flow into transient two-phase flow. From the single steady-state flow model and the heat transfer state model for a single drilling fluid within the annulus, the annulus pressure and temperature are determined as the gas influx occurs. Initially, the gas velocity and the gas volume fraction of free gas and dissolved gas equal zero; the volume fraction of the drilling fluid equals one. The drilling fluid velocity is calculated from the flow rate over its annual cross-section area.
3.2. Boundary conditions
Some inlet boundary parameters are known: the wellhead back pressure or the outlet pressure , the drilling fluid flow rate or the pump rate
and the injection temperature
. The pore pressure of the sour gas reservoirs remains constant when kick occurs.
3.3. Solution method
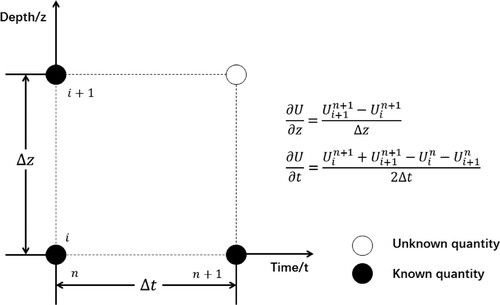
The two-phase flow and heat transfer of the gas–liquid phase are calculated along with mixed fluid properties. There are no closed form solutions for the Equations (1)–(8), which are nonlinear. Thus, the nonlinear equations are solved by a finite difference method with an implicit algorithm as shown in Figure . The difference format has second-order accuracy to meet the simulation requirements. Based on the slip equation, the sour gas front is tracked in order to divide the interface between the two-phase flow and the single-phase flow. Simulations are run on well depths from the bottom to the top of the wellbore.
Figure 5. Demonstration of the pace mesh and the time step for finite difference equations.
It is worth noting that the physical properties of drilling fluids, such as density, viscosity, etc. are constant during the sour gas invasion. The dissolved gas velocity is equal to the drilling fluid velocity. The sum of the two velocities is the liquid phase velocity.
The flow quantities within the wellbores are determined at time n. The solution procedures are given for the transient flow during sour gas influx from node i to node i + 1 in a time range n to n + 1.
(1) At time n + 1, assumptions of the BHP and bottom-hole temperature
are given and the influx rate of the sour gas
is calculated based on the formation percolation model.
(2) At node i + 1 and time n + 1, the pressure and temperature are assumed to be and
, respectively. The physical parameters of the sour gas are then calculated by the EOS.
(3) At node i + 1 and time n + 1, the volume fraction of the sour gas is assumed to be . The velocities of liquid and free gas are calculated by the solubility equation and the continuity conservation equation.
(4) Re-calculate the volume fraction of the sour gas by the drift-flux model. If
then go to the next step, or otherwise return to step (3).
(5) A new pressure is calculated based on the momentum conservation equation using existing parameters. A new temperature
is calculated based on the energy conservation equations. If
and
and flow quantities at node i + 1 are present, continue to calculate the next node i + 2. If not, return to step (2) until the calculation accuracy is high enough.
(6) Continue the calculation using the previous solution procedures until the node reaches the wellhead. Using boundary conditions (the wellhead back pressure at the exit of the annulus and the drilling fluid injection temperature
are known) to judge its convergence. If
and
and the flow quantities at time n+1 as known amounts, continue to calculate the next time i + 2. Otherwise return to step (1).
3.4. Model validation
Sour gas of high sulfur fraction was added to the existing two-phase flow experiments, which had not been studied before owing to its high toxicity. In the two-phase flow experiments, air or N2 and water were mostly combined, followed by a less-used air/kerosene combination. Previously, flow experiments in wellbores coupled with reservoirs were not observed to realize the dynamic two-phase transient flow test. We therefore compared our model with quasi-transient state flow influx experiment results at constant flow rate reported by Lage and Time (Citation2002), who performed full-scale experiments in a vertical research wellbore. This vertical well consisted of a 177.8 mm Outside Diameter (OD) casing (Inner Diameter (ID) = 159.4 mm) and an 88.9 mm OD drilling string (ID = 70.2 mm), which was placed at the bottom of the well to a depth of 1275 m. Compressed N2 and fresh water were pumped to generate the two-phase mixtures. The gas rate ranged from 0.142 to 0.472 m3/s, and the liquid rate ranged from 0.002,52 to 0.003,78 m3/s.
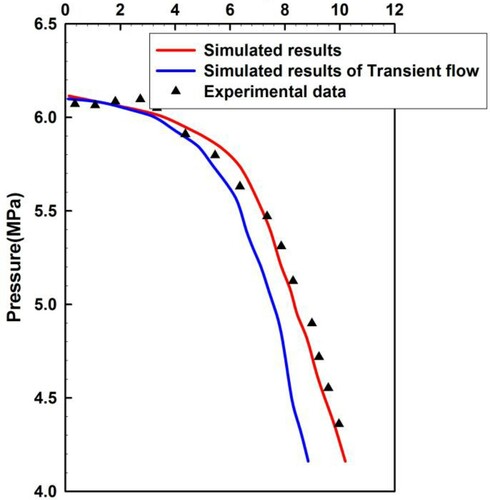
In comparison to experiments, the simulations set a constant invasion rate of two-phase mixtures that comprised CH4 and fresh water. In contrast, transient flow in the annulus coupled with gas reservoirs seepage flow was also simulated. Figure shows a comparison between the simulated results and the experimental data for the annulus pressure. Figure shows a comparison between the measured data and the simulated results for the annulus pressure varying with rising time. From the two figures, the simulated results have a better agreement with the experimental data. However, the annulus pressure in the simulated results for transient flow is significantly lower than measured data, and the pressure drops faster in the simulated results for transient flow. This is because it had been assumed that the gas injection velocity was constant in the transient flow experiment (the triangular points in Figures and ) and simulation (the red curves in Figures and ). The gas invasion speed increases with the decrease of bottom-hole pressure in the simulation. Thus the annulus pressure is lower than the measured data, and the pressure declines faster. This phenomenon agrees with the real case of wellbore overflow. Hence, the investigation of transient flow coupled with gas reservoir seepage flow in wellbores is a crucial step for better well control and design, especially for high H2S content sour gas kicks.
Figure 6. Demonstration of the annulus pressure from measurements and simulations.
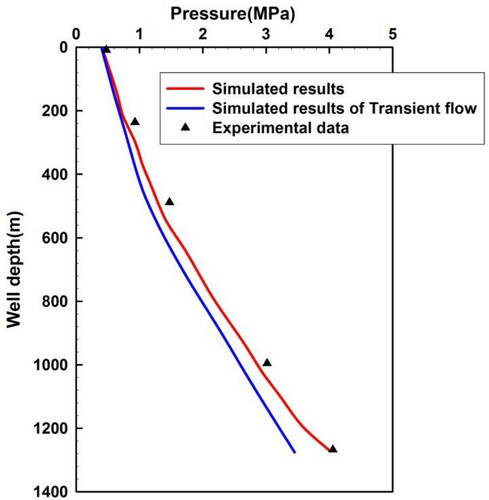
Figure 7. Demonstration of the annulus pressure from measurements and simulations, which vary with rising time.
4. Calculations and results
Transient flow and well control were analyzed using the proposed model, which was based on the field drilling parameters of the G44–9 well in the Ordos Basin, China. Table is a group of basic parameters applied to simulations for these cases.
Table 2. Basic data of well G44–9.
4.1. Transient flow behavior in wellbores
Figure shows the annulus temperature distribution when the gas influx moves up to the wellhead. This is calculated by the proposed numerical solution for high H2S content sour gas and CH4 influx. The highest temperature is not at the bottom of the well. The temperature of drilling fluid is relatively low while it flows from the inside of drilling bits, and this temperature will significantly increase when it encounters the high-temperature formation, and the fluid temperature in the annulus will thus increase as well. As the drilling fluids and invaded gas flow upwards, the formation temperature will gradually decrease, which leads to the reduction of fluid temperature in the annulus. The heat transfer from annulus fluid to formation occurs while the fluid temperature is higher than the formation temperature in the upper part of the annulus. Thus, the temperature of the annulus mixed fluids is generally lower than the earth temperature, but it is higher than the earth temperature when the mixed fluids are near the wellhead. The annulus temperature slightly increases with the decrease of H2S fraction of sour gas as the mixed fluid flows upwards to the wellhead. The differences of annulus temperature are probably caused by the increasing heat from the greater invaded fluid rate, and less exchange time due to a larger annulus flow rate when the H2S content in the sour gas decreases.
Figure 8. Annulus temperature distribution for acid gas with different H2S content when the invaded gas moves up to the wellhead.
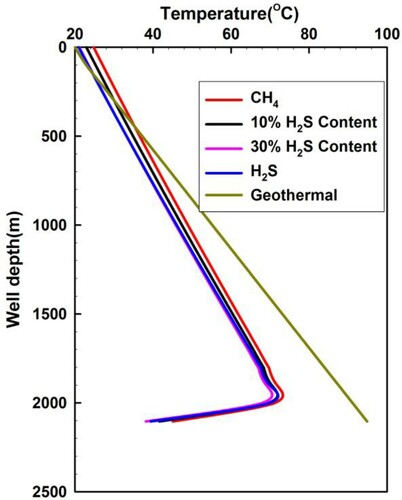
Figure illustrates the annulus pressure distribution generated by sour gas with different H2S concentrations when the invaded gas front arrives at the wellhead. The wellbore pressure profile without gas intrusion is also given for comparison. The annulus pressure increases with increasing fraction of H2S in the sour gas. As the H2S concentration increases, the free gas mass rate decreases owing to the greater H2S solubility and the increase in the density of free gas. These factors lead to an increase in the pressure gradient of the two-phase flow as the H2S fraction increases. It is worth noting that a phase transition of H2S occurs near the wellhead owing to the decline of temperature and pressure as shown in Figure . This phenomenon of phase transition is observed in . When the pure H2S moves up along the wellbore, a single-phase flow occurs before the occurrence of the phase change, followed by a two-phase flow after the phase transition near the wellhead. This transition results in a significant drop of annulus pressure as shown in Figure .
Figure 9. Annular pressure distribution for acid gas with different H2S content when the invaded gas moves up to the wellhead.
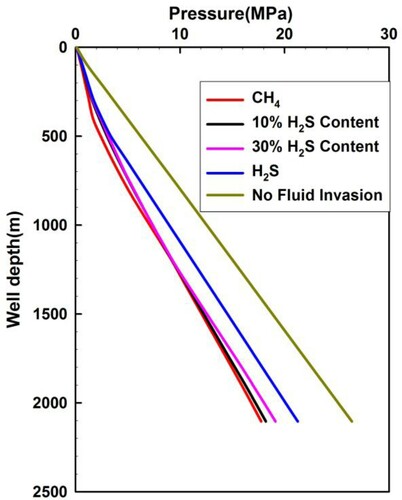
Figure illustrates the annulus pressure profiles of sour gas with different H2S concentrations. At any depth above 700 m, the wellbore pressures are the same because only the drilling fluid flows. Below this depth, the wellbore pressures increase with increasing H2S concentrations, which is similar to the case in Figure . From Figure , the annulus pressure during pure H2S gas influx remains almost constant, compared with that without gas influx. This difference indicates that the identification of pure H2S influx is difficult at the initial stage of kick.
Figure 10. Annular pressure distribution for acid gas with different H2S content when the invaded gas front rises to a depth of 700 m from the wellhead.
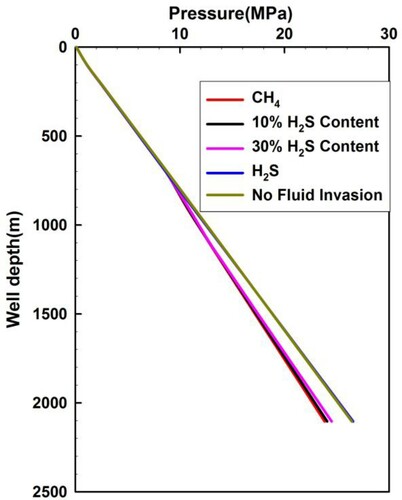
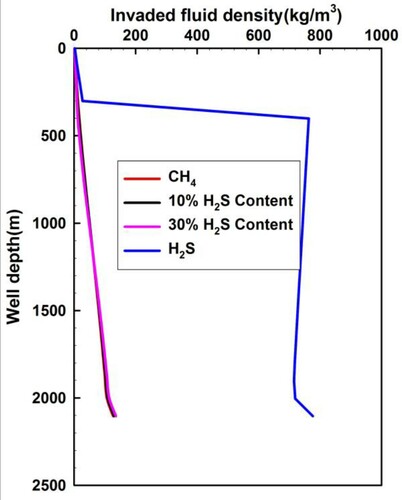
Figure shows the density distribution of the invaded fluids when the gas influx front arrives into the wellhead, which is generated from different H2S concentrations of gas influx. Pure H2S has a significantly larger density than pure CH4. Natural gas contains different concentrations of H2S before the H2S phase transition occurs. The small variation of annulus pressure in Figure is caused by the large density of H2S shown in Figure , which leads to a significant increase in well control risk in the early stage of kick. As the invaded H2S continues to flow upwards, with a decrease of temperature and pressure, the H2S density decreases significantly from 760 kg/m3 to less than 30 kg/m3, but the H2S volume increases dramatically by more than 27 times near the wellhead after the H2S phase transition from liquid phase to gaseous phase in Figure . Figure demonstrates a significant decrease of the pressure within the wellbore. Sour gas with an H2S content of 10 or 30% has a similar density to that of the pure CH4. This is mainly due to the dissolution of the majority of H2S in the sour gas to the mud, which causes the major component of the free sour gas changing to be CH4.
Figure 11. Annular fluid density profiles of acid gas with different H2S content when the invaded gas front rises into the wellhead.
Figures and demonstrate the quantity distributions of free gas and dissolved gas under different H2S concentrations. From Figure , the free H2S quantity is zero in most well sections, except at the bottom of the wellbore and near the wellhead. The zero quantity of free H2S in the wellbore sections is due to the intrusive fluid rate being less than or equal to its solubility. The free H2S quantity in the uppermost section near the wellhead is greater than zero because the H2S solubility decreases, as shown in Figure , and the dissolved gas transitions to free gas. The risk to well control is thus increased with the sudden release of H2S. The free H2S quantity in the lowermost section at the bottom hole is greater than zero because the H2S intrusion flow rate increases beyond its solubility. Figure also illustrates that the mass flow rates of the free CH4 and the sour gas of different H2S concentrations are large. The major component of sour gas is CH4, the solubility of which is much smaller than that of H2S, as shown in Figure . Thus, the quantity of free CH4 and sour gas is significantly large.
Figure 12. Annular mass flow of free gas varying with different H2S content in acid gas when the invaded gas moves up to the wellhead.
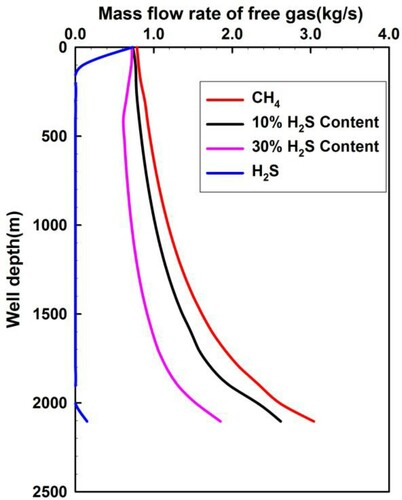
Figure 13. Annular dissolved quantity of invaded fluid varying with different H2S content in acid gas when the invaded gas moves up to the wellhead.
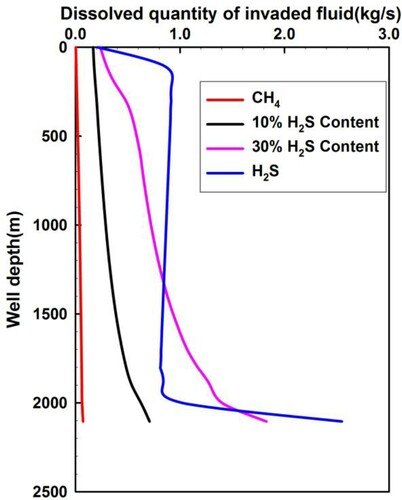
The dissolved quantity of H2S in the invaded fluid, Vdis, is given based on the H2S solubility formula proposed by Duan et al. (Citation2007). The formula for calculating the dissolved quantity of CH4 is given in Equation (13):
(13)
(13) where Vdis is the H2S dissolved quantity (kg/s); SH2S is the H2S solubility in the NaCl solutions (mol/kg); and M is the molar mass of H2S (34 g/mol).
When the invaded quantity is less than the dissolved quantity, the quantity of free gas equals zero. If the quantity of gas influx is greater than the dissolved quantity, the free gas quantity equals the invaded gas quantity minus the dissolved quantity.
Figure presents a much larger dissolved quantity of gas influx containing H2S than that of pure CH4 in the drilling fluids, which implies that the sour gas overflow is not easy to discover early. The dissolved quantity of sour gas with a 30% fraction of H2S is more than that with pure H2S, at the lower part of the wellbore. The reason is that the BHP for sour gas containing 30% H2S is lower than the BHP for pure H2S. Figure illustrates that the dissolved quantity of H2S rapidly reduces when the sour gas moves up to the wellhead, where the annulus pressure has a sharp decline caused by the partially dissolved H2S being converted into free gas.
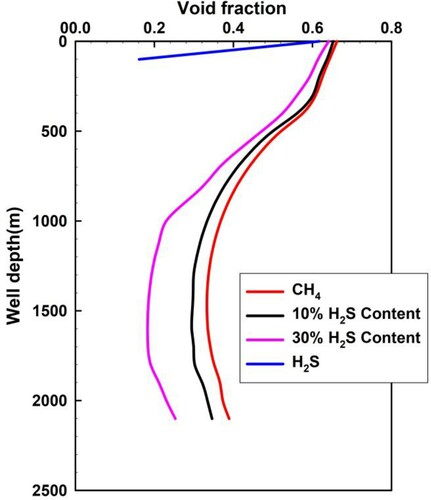
Figure shows the distribution of the gas phase fraction over the whole well depth as the invasion front is at the wellhead. At any depth with a lack of H2S phase change, the H2S void fraction is zero as the H2S is in the liquid state instead of gas. Above this point, H2S is transformed from liquid to gas. The void fraction of the free H2S gas remains at a low level owing to a smaller invasion rate and a relatively large solubility. As shown in Figure , the void fraction decreases with increasing concentration of H2S. This is largely due to the fact that, the higher concentration of H2S, the larger the dissolved quantity of invaded gas. In Figure , the sour gas void fraction in the intermediate part is less that that close to the wellhead. This is due to the considerable volumetric expansion and the decline of solubility, which are generated by the annulus pressure decrease. For the base section, the sour gas void fraction is larger due to the higher influx rate.
Figure 14. Void fraction of free gas as invaded gas moves up to the wellhead.
4.2. Well control analysis
The change of BHP is critical for, and might put at risk, well control operations, and special attention should be paid to this during drilling acid reservoirs. Therefore, BHP variation with increasing gas column and kick time are shown in Figures and , respectively.
Figure 15. BHP varying with invaded sour gas rising height from the bottom hole.
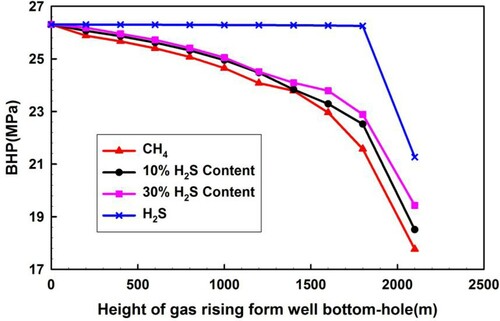
Figure 16. BHP varying with kick time.
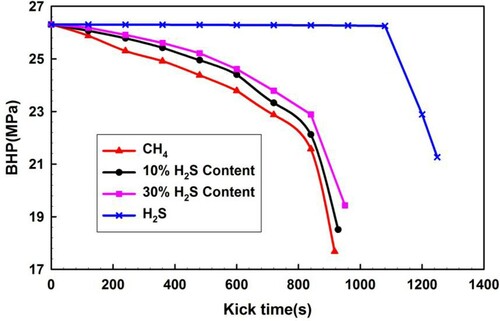
Figure shows that BHP changes with increasing rise in height of gas from the wellbore bottom by surveying gas for varying concentrations of H2S. In all cases, the BHP decreases with increasing height of the invaded fluid front. As the H2S concentration increases, the decline amplitude of BHP significantly decreases. When the invaded pure H2S flows upwards, the BHP remains almost constant at first and this is because the H2S is dissolved in the liquid phase with a higher density. However, it drops significantly after the occurrence of the H2S phase transition near the wellhead as shown in Figure . The sudden drop of the annulus pressure near the wellhead allows a very short operation time window for well control, increasing the risk to well control.
Figure presents that BHP varies with kick time, i.e. the invaded gas ascending time during sour gas kicks with varying H2S fractions. With increasing kick times, the BHP decreases substantially for all cases. The decrease amount of BHP becomes significantly more for CH4 and sour gas containing H2S (10 and 30% fractions) influx. The total time of kicking through all the wellbore significantly decreases for CH4 and sour gas containing H2S, which is less than 1000 s in contrast to pure H2S influx. The BHP drops rapidly initially, which is easily detected when CH4 and sour gas invade into the wellbores. An increase in the H2S fraction of sour gas increases the kick time.
For pure H2S influx, the total kick time is evidently longer than 1200 s, and for the initial 1100 s the BHP is almost constant. The BHP drops sharply by more than 5 MPa within 180 s near the wellhead. The shut-in operation seems not possible in such a short period of time, which results in a blowout.
As the H2S phase transition occurs near the wellhead, significant volumetric expansion is determined in Figure and a sharp BHP decrease is determined from Figures and . These changes significantly increase the risk to well control. The operation response time for well control is so short that serious well control incidents may be induced. Therefore, much attention should be paid to this situation.
The main parameters affecting well control safety, especially BHP during the formation H2S and CH4 influx, are analyzed in order to optimize drilling designs and well control solutions. In this subsection, geological and engineering factors dependently affecting BHP are studied, including wellhead back pressure, drilling fluid flow rate, the pressure difference between the formation and the wellbore, reservoir open thickness and drilling fluid injection temperature. They are studied changing only one parameter at a time around the normal operating parameters, which are presented in Table . Their different influences on BHP could be inferred explicitly.
4.2.1. Wellhead back pressure
Figure illustrates the BHP curves during the influx of H2S and CH4 with different wellhead back pressures (0.1, 1, 2, 3, 4 MPa), when the initial pressure difference remains constant. BHP increases significantly as the wellhead back pressure builds up, and BHP increases by 6.0 MPa for H2S invasion and by 7.6 MPa for CH4 invasion as the wellhead back pressure increases by 3.9 MPa. As shown from the figure, the wellhead back pressure could effectively control the annulus pressure.
Figure 17. BHP variation with different wellhead back pressures.
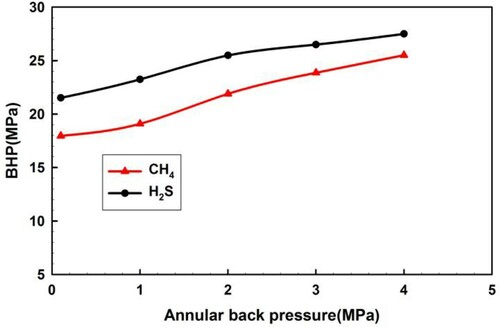
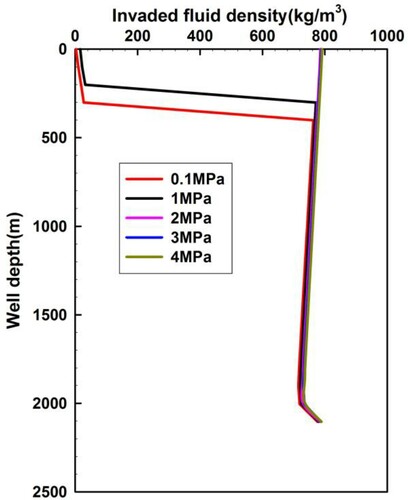
H2S phase transition only occurs near the wellhead when the wellhead back pressure remains below 2 MPa, and the density of H2S drops drastically, as shown in Figure . No phase transition occurs when the wellhead back pressure is no less than 2 MPa. Therefore, the wellhead back pressure dictates the H2S phase transition. A wellhead back pressure of more than 2 MPa is recommended in the process of drilling sour gas reservoirs, which aims to restrain the sudden expansion of sour gas near the wellhead.
Figure 18. Annular density profiles for H2S influx varying with wellhead back pressure.
4.2.2. Initial pressure difference
The initial pressure difference equals the reservoir pore pressure minus the BHP. Figure shows the BHP curves during the influx of H2S and CH4 with different initial pressure differences (0, 1, 2, 3, 4, 5 MPa). The BHP during CH4 influx first drops significantly, then a minimum is reached, and it slowly increases with increasing initial pressure difference. This difference has a more pronounced influence over the BHP during CH4 influx than that during H2S influx, though a similar tendency exists in both cases. The sharp decrease of the initial BHP is caused by the increasing invaded gas rate from the reservoirs, according to the formation percolation model. Later, there is a minor increase of BHP, which is generated by a great increase in the friction pressure within the two-phase flow. This results from a high invasion rate and gas expansion.
Figure 19. BHP variation with different initial pressure differences.
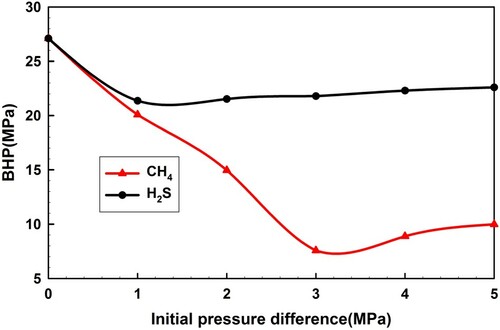
A more accurate prediction of the formation pressure gradient and precise Equivalent Circulation Density (ECD) control, which can reduce the initial pressure difference, have a determining impact on well control safety.
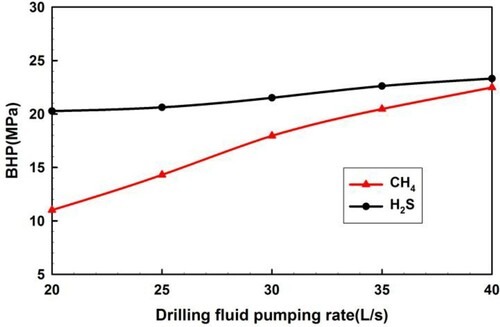
4.2.3. Drilling fluid flow rate and injection temperature
Figure demonstrates the BHP variation curves with different drilling fluid flow rates (20, 25, 30, 35, 40 L/s) at a constant initial pressure difference. This indicates an increase in BHP with an increase in drilling fluid flow rate. The BHP variation is explained by the fact that a larger flow rate contributes to an increase in the annulus area occupied by the drilling fluid. The drilling fluid flow rate has a greater influence on BHP during CH4 influx than during H2S influx.
Figure 20. BHP variation with different drilling fluid flow rates.
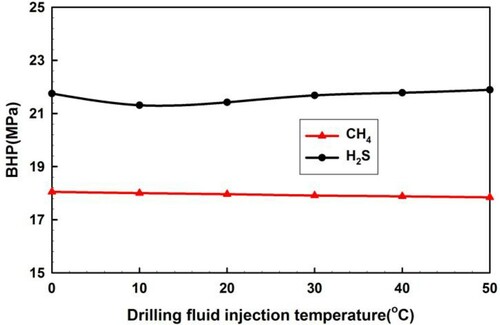
The drilling fluid injection temperature has little effect on BHP during the gas kick, as shown in Figure .
Figure. 21. BHP variation with different drilling fluid injection temperatures.
4.2.4. Reservoir open thickness
Figure presents the BHP curves during H2S and CH4 influxes with different reservoir open thicknesses (0, 1, 3, 5, 7, 9 m). During the CH4 influx, the initial pressure difference influences the trend of BHP, which is similar to the influence caused by the reservoir open thickness. The BHP variation trend is affected by the reservoir open thickness during CH4 influx, which is similar to the influence generated by the initial pressure difference.
Figure 22. BHP variation with different reservoir open thicknesses.
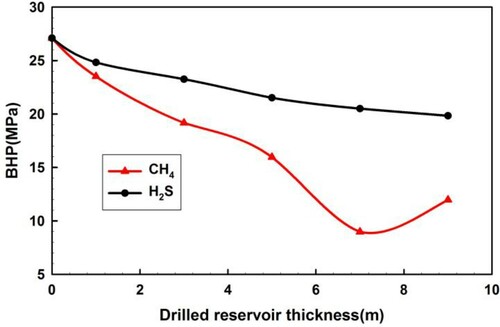
BHP decreases with increasing reservoir open thickness; the decrease of BHP from H2S influx is much smaller than that from CH4 influx.
A sensitivity analysis was conducted to evaluate the factors that influence BHP. This analysis could provide guidelines for drilling operations and well control designs in sour gas reservoirs.
5. Conclusions
This article successfully establishes a two-phase flow model for the transient state and studies sour gas kick having a large H2S fraction. In simulations, the transient flow is coupled with the formation percolation model; two-phase flow and heat transfer are simulated along with mixed fluid properties. The solubility of H2S and CH4 in water-based drilling fluids and the phase transition of H2S are considered in the research. The model is successfully verified by full-scale experimental data. Well control risk is evaluated considering the geological and engineering factors separately.
(1) As the mixed fluids flow upwards, their annulus pressure increases but the annulus temperature slightly decreases with increasing H2S fraction in the sour gas.
(2) H2S changes from liquid to gas as the invaded fluid front moves up along the wellbore. The density of pure H2S is significantly larger than that of pure CH4 gas and natural gas having different H2S concentrations before H2S phase transition occurs, whereas the H2S density decreases significantly and its volume increases dramatically by more than 27 times after phase transition occurs. The sudden drop of annulus pressure results from the phase transition of H2S when it moves close to the wellhead. This pressure drop gives a very short window of opportunity for well control operations, increasing the risk to well control.
(3) The quantity of free H2S is zero in most wellbore sections, except at the bottom of the wellbore and near the wellhead. The dissolved quantity of invaded gas with H2S is much more than that with CH4, which implies that sour gas overflow will not be easily discovered at an early stage of kick.
(4) Below the well depth of the H2S phase transition, the void fraction of H2S is zero, which is in a liquid state rather than a gaseous state. Above this depth, H2S changes from liquid to gas, which implies two-phase flow. An increase in the H2S fraction of sour gas decreases the void fraction, which is caused by a large quantity of dissolved H2S.
(5) In generally, BHP decreases for the following two reasons: the invaded fluid front moves up from the bottom of the well as the kick time elapses, whereas pure H2S has an abrupt decline near the wellhead. As the H2S content decreases, the declining amplitude of BHP significantly increases and the total kick time reduces.
(6) The proper control of wellhead back pressure can prevent the occurrence of H2S phase transition and reduce the risk of sour gas kick. A wellhead back pressure higher than 2 MPa is recommended to restrain the sudden expansion of sour gas near the wellhead.
(7) When CH4 influx occurs, BHP drops sharply, which then reaches a minimum point, but later increases slowly with an increase in the initial pressure difference. There is a greater influence of the BHP from this pressure difference during CH4 influx than during H2S influx. There is a similar tendency for both influxes. The trend of BHP variation affected by reservoir open thickness during CH4 influx is similar to the effect caused by the initial pressure difference. There is a decrease of BHP during H2S influx with an increase in reservoir open thickness.
(8) BHP increases with a rise in drilling fluid flow rate. The drilling fluid injection temperature has little influence on BHP during a gas kick.
This article does not consider the effect of cutting particles and the rotation of the drill string on the gas–liquid flow. These two factors might impact the recognition of the gas–liquid flow types and the accuracy of pressure drop in multi-phase calculations. There is a lack of previous publications on this topic, which is to be investigated in following research.
Abbreviations
| H2S | = | Hydrogen Sulfide |
| CH4 | = | Methane |
| CO2 | = | Carbon Dioxide |
| MPD | = | Managed Pressure Drilling |
| BHP | = | Bottom-Hole Pressure |
| EOS | = | Equation of State |
| SU-EOS | = | Sakoda and Uematsu Equation Of State |
| DPR | = | Dranchuk–Purvis–Robinson |
| DAK | = | Dranchuk–Abu–Kassem |
| WA | = | Wichert–Aziz |
| N2 | = | Nitrogen |
| OD | = | Outside Diameter |
| ID | = | Inner Diameter |
| ECD | = | Equivalent Circulation Density |
| PDC | = | Polycrystaline Diamond Compact |
Disclosure statement
No potential conflict of interest was reported by the authors.
Additional information
Funding
References
- Abadi, A. M., Sadi, M., Farzaneh-Gord, M., Ahmadi, M. H., Kumar, R., & Chau, K. (2020). A numerical and experimental study on the energy efficiency of a regenerative heat and mass exchanger utilizing the counter-flow Maisotsenko cycle. Engineering Applications of Computational Fluid Mechanics, 14(1), 1–12. https://doi.org/https://doi.org/10.1080/19942060.2019.1617-193
- Al-Jaberi, J., Al-Azani, K., & Fraim, M. (2017, April 24–27). Calculation of sulfur deposition in gas condensate wells in Middle East. SPE Kingdom of Saudi Arabia Annual Technical Symposium and Exhibition, Dammam, Saudi Arabia, Paper No. SPE 188000.
- Ambrus, A., Aarsnes, U. J., Vajargah, A. K., & Van Oort, E. (2015, December 6–9). A simplified transient multi-phase model for automated well control applications. International Petroleum Technology Conference, Doha, Qatar, Paper No. IPTC 18481.
- Avelar, C. S., Ribeiro, P. R., & Sepehrnoori, K. (2009). Deepwater gas kick simulation. Journal of Petroleum Science and Engineering, 67(1-2), 13–22. https://doi.org/https://doi.org/10.1016/j.petrol.2009.03.001
- Chen, N. H. (1979). An explicit equation for friction factor in pipe. Industrial & Engineering Chemistry Fundamentals, 18(3), 296–297. https://doi.org/https://doi.org/10.1021/i160071a019
- Choe, J., Schubert, J., & Juvkam-Wold, H. (2005). Well-control analyses on extended-reach and multilateral trajectories. SPE Drilling & Completion, 20(2), 101–108. https://doi.org/https://doi.org/10.2118/97465-PA
- Chung, T. H., Ajlan, M., Lee, L. L., & Starling, K. E. (1988). Generalized multiparameter correlation for nonpolar and polar fluid transport properties. Industrial & Engineering Chemistry Research, 27(4), 671–679. https://doi.org/https://doi.org/10.1021/ie00076a024
- Dou, L. B., Li, G. S., Shen, Z. H., Huang, Z., & Song, X. Z. (2013). Study on the wellbore flow and phase transition during formation H2S invasion. International Journal of Oil, Gas and Coal Technology, 6(6), 658–674. https://doi.org/https://doi.org/10.1504/IJOGCT.2013.056666
- Dou, L. B., Li, G. S., Shen, Z. H., Song, X. Z., Du, T., & Chi, H. P. (2012, July 9–11). Study on the well control safety during formation high-sulfur gas invasion. IADC/SPE Asia Pacific Drilling Technology Conference and Exhibition, Tianjin, China, Paper No. SPE 156322.
- Dou, L. B., Sun, H. B., Bai, J., & Wang, R. (2021). Study on characteristics of wellbore transient flow during formation high-content CO2 acid gas influx. Fresenius Environmental Bulletin, 30(2), 1501–1510. (In Press)
- Dou, L. B., Zhang, M., Bi, G., & Li, T. T. (2019). Transient flow in wellbores and phase transition of CO2 during formation supercritical CO2 invasion. Energy Science & Engineering, 7(2), 323–337. https://doi.org/https://doi.org/10.1002/ese3.256
- Duan, Z. H., & Mao, S. D. (2006). A thermodynamic model for calculating methane solubility, density and gas phase composition of methane-bearing aqueous fluids from 273 to 523 K and from 1 to 2000 bar. Geochimica et Cosmochimica Acta, 70(13), 3369–3386. https://doi.org/https://doi.org/10.1016/j.gca.2006.03.018
- Duan, Z. H., Sun, R., Liu, R., & Zhu, C. (2007). Accurate thermodynamic model for the calculation of H2S solubility in pure water and brines. Energy & Fuels, 21(4), 2056–2065. https://doi.org/https://doi.org/10.1021/ef070040p
- Galliero, G., Boned, C., Baylaucq, A., & Montel, F. (2010). High-pressure acid-gas viscosity correlation. SPE Journal, 15(3), 682–688. https://doi.org/https://doi.org/10.2118/121484-PA
- Ghalandari, M., Bornassi, S., Shamshirband, S., Mosavi, A., & Chau, K. (2019). Investigation of submerged structures’ flexibility on sloshing frequency using a boundary element method and finite element analysis. Engineering Applications of Computational Fluid Mechanics, 13(1), 519–528. https://doi.org/https://doi.org/10.1080/19942060.2019.1619197
- Guo, X., Du, Z. M., Yang, X. F., & Fu, D. K. (2008). A calculating model for gas deviation coefficient of sour gas reservoirs. Naural Gas Industry, 25(4), 89–92. (In Chinese)
- Hasan, A. R., Kabir, C. S., & Sayarpour, M. (2010). Simplified two-phase flow modeling in wellbores. Journal of Petroleum Science and Engineering, 72(1-2), 42–49. https://doi.org/https://doi.org/10.1016/j.petrol.2010.02.007
- He, S. (2008). Development engineering technology of natural gas field with high-hydrogen sulfide and carbon dioxide. China Petrochemical Press.
- He, M., Xu, M. B., Li, J., & Liu, G. H. (2017). A new two-phase model to simulate sour gas kicks in MPD operations with water based mud. Journal of Petroleum Science and Engineering, 159(159), 331–343. https://doi.org/https://doi.org/10.1016/j.petrol.2017.09.024
- Huse, J. R., & He, S. (2010, April 12–14). CDF models applied to optimize safe designog huge gas field developments with high H2S content. SPE International Conference on Health, Safety and Environment in Oil and Gas Exploration and Production, Rio de Janeiro, Brazil, Paper No. SPE 126244.
- Kabir, C. S., Hasan, A. R., Kouba, G. E., & Ameen, M. (1996). Determining circulating fluid temperature in drilling, workover, and well control operations. SPE Drilling & Completion, 11(2), 74–79. https://doi.org/https://doi.org/10.2118/24581-PA
- Lage, A. C., Fjelde, K. K., & Time, R. W. (2003). Underbalanced drilling dynamics: Two-phase flow modeling and experiments. SPE Journal, 8(1), 61–70. https://doi.org/https://doi.org/10.2118/83607-PA
- Lage, A. C., & Time, R. W. (2002). An experimental and theoretical investigation of upward two-phase flow in annuli. SPE Journal, 7(3), 325–336. https://doi.org/https://doi.org/10.2118/79512-PA
- Nickens, H. (1987). A dynamic computer model of a kicking well. SPE Drilling Engineering, 2(2), 159–173. https://doi.org/https://doi.org/10.2118/14183-PA
- Perez-Tellez, C., Smith, J. R., & Edwards, J. K. (2003). A new comprehensive, mechanistic model for underbalanced drilling improves wellbore pressure prediction. SPE Drilling & Completion, 18(3), 199–208. https://doi.org/https://doi.org/10.2118/85110-PA
- Reid, R. C., Prausnitz, J. M., & Poling, B. E. (1987). The properties of gases and liquids. Fourth Edition McGraw-Hill.
- Sakoda, N., & Uematsu, M. (2004). A thermodynamic property model for fluid phase hydrogen sulfide. International Journal of Thermophysics, 25(3), 709–737. https://doi.org/https://doi.org/10.1023/B:IJOT.0000034234.06341.8a
- Salih, S. Q., Aldlemy, M. S., Rasani, M. S., Ariffin, A. K., Ya, T., Al-Ansari, N., Yaseen, Z. M., & Chau, K. (2019). Thin and sharp edges bodies-fluid interaction simulation using cut-cell immersed boundary method. Engineering Applications of Computational Fluid Mechanics, 13(1), 860–877. https://doi.org/https://doi.org/10.1080/19942060.2019.1652209
- Santos, O. L. (1991). Well-control operations in horizontal wells. SPE Drilling Engineering, 6(2), 111–117. https://doi.org/https://doi.org/10.2118/21105-PA
- Shi, X. B., Gan, Y. F., Zhong, S. Q., Xiong, J. Y., & Zhang, S. Q. (2008). Study on hydrogen sulfide gas cutting in high sulfur geological environment. Acta Petrolei Sinica, 29(4), 601–604. (In Chinese)
- Sun, B. J., Gong, P. B., & Wang, Z. Y. (2013). Simulation of gas kick with high H2S content in deep well. Journal of Hydrodynamics, 25(2), 264–273. https://doi.org/https://doi.org/10.1016/S1001-6058(13)60362-5
- Sun, B. J., Song, R. R., & Wang, Z. Y. (2012). Overflow behaviors of natural gas kick well with high content of H2S gas. Journal of China University Petroleum, 36(1), 73–79. (In Chinese)
- Udegbunam, J. E., Fjelde, K. K., Evje, S., & Nygaard, G. (2015). On the advection-upstream-splitting-method hybrid scheme: A simple transient-flow model for managed-pressure-drilling and underbalanced-drilling applications. SPE Drilling & Completion, 30(2), 98–109. https://doi.org/https://doi.org/10.2118/168960-PA
- Vajargah, A. K., & Van Oort, E. (2015). Early kick detection and well control decision-making for managed pressure drilling automation. Journal of Natural Gas Science and Engineering, 27(1), 354–366. https://doi.org/https://doi.org/10.1016/j.jngse.2015.08.067
- Xu, Z. M., Song, X. Z., Li, G. S., Wu, K., Pang, Z. Y., & Zhu, Z. P. (2018). Development of a transient non-isothermal two-phase flow model for gas kick simulation in HTHP deep well drilling. Applied Thermal Engineering, 78, 1055–1069. https://doi.org/https://doi.org/10.1016/j.applthermaleng.2018.06.058
- Yuan, P. (2006). Supercritical fluid phase change and well control in high H2S/CO2 gas drilling [Master’s Thesis]. Southwest Petroleum University.
- Zeng, F. H., & Zhao, G. (2008). Semianalytical model for reservoirs with Forchheimer’s Non-Darcy flow. SPE Reservoir Evaluation & Engineering, 11(2), 280–291. https://doi.org/https://doi.org/10.2118/100540-PA
- Zhang, Z., Fu, J. H., Lin, Y. H., Shi, T. H., Fan, H. K., Xia, B., & Zhang, J. C. (2010, June 8–10). The mechanism of pressure control problem in high H2S/CO2 gas wells. CPS/SPE International Oil & Gas Conference and Exhibition, Beijing, China, Paper No. SPE 130143.
- Zhou, H. (2017). Research on experiment of sulfur deposition and solubility of PX gas reservoir [Master’s Thesis]. Southwest Petroleum University.
- Zhu, G. Y., Zhang, S. C., Li, J., & Jin, Q. (2004). Formation and distribution of hydrogen sulfide bearing gas in China. Petroleum Exploration and Development, 31(3), 18–20. (In Chinese)
- Zuber, N., & Findlay, J. A. (1965). Average volumetric concentration in two-phase flow systems. Journal of Heat Transfer, 87(4), 453–468. https://doi.org/https://doi.org/10.1115/1.3689137