
 ?Mathematical formulae have been encoded as MathML and are displayed in this HTML version using MathJax in order to improve their display. Uncheck the box to turn MathJax off. This feature requires Javascript. Click on a formula to zoom.
Abstract
We investigated the effects of atherosclerosis in the carotid region on cerebral haemodynamics. A total of 15 stenosis cases following NASCET criteria were modelled using patient-specific medical image data and an open-source package, SimVascular. The formulation adopted the stabilised Petrov–Galerkin scheme with Newtonian and incompressible assumptions. The boundary conditions employed pulsatile inflow and three-element lumped Windkessel outlet conditions with a rigid wall assumption. We present transitions in the represented CoW during stenosis progression using three-dimensional aortic-cerebral vasculature for the first time. This was driven by the conserved total cerebral blood flow to 50% carotid stenosis (CS) (P-value, P > 0.05), which deteriorated during subsequent stages of CS (P < 0.01), and the effective collateral capability of the communicating arteries (CoAs) activated from a degree of 75% and above (P < 0.0001). The prevalence of ‘complete’ CoW peaked at 50% CS and then declined. Despite the collateral flow, the ipsilateral hemispheric perfusion was moderately reduced (P < 0.01), and the contralateral perfusion was conserved (P > 0.05), revealing the ineffectiveness of collateral capability of CoW at the extreme stages of CS. We identified bulk cerebral auto-regulation effects of the conventional Windkessel model, demonstrating accurate flow reduction in the stenosed artery.
Nomenclature
1. Introduction
The circle of Willis (CoW) is a principal collateral structure that maintains cerebral circulation in response to brain ischaemia, mainly caused by carotid stenosis (CS). The posterior communicating artery (PCoA) and anterior communicating artery (ACoA) serve as collateral links between the anterior and posterior cerebral circulation while reducing the incidence of stroke and transient ischaemic attack (TIA) in both long-term and perioperative follow-up periods (Henderson et al., Citation2000; Zhou et al., Citation2016). Incomplete CoW is present in approximately 50–79% of the population (Alpers et al., Citation1959; Kapoor et al., Citation2008; Lippert & Pabst, Citation1985; Papantchev et al., Citation2013; Riggs & Rupp, Citation1963) adopting various forms and causing issues such as anterior circulation (Henderson et al., Citation2000) and lacunar infarctions (Chuang et al., Citation2008). One important finding is that PCoA hypoplasia is asymptomatic without ipsilateral internal carotid artery (iICA) stenosis (Schomer et al., Citation1994), but is also a risk factor even without the iICA stenosis (Chuang et al., Citation2008). This highlights the importance of a more comprehensive study; other confusions also arise: a higher degree of CS is related to the presence of more collaterals (Adams et al., Citation1999; Hoksbergen et al., Citation2000; Miyazawa et al., Citation2011; Morgenstern et al., Citation1997) but patients with more collaterals had better 90-day (Zhou et al., Citation2016) and long-term prognoses (Henderson et al., Citation2000; Kim et al., Citation2016). The above correlations, however, are reversed in asymptomatic cases as collaterals are less present in such cases than in the symptomatic cases (Hendrikse et al., Citation2001), with the former experiencing lower benefit from medical intervention (Halliday, Citation2004; Moneta et al., Citation1993; Rothwell et al., Citation1994) implying favorable clinical outcomes even with fewer collaterals. Such contradicting findings may be due to the complexity involved in analyzing the complex anatomy of the individual arterial network in conventional medical approaches and the challenge involved in the patient-specific tracking of CS progression. Alternatively, the correlation between CoW variation and CS is not yet fully understood, as a review (Chatzikonstantinou et al., Citation2012) suggested that patient-specific follow-up in short time windows is a better clinical approach.
Such complexities have led to various engineering efforts being made, based on both mathematical and experimental techniques. For simplicity, we defined ‘one-dimensional or three-dimensional’ and ‘chin-to-head or aorta-to-head domain’, where the ‘chin-to-head’ and ‘aorta-to-head’ domains were defined as the ICA-to-CoW domain and aortic-cerebral vasculature (ACV), respectively. Although specific cardiovascular conditions such as the occlusion of arteries (Alastruey et al., Citation2007; Liu et al., Citation2016; Long et al., Citation2008; Ryu et al., Citation2015) and vasospasm (Ryu et al., Citation2017) have been considered, progressive haemodynamic changes in three-dimensional aortic-cerebral vasculature have not been studied in a patient-specific, large domain (Table ). Some major limitations of previous studies are as follows: (1) previous studies were unable to describe complex three-dimensional haemodynamic phenomena throughone-dimensional analyses (Alastruey et al., Citation2007; Ryu et al., Citation2015), (2) a limited coverage of the arterial domain (ICA-to-CoW) was considered in three-dimensional studies (Alnæs et al., Citation2007; Long et al., Citation2008; Mukherjee et al., Citation2018; Zhu et al., Citation2015a), and (3) the complex physical nature of blood flow was disregarded in CS-correlative clinical or statistical approaches. As suggested in a recent review (Liu et al., Citation2020), once a large-domain study integrates a three-dimensional simulation and CS, the effects of progressive CS on the flow in the CoW may effectively be captured (Figure ).
Figure 1. A, CTA segments in sagittal plane of patient model, P1. B, Volume-rendered image of CTA image of P01. C, Schematic of the simulation model. The cerebral vasculature (purple box) is seen at the posterior view for outlets of posterior cerebral arteries (PCAs) that are invisible from the anterior view. AsA; ascending aorta, DsA; descending aorta, SA; subclavian artery, CCA; common carotid artery, ECA; external carotid artery, ICA; internal carotid artery, VA; vertebral artery, MCA; middle cerebral artery, ACA; anterior cerebral artery, BA; basilar artery, PCA; posterior cerebral artery, PCoA; posterior communicating artery, ACoA; anterior communicating artery, LSA; lenticulostriate artery.
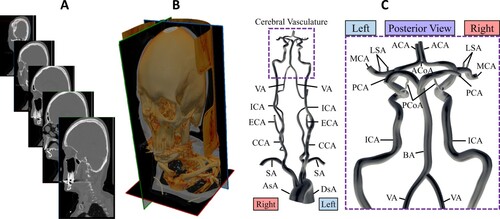
Table 1. Categorical analysis of computational studies.
This study was the first to adopt a three-dimensional arterial domain spanning from ACV to simulate various NASCET-based CS conditions. As a result, the effects of progressive CS on cerebral circulation could be analyzed. Our method enabled automatic flow redistribution among the four major arteries (two ICAs, two VAs) and exhibited collateral behavior different from that of the small cerebral domain (Cassot et al., Citation1995, Citation2000; Long et al., Citation2008; Zhu et al., Citation2015b). Here, the distal collateral flow through ophthalmic and superficial temporal arteries was discounted as such re-routing of blood flow may occur only during severe bilateral CS (Yamamoto et al., Citation2004); only unilateral CS was employed in this study. While progressive unilateral CS causes abnormal flow distribution in vasculatures (Cassot et al., Citation1995, Citation2000; Henderson et al., Citation2000; Moneta et al., Citation1993; Mukherjee et al., Citation2018; Rothwell et al., Citation1994; Schomer et al., Citation1994), the present study focused on variant forms of CoW and the role of CoAs in cerebral circulation.
2. Methods
2.1. Patient-specific, three-dimensional haemodynamics
Patient-specific CTA data were obtained with the approval of the Institutional Review Board (IRB) from a medical-image database from Screening Technology and Outcome Project (STOP) in a stroke database study (Smith et al., Citation2009). The selected images covered most of the upper-chest arterial domain ranging from the aorta to the CoW. Four models, identical to Mukherjee et al. (Citation2016), were chosen, but one, pat2, was excluded due to its string-like ICAs since they may already exhibit occlusive behavior. All models displayed anatomical features of (1) a complete CoW and (2) distinctive branching patterns of arterial vessels downstream of the aortic arch. This variety in haemodynamic structure showed different flow distribution types (Mukherjee et al., Citation2016), ensuring the reliability of the present study (Figure A).
2.2. Model geometry
CTA images had mean voxel size of 511 × 511 × 439.7 (±31.8, SD) and a resolution of 0.46 (±0.10, SD) × 0.46 (±0.10, SD) × 1 mm. The CTA-based computational domains were then constructed using an open-source haemodynamics simulation package, SimVascular(Updegrove et al., Citation2017), and all patient models underwent the two-dimensional vessel segmentation procedure (Wilson et al., Citation2001). The centerline paths in each image were combined with segmented two-dimensional contours, which were automatically lofted to create wall boundaries for the arterial domain. The meshing process finalized the solid computer model with a three-dimensional, tetrahedral grid structure.
2.3. Numerical scheme
Although blood is a non-Newtonian fluid in which viscosity depends on the haematocrit (Berger & Jou, Citation2000; Pedley & Luo, Citation1995), it can be assumed as a Newtonian fluid when large arteries, such as the cerebral artery, are simulated (Arzani, Citation2018; Ku, Citation1997; Taylor & Figueroa, Citation2009). Hence, blood in the arterial system was assumed to be an incompressible, Newtonian fluid with a density of 1.06 g cm−3 (Trudnowski & Rico, Citation1974) and viscosity of 0.04 g s−1 cm−1 (Hall & Hall, Citation2020). With rigid wall assumptions, a Petrov–Galerkin stabilized finite-element formulation with linear elements (Brooks & Hughes, Citation1982; Franca et al., Citation1992; Franca & Frey, Citation1992) was used to calculate the flow velocity and pressure field of the constructed domains. The Navier-Stokes equations with the above assumptions and the corresponding Petrov-Galerkin formulation can be expressed as,
(1)
(1)
(2)
(2)
(3)
(3)
(4)
(4) where Eqs. (1), (2), (3), and (4) are the Navier-Stokes equation, continuity equation, constitutive law for Newtonian fluids, and a general variational form of the stabilized finite-element method, respectively. Here, u and p are the velocity and pressure fields, w and q are the corresponding test functions,
is the density of blood,
is the viscosity of blood,
is gravitational acceleration, b denotes the total body force, h denotes the contributions at each Neumann boundary (
) of the computational domain (
), D denotes the symmetric part of the velocity gradient (
), and
is the corresponding element residual of the momentum equation. The stabilization parameters
and
are chosen as functions of the element size (Franca & Frey, Citation1992; Tezduyar & Osawa, Citation2000). The term
is the contribution to the variational form from all the resistance outflow boundary conditions (Vignon-Clementel et al., Citation2006, Citation2010). The finite-element solver, with customized preconditioners, was implemented as a part of the SimVascular package (Updegrove et al., Citation2017), which has been validated for accurately adapting patient-specific boundary conditions (Coogan et al., Citation2013; Mukherjee et al., Citation2018; Vignon-Clementel et al., Citation2006) and describing flows in larger arteries (Les et al., Citation2010; Mukherjee et al., Citation2016). Details about the solver are available in Esmaily-Moghadam et al. (Citation2013).
2.4. Boundary conditions
The prescribed inlet condition was a pulsatile flow rate of ascending aorta in Olufsen et al. (Citation2000), assigned to all patient geometries. Since the inlet velocity profile of ascending aorta is generally plug-type (Seed & Wood, Citation1971), such type was mapped on to the face of the aorta inlet. The outlet boundary conditions were given at distal ends of each branch as three-element lumped parameter Windkessel models, providing two resistances of proximal resistance and distal resistance
and one capacitance
. Total resistance
was calculated with MAP, and total cardiac volumetric flow
acquired from inlet flow using the relation
. The ratio
was given as
and a fixed value of 0.91 was selected for a total of eleven Windkessel outlets. Total capacitance
was initially calculated using the relation
and distributed to outlets depending on their cross-sectional area to provide individual values of
at each outlet. All values of C then were iteratively optimized until feasible pressure ranges were achieved using a conventional procedure (Xiao et al., Citation2014). MAP was calculated as
with
, and
as systolic and diastolic pressures, and flow distribution was set to be equivalent to Mukherjee et al. (Citation2016). Iterative tuning of individual resistance values was conducted to obtain desired outflow rates during steady-state simulation, and capacitance values were tuned to match acceptable pulse pressure range of 40–50 mmHg for the descending aorta and its nearest region and 30–40 mmHg for carotid and cerebral arteries (Alastruey et al., Citation2007; Coogan et al., Citation2013). A graphical illustration of the boundary condition is shown in Figure and the patient-specific three-element Windkessel boundary conditions are given in Table .
Figure 2. Specific boundary conditions for each patient model. Pulsatile inflow (reproduced from Olufsen et al., Citation2000) was given at the aorta, and Windkessel 3-element outlet conditions were used for a total of eleven outlet boundaries.
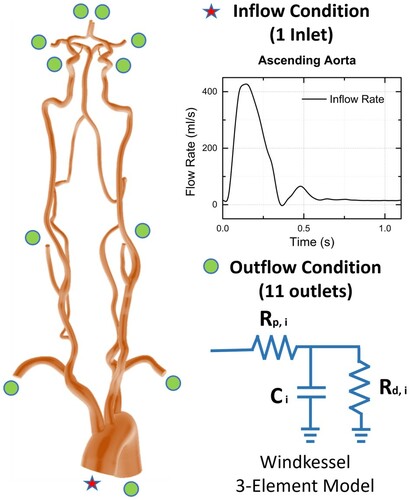
Table 2. Windkessel RCR parameters of all patient models. ,
, and
represent proximal resistance, distal resistance, and compliance, respectively. The units for resistance and compliance are 109 Pa s/m3, and 10−10 m3/Pa, respectively.
The resistance conditions in the distal regions of the arterial outlets were assumed not to change despite the progression of CS. It mainly was due to the innate nature of the arterial networks, which are closed-loop systems. Cardiac perfusion might also have been affected due to severe CS causing acute cardiac compensation, as in a coarctation case (Coogan et al., Citation2013), but since the cerebral flow was only 14% of the total cardiac output (Kety, Citation1950), its impact was assumed negligible.
2.5. Data analysis
An open-source program ParaView (Kitware, Inc. Clifton Park, NY, USA) (Schroeder et al., Citation2004) was used to analyse and post-process the simulation results.
The definitions of the blood flow volume (BFV) and normalized flow rates were calculated with equations given below.
(5)
(5)
(6)
(6) where
,
, and
represented the period of the cardiac cycle, the flow rate at the corresponding severity in CS, and the flow rate at the absence of CS (0%), respectively.
The total flow across the CoAs (tCoA) was proposed in this study. This was expressed as the sum of the absolute flow rate across the CoAs representing the movement of the collateral flow within a CoW. The equation is given below as,
(7)
(7) where
,
, and
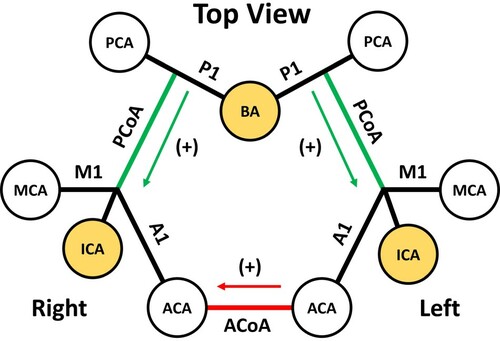
were the corresponding BFV of the given arteries. For simplicity, the flow directions for the CoAs were defined similarly to previous studies (Alastruey et al., Citation2007; Ryu et al., Citation2017); the PCoA direction was positive towards anterior circulation and the ACoA direction was positive to the ipsilateral side (Figure ).
Figure 3. Schematic for CoA, namely ACoA (red), and PCoAs (green), flow directions. For analytic presentation, complete form of CoW is seen from the top showing six major cerebral arteries (white) and three source arteries (yellow) as circles. Since RICA is the site for stenosis, ACoA direction is positive towards right hemisphere, and PCoA directions are positive towards anterior hemisphere. CoA, communicating artery; RICA, right internal carotid artery; M1, proximal segment of MCA; A1, proximal segment of ACA; P1, proximal segment of PCA; ACoA, anterior communicating artery; PCoA, posterior communicating artery; ICA, internal carotid artery; VA, vertebral artery.
Moreover, a peak systolic velocity (PSV) threshold, considered to be similar to the fading limits of encoding velocity (Venc) in the present study, was selected for the iso-volumetric representation of CoW. Venc can even go up to 40 cm/s for the detection of PCoAs (Schomer et al., Citation1994), but the threshold range of the average velocity was determined to be 3–15 cm/s based on the recent small cerebral artery literature (Schnerr et al., Citation2017).
2.6. NASCET criteria and ECST conversion
NASCET criteria (Moneta et al., Citation1993) is calculated with the equation below,
(8)
(8) where
and
represent the distal diameter of the stenosed artery observed to be normal and the narrowest diameter at the stenosis, respectively. The severities selected to simulate the progressive effects of CS were 0, 50, 75, 85, and 95%. The criteria had to be converted to ECST (Rothwell et al., Citation1994) for accurate comparison with the literature that did not employ NASCET criteria. The conversion equation (Rothwell et al., Citation1994) is presented below,
(9)
(9) This made the corresponding ECST-based severities to our study 40, 70, 85, 91, and 97%, However, a 0% NASCET denotes the absence of stenosis, and thus, the ECST severities were rearranged as 0, 70, 85, 91, and 97%. The stenosis was given on the proximal segment of the right internal carotid artery (RICA) near the carotid bifurcation (Figure A). The lumen diameter of the target location hence changed to the corresponding severity, and the fixed origin of the stenosis, located at the centerline, enabled the stenosis to be symmetric.
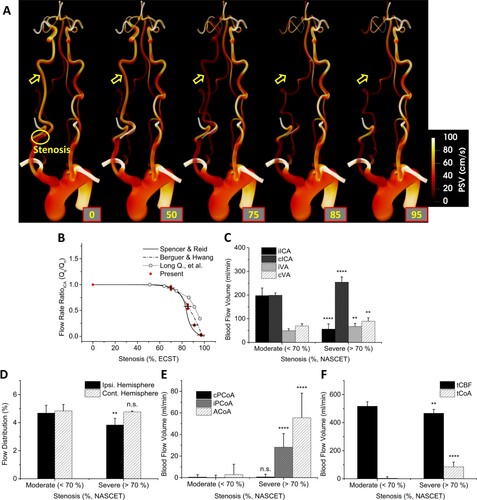
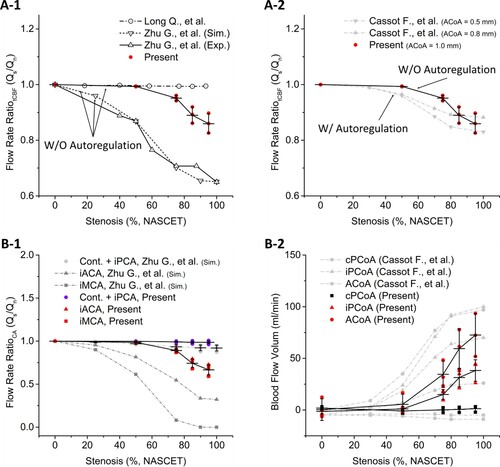
Figure 4. A, 3D PSV contour of P02 showing the continuous changes of cardiovascular haemodynamics during the progression of CS. The trend was identical in all patient models. B, Comparison of flow rate ratio (FRR) with the literature. The flow rate under stenosis, Qs, and under normal (0%) condition, Qn, were used for clear comparison of the tendencies. Present results were depicted in a group of red dots with mean and standard deviation in black lines. C, Blood Flow Volume (BFV) in major arteries (iICA, cICA, iVA, and cVA) leading to CoW in the moderate (<70%) and severe (>70%) groups. D, The flow distribution to the ipsilateral and contralateral hemisphere in the moderate and severe groups. E, BFV in communicating arteries (cPCoA, iPCoA, and ACoA) in the moderate and severe groups. F, BFV of total cerebral blood flow (tCBF) and total flow across CoAs (tCoA) in the moderate and severe groups. Notations were given for P values of: >0.05; n. s., <0.05;*, <0.01;**, <0.001;***, <0.0001;****.
2.7. Grid independence test
The computational mesh containing 6–8.5 × 10⁶ elements was similar in number to those from Mukherjee et al. (Citation2016) and Mukherjee et al. (Citation2018), which was already verified using a more detailed mesh-refinement study (Les et al., Citation2010) and coarctation study (Coogan et al., Citation2013). However, since the present study imposed stenosis conditions to iICA, the local mesh around iICA had to be validated. Validation made using an iICA-only domain is unidentical to the result using the whole domain, and hence the test was carried out using the whole domain. The haemodynamic properties of PSV and systolic pressure Psys were chosen for validation to represent the extreme conditions at the stenosis region. As a result, case 2 was chosen for 95% CS case of P01, and mesh sizes were evenly scaled to their corresponding stenosis diameter for all patient cases (Table ). The same process was applied to the rest of the CS severity.
Table 3. Grid independence test of P01 at 95% CS.
2.8. Statistics
The differences in moderate and severe stenosis results were statistically evaluated by Student's t-test or Welch's t-test depending on the results of Levene's test. No results were excluded. Statistical test results were designated with n.s. (no significance) when P > 0.05, one asterisk (*) when P < 0.05, two asterisks (**) when P < 0.01, three asterisks (***) when P < 0.001, and four asterisks (****) when P < 0.0001.
3. Results
3.1. Progressive changes in BFV of iICA and tCBF reduction
The following results include data for all three patient models. The progressive changes in the aortic-cerebral haemodynamics of P02 during the subsequent progression of CS (P01 and P03 are available in Supplemental Figures II to IV) were observed in Figure A. Figure B shows the normalized MFR in the four major arteries leading to the CoW in ECST standard. The values were normalized from a baseline, 0% stenosis. As stenosis progressed, the BFV ratio in iICA fell rapidly after 70% severity, falling within the range of the theoretical single-pipe (Spencer & Reid, Citation1979) and in-situ measurement value (Berguer & Hwang, Citation1974). The result from Long et al. (Citation2008), however, diverged from the literature at severe stenoses. Based on this result, the groups of moderate (<70%), and severe (>70%) were created which a total of six, and nine cases were allocated for moderate, and severe, respectively. Figure C compares the BFV in major arteries leading to CoW (iICA, cICA, iVA, and cVA) grouped in moderate (<70%), and severe (>70%). The changes in ICAs were very significant (P < 0.0001), VAs experience relatively minor changes (P < 0.01). Figure D shows the resultant changes in flow distribution in both hemispheres. The ipsilateral side was affected significantly (P < 0.01) while the effects on the contralateral hemisphere were minimal (n.s.). Figure E shows BFV in CoAs. From moderate to severe, the changes in cPCoA were negligible (n.s.) while both iPCoA and ACoA were affected severely (P < 0.0001). In quantity, ACoA was affected the most. Figure F shows the tCBF and tCoA in BFV of two groups, moderate and severe. The progression of CS made significant changes in both tCBF (p < 0.01) and tCoA (p < 0.0001). Overall, tCBF was reduced at severe CS, which provoked the increased flow rate across CoAs, the collateral arteries. A similar but less dramatic tendency in the CoAs was observed by Cassot et al. (Citation1995).
3.2. Bulk auto-regulation effect in ACV
Figure A-1 shows a comparison of the tCBF ratio in the present study and those of Zhu et al. (Citation2015b) and Long et al. (Citation2008), which did not use a cerebral auto-regulation model (CAM). The tCBF in the present study was maintained until 50% CS but gradually fell until 95% CS, significantly different from those of Zhu et al. (Citation2015b) and Long et al. (Citation2008). Figure A-2 shows a comparison of the tCBF ratio in the present study and the literature with CAM. The results match well with the study employing CAM (Cassot et al., Citation1995). Figure B-1 shows a comparison of the BFV ratio in MCA, ACA, and PCA in both hemispheres. The arteries were grouped based on the changes in BFV ratio, and three groups were made (first group, all contralateral arteries and iPCA; second group, iACA; and third group, iMCA). A comparison in the first group showed negligible differences. Both the flow in iMCA and iACA from the present study, however, showed similar trends in their BFV ratio along with CS progression while the results from Zhu et al. (Citation2015b) drastically changed even at 50% CS. Figure B-2 shows a comparison of BFV in CoAs with the ones from Cassot et al. (Citation1995). BFV in both studies drastically increased until the occlusion. However, the change occurred differently: the reference BFV showed a continuous increment, whereas the present results showed an abrupt increase from 50% CS.
Figure 5. The results in all figures are presented along the stenosis progression. A-1, Flow rate ratio of tCBF in the present results and the studies without using auto-regulation models. Note that present study also did not use auto-regulation models but used larger arterial domain, ACV; A-2, Comparison to an auto-regulation model study; B-1, Flow rate ratio in CAs of present results and Zhu et al. (Citation2015b). The abbreviation, Cont., represents all of the contralateral arteries; B-2, Blood flow volume (BFV) in the present result and Cassot et al. (Citation1995) which is a study with auto-regulation model.
3.3. CoA response to ICA stenosis
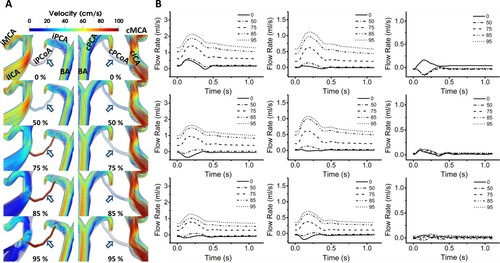
Figure A shows the velocity streamlines around PCoAs of P01. This was identical in the results of other patient models (P02 and P03 are available in Supplemental Figure V). The drastic increase in the flow of iPCoA was visually emphasized with red color and streamlined with a velocity above 100 cm/s, while the one in cPCoA remained unchanged. The streamline in iPCoA remained still until 50% CS, but a transition occurred from 75% CS. The severe CS also affected the arteries around PCoAs: the flow in iICA became highly circulatory, and the one in BA significantly increased, while the one in cICA was also considerably increased. Figure B shows the flow rate waveforms in CoAs, namely ACoA, iPCoA, and cPCoA. At severities below 50%, the waveform oscillated around zero-value. The progression of CS until 50% had a negligible impact on the waveform of all CoAs. Further progression to 75% dramatically impacted the waveforms of ACoA and iPCoA but negligibly impacted cPCoA. The waveforms of ACoA and iPCoA at a severity above 75% resembled the ones of normal arteries.
Figure 6. A, Velocity streamlines around PCoAs at their systolic phases of P01. The tendencies were identical in all patient models. The locations of the PCoAs (arrows; dark blue) are indicated. Note the drastic increase in flow velocity in the iPCoAs during the progressive CS and consistent flow velocity in cPCoAs. CS progression also provoked the recirculation in the ipsilateral region and rapid flow in the collateral arteries. The percentages note the severity of the stenosis; B, Flow rates in the CoAs. Flow rates in ACoA and iPCoA experienced dramatic changes moving to the positive direction showing minor jumps at 50% stenosis, and major leaps from 75% CS, triggering the flow of notable amount of blood volume. Their waveforms from 75% CS resembled the ones of normal arteries. The flow rates in cPCoA, however, remained relatively unchanged.
3.4. Variation in CoW during CS progression
Figure A shows three-dimensional velocity magnitude contours of the CoW and representative iso-volumetric surfaces in P02. The changes in the velocity contours were identical to the velocity streamline in Figure A, and due to similarities in its tendency, only the P02 case was presented (P01 and P03 are available in Supplemental Figure VI). The surfaces are graphical depictions of the superior view of the CoW contours, with values of PSV greater than 12 cm/s. The PSV value was determined using the concept of Venc in conventional maximum intensity projection (MPI) technique using MRI. For MPI in magnetic resonance angiography (MRA), Venc is set to project the vessel network. Venc is set slightly higher than the maximum expected velocity due to aliasing of data, where both the magnitude and the direction of the flow are significantly reduced and reversed at a flow velocity greater than Venc. The key issue here is that, when this value is set too high, small arteries and near-wall arterial boundaries with low-velocity magnitudes may be considered as noise and hence be eliminated. In this study, velocity thresholds were imposed in the range of 3–15 cm/s in average velocity (Vavg), based on Schnerr et al. (Citation2017), and twice for PSV, 6–30 cm/s, assuming Poiseuille flow. The iso-volumetric surfaces of all patient models are available in Supplemental Figures II to XII.
Figure 7. A, 3D velocity contours and the representative iso-volumetric 3D surfaces at the peak systole. The peak systole here represented the maximum velocity magnitude in individual voxels in a cardiac cycle which is a similar representation as MIP in the medical imaging techniques such as transcranial Doppler (TCD) or MRA. The arrows indicated reversed flow from the contralateral side to the iMCA (red; blank), and unrecruited/incompletely recruited arteries (purple; filled); B, the difference between the IR and CR part of the artery segment indicated with and arrow (purple) is shown. The prevalence of CR-CoW during CS progression are presented in C, The prevalence of CR-CoW at each stages of CS. In moderate (<70%) and severe (>70%) groups, there was no difference (n.s.). This implied that IR-CoW can be present depending on the imaging threshold, and CR-CoW be a potential transitional stage between various forms of IR-CoW.
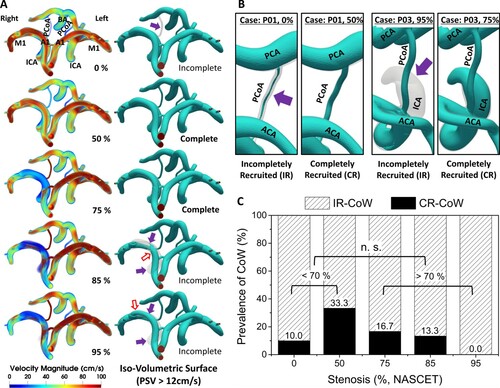
This approach resulted in two distinct phenomena in the iso-volumetric surface: incompletely recruited (IR) and completely recruited (CR) arterial segments. This was a result of adopting the rigid body assumption in the complete CoW domain, where arteries could be incompletely filled depending on the threshold. The typical cases of IR and CR are illustrated in Figure B, where IR parts are indicated with purple arrows. The arterial segments with minimum diameters less than half of the rigid body arteries were IR. The velocity threshold ranges were imposed with equivalent intervals for each velocity type, creating a total of one hundred and fifty iso-volumetric surfaces. Figure C was plotted based on the data from the one hundred and fifty surfaces, and CR was seen dominantly in 50% CS. The prevalence of CR in 0, 75, and 85% CS was almost half of that in 50% CS. CR was not seen in 95% CS. While there was a tendency in the prevalence of CR, it vanished in the comparison between two groups of moderate and severe (n.s.).
3.5. Validation
The present results were also compared to other haemodynamic studies (Coogan et al., Citation2013; Olufsen et al., Citation2000; Pagoulatou et al., Citation2017) and clinical measurements of US (Nicolau et al., Citation2001) and MRA (Oktar et al., Citation2006) data (Table ). Both MAP and BFV fell within narrow error ranges, and the BFVs of VA, especially, had almost equivalent mean value and even a smaller SD. The BFV in the stenosed ICA was unavailable but a corresponding comparison is shown in Figure A-1.
Table 4. Comparison of the averaged MAP and BFV with values from the literature.
4. Discussion
4.1. tCBF consistency during CS progression
In this study, for the first time, an ACV was employed for a predictive study of CS. The RICA was selected for each patient model to apply the NASCET-based stenosis conditions, and a total of fifteen cases were created. Previous studies assumed new inflow conditions at the ICAs, VAs, or BA to the corresponding stenosis conditions due to unknown boundary conditions during severe stenosis, but such an approach was unnecessary in our extended domain. In our domain, these unknowns were calculated directly using the Navier-Stokes equations with validated assumptions. The blood flow in iICA was calculated using the change in the local resistance, proportional to the local cross-sectional area, and the reduced flow rate in iICA was automatically redistributed to the other arteries such as the DsA, SA, and ECA (Table ). The reduced flow rate in iICA to the cerebral region was redirected via cICA, iVA, and cVA (Figure C), in which increments were significant (P < 0.01) in all three arteries. Such redirection of flow resulted in a considerable reduction in flow distribution (P < 0.01) to the ipsilateral hemisphere (Figure D, Table ). The flow in iICA from the present study showed equivalent values to those presented in Spencer and Reid (Citation1979) and Berguer and Hwang (Citation1974), which were validated with ultrasonography (US) data. The iICA result from Long et al. (Citation2008), which used a somewhat shorter domain comprising only distal ICA and CoW, significantly deviated from the reference data. As an overall effect, tCBF was maintained well beyond 50% stenosis (Figure F, 5A-1, 5A-2).
Table 5. Average flow distribution of arteries and hemispheric flow distribution with CS progression.
The present results were identical to the clinical explanations found in Moneta et al. (Citation1993), which stated that the medical intervention level increases along with stenosis severity, especially at stenosis levels higher than 50% in the NASCET criteria (Moneta et al., Citation1993), validating our tCBF results. The present results also matched the clinical description in (Ackroyd et al., Citation1986), where the CS became significant at a severity of 80% but showed negligible changes at 50%. This was identical to the textbook explanation in Strandness and Sumner (Citation1975) and Payne (Citation2017), which described the robustness of cerebral auto-regulation where both tCBF and the metabolism stayed consistent unless pushed to extreme conditions. Statistically, the flow rate in the common carotid artery (CCA) also fell significantly after only 40–69% of unilateral CS (Ackroyd et al., Citation1986). The clinical evaluation algorithm (Jaff et al., Citation2008), clinical description (Strandness & Sumner, Citation1975), and statistical evidence (Ackroyd et al., Citation1986) validated our results and, in turn, our results provided quantitative explanations for the changes in cardiovascular haemodynamics during the progression of CS.
4.2. Aortic-cerebral and ICA-to-CoW vasculature
The iICA flow rate from Long et al. (Citation2008) diverged from the reference studies (Berguer & Hwang, Citation1974; Spencer & Reid, Citation1979) (Figure B). The tCBF results of Long et al. (Citation2008) and Zhu et al. (Citation2015b) showed either constant or gradual decrements (Figure A), and the individual BFV in major CAs, MCA, and ACA, showed significant reduction during the progression of CS. The referred studies used relatively small domains consisting of distal ICA and CoW (ICA-to-CoW domain), which were approximately one-seventh times shorter longitudinally than the large arterial domain (typically spanning from the aorta to the cerebral vasculature). They did not employ a CAM as in the present study, but their results were different from our results showing that tCBF was maintained to 50%, while gradual decrements were shown at subsequent stages of CS progression. The flow reduction in the present study was also minimal compared to both Zhu et al. (Citation2015b) and Zhu et al. (Citation2015a). Hence, the difference in the tCBF ratio should be due to the use of ACV in the present study. Moreover, our tCBF result without the auto-regulation model mirrors the auto-regulated results from Cassot et al. (Citation1995). This result suggests that a considerably large arterial domain, such as ACV, covering both long proximal and distal segments from the region of interest, has bulk autoregulatory effects similar to vascular models with auto-regulation effects. It was one of the major differences seen in the ACV model in comparison to using the conventional small arterial domain. Another difference was that even though the tCBF results were identical to the ones using the auto-regulation model (Cassot et al., Citation1995), the BFVs in CoAs were significantly different (Figure A-2, 5B-2). The individual BFV in ACoA and iPCoA in the present study followed a similar trend to the tCBF result; it maintained BFV until 50% with increments during the subsequent CS. The results of Cassot et al. (Citation1995) showed a rather gradual increment from 0% CS, which differenceis speculated to be due to the use of the ICA-to-CoW domain in the reference. This suggests that the use of an ACV is an appropriate approach for the effective modeling of arterial domains to investigate the effects of progressive CS on CoW haemodynamics, while minor differences from the autoregulatory model were observed in the CoAs.
4.3. Role of CoAs during CS progression
CoAs are known to play significant roles in providing collateral flow during occlusive arterial conditions (Alastruey et al., Citation2007; Cassot et al., Citation1995, Citation2000; Chuang et al., Citation2008; Henderson et al., Citation2000; Hoksbergen et al., Citation2003; Mukherjee et al., Citation2018; Ryu et al., Citation2015; Zhu et al., Citation2015b), and other cerebral diseases (Adams et al., Citation1999; Kim et al., Citation2016; Schomer et al., Citation1994; Zhou et al., Citation2016). They provide excessive blood flow in the collateral arteries (iVA, cVA, and cICA) to the ipsilateral hemisphere but, as a consequence, are dramatically affected during the occlusion of the ICAs and VAs (Alastruey et al., Citation2007; Cassot et al., Citation1995, Citation2000; Morgenstern et al., Citation1997; Mukherjee et al., Citation2018). Their roles during the progressive CS have also been studied, and they have shown either gradual increases (Zhu et al., Citation2015b) or drastic changes depending on their diameter (Alastruey et al., Citation2007; Cassot et al., Citation1995, Citation2000). However, in our larger, three-dimensional arterial domain, the results were quite different; the changes in the MFR of the CoAs were negligible until 50% but dramatically altered during severe stenosis (Figure E, 4F). This redirection of flow via collateral arteries maintained the tCBF well (Figure F), while the major contralateral cerebral arteries remained unaffected (Figure E). Overall, the progressive CS provoked immediate responses of both the iPCoA and ACoA. Consequently, the loss of ipsilateral hemispheric perfusion was compensated, but the responses were more dramatic compared to those reported in the literature.
4.4. Effects of progressive CS on CoAs
The impact of progressive CS on the CoA haemodynamics was significant. Specifically, ACoA and iPCoA were severely affected, while its effects on cPCoA were negligible (Figure A, 6B). The latter was due to the increase in BFV of both cICA and cVA (Figure C), which resulted in negligible changes in the flow distribution to the contralateral hemisphere (Figure D). In the cases of P2 and P3, CS altered the flow direction in ACoA and PCoA towards the positive direction. The effects of CS especially were seen in Figure A, where high-velocity flows were observed only in iPCoA with a severity above 75%. During the progression, the flow in cPCoA fluctuated, but the changes were insignificant (Figure B).
Interestingly, BFVs in both ACoA and iPCoA were almost zero until 50% CS (Figure F, 5B-2), although the flow fluctuated with considerable amplitudes. The shapes of the waveforms in ACoA and iPCoA at CS greater than 75% resembled the waveforms of normal arteries, implying active involvement of ACoA and iPCoA in cerebral circulation during the severe unilateral CS. These results followed the statistical correlations described in Schomer et al. (Citation1994) and Wang et al. (Citation2016), further validating the BFVs of our study. The transition in BFV of major arteries during low-to-moderate CS is thus another novel contribution of our study. The minimal changes in the waveform of cPCoA indicate that the effect of severe unilateral CS on the contralateral hemisphere was insignificant (Figure B-2, 6B), implying the involvement of cPCoA was trivial during severe unilateral CS.
The diversity of the initial-stage flow waveforms in CoAs may be due to the innate asymmetry of the upper-chest arterial network (Figure C). The perfect balance between the hemispheric circulations may not always be achieved, even under normal conditions (Table ). The presence of blood flow, even without CS suggests that CoAs may exist due to the unequal distribution of cerebral flow through the main arteries. These arteries with significantly reduced flow rates may either be undetected or excluded from MRA analysis, mainly due to being considered as noise factors, as suggested in Hoksbergen et al. (Citation2003), Cassot et al. (Citation1995), and Alastruey et al. (Citation2007). Overall, ACoA may provide cross-collateral flow due to the difference in haemodynamic demands between the ipsilateral and contralateral sides and the PCoAs for the differences in anterior and posterior circulation on their corresponding sides.
4.5. Transitional stages of CoW during CS progression
For the first time, our results showed stepwise variations of the CoW configurations in response to unilateral ICA stenosis with three-dimensional velocity magnitude and iso-volumetric contours (Figure A). While the velocity contours intuitively show the abrupt changes in the velocities of the ipsilateral cerebral arteries, the iso-volumetric contours illustrated the representative changes in the visibility of the arteries. The correlation of the absent functionality of A1 to severe CS has been demonstrated by Hoksbergen et al. (Citation2003), but our results showed that A1 became functional again with the redirected flow from the contralateral hemisphere at 95% severity, which is coherent with the findings made using US data (Saqqur et al., Citation2018). The PCoAs also became functional at the ipsilateral side in response to ipsilateral CS progression while the contralateral side remained inactive (Figure A).
These phenomena caused IR and CR conditions in our representative iso-volumetric contours, as described in Section 3.4 and Figure B, respectively. When thresholds were imposed on CoW, the CoW with CR conditions was observed the most in 50% CS and evenly observed in 0, 75, and 85% CS (Figure C). The CR-CoW was not present at the near-occlusion state (95%), and the overall trend demonstrated a general pulsatile cardiac waveform. CR-CoW was most present in 50% CS, but when the groups were re-classified into moderate (<70%) and severe (>70%), the statistical correlation between the two groups was not significant (n.s.). This implies that, even though the progression of CS created a distinct variation pattern in the CoW, a holistic analysis of CoW variation might provide statistically insignificant information. Such inclination became more dominant in PSV-based classification (Supplemental Figure XIII). The authors thought such disagreement in the cerebral haemodynamics during the progression may have led to the conflicting arguments in Hoksbergen et al. (Citation2003) and Chuang et al. (Citation2008), and even slightly confusing arguments in Banga et al. (Citation2018), which correlated the isolated iMCA (of various forms) to a neurological disease while neglecting the high prevalence of both severe ipsilateral and contralateral CS.
The above discussion highlights that the complete CoW may not always be a golden standard for better clinical outcomes. The initial fluctuating waveform in CoAs until 50% stenosis (Figure B) made the posterior circulation IR in the represented CoW (Figure A). The CoW was CR at 50 and 75% but IR at 85% and 95%, although ACoA and iPCoA at 75% and above showed waveforms (Figure B) resembling those of normal arteries (Figure , inlet waveform). Patient-wise, CoW was completely recruited only at 50% for P01, 50 and 75% for P02, and 75% for P03, indicating that a CR-CoW may be a transitional stage from a configuration with IR-PCoAs to another IR-CoW. Such transitions in individual CoW have never been investigated in previous studies.
This may also be related to the collateral capacity of the cerebral circulation. The tCoA increased with stenosis progression to maintain cerebral circulation, but only until 50% stenosis (Figure V). After that, the tCBF gradually reduced by the resultant difference between the tCoA, and the flow in iICA. This meant that the major carotid and cerebral arteries had their collateral capacities maintained until 50% stenosis, which later led to the gradual depletion of the collateral reserve during the further progression of CS. Overall, the collateral capacity switched with the active involvement of both iACA and iPCoA caused variations in the CoW during unilateral CS (Supplemental Figure V). Therefore, the classifications of the CoW may have to be contemplated for more accurate statistical comparisons.
4.6. Limitations
This study had several limitations. First, one of our assumptions was a rigid vessel wall. Arterial compliance is typically regulated with diameters of deformable vessel walls, and the diameters are affected by the pulsatile nature of the blood flow. Once a fluid-structure interaction (FSI) model is employed, such large displacements and deformations of the arterial wall also need to be solved numerically. An arbitrary Lagrangian–Eulerian formulation (Taylor & Figueroa, Citation2009) would be a suitable candidate for FSI simulation, although the computational cost would be exceedingly high, especially for a large arterial domain. Other FSI methods, such as the boundary element method–finite element method (BEM–FEM) (Ghalandari et al., Citation2019) and cut-cell immersed boundary method assisted by the adaptive mesh refinement algorithm (Salih et al., Citation2019) could also be useful tools for accurately depicting boundary interactions. The effects of a full FSI simulation on the overall results are still unclear, but Brown et al. (Citation2012) found similar results in both the flow fields and helical flow indices of FSI and rigid wall models. Nevertheless, future work on patient-specific investigations of progressive carotid diseases, at least with a partial FSI model, would be important for accurate analysis of the wall shear stresses in patient-specific models (Sun et al., Citation2019; Toloui et al., Citation2012).
Second, despite employing five progressive CS cases for each patient model, only three patients had been analyzed. However, such an approach was reasonable since ACV simulations, especially in three dimensions, are computationally expensive in both time and effort (Coogan et al., Citation2013). Also, for a counterpart, one hundred and fifty CoW cases were generated to analyse the prevalence of the complete CoW, and the present study was the first study to investigate the effects of CS on cerebral vasculature with improved accuracy (Table , Figure B, 5A-1, 5A-2). Additionally, computational simulation minimized the unknown factors involved during the study, which might have been obstacles for accurate measurements in the clinical environment.
Third, the inflow conditions given for the patient-specific geometries were equivalent. The patient-specific aorta inflow conditions are usually not easy to obtain and were also unavailable for this study. Although a general mean inflow rate of 90 mL/s (Olufsen et al., Citation2000) was employed, the inflow rate in each patient would be different. In this circumstance, assigning arbitrarily different inflow conditions on patient cases is also another limitation of the study. The effects of patient-specific inflow rate conditions to patient-specific arterial domains and their differences to the results obtained with a general inflow rate are still unclear but future studies employing individual patient-specific inflow conditions would present a more refined patient-specific haemodynamic nature under CS progression.
Fourth, the use of the non-Newtonian fluid assumption would change the local haemodynamics. Although the conventional Newtonian fluid assumption holds for simulations of large arteries, such as the aorta and the cerebral artery (Arzani, Citation2018; Ku, Citation1997; Taylor & Figueroa, Citation2009), and is valid for the flows with shear rates higher than 100 s−1 (Berger & Jou, Citation2000; Pedley & Luo, Citation1995), a recent comparative study showed a maximum difference of 17% in systolic velocity in a cerebral artery geometry with 90° bifurcation. Hence, a non-Newtonian assumption may induce notable haemodynamic effects in regions of significant geometrical variation, which could be an interesting topic for further investigation.
This study employed a three-dimensional ACV to simulate patient-specific haemodynamics during CS progression. Such an approach is computationally expensive, as conventional modeling requires a repetitive modeling procedure for each patient-specific stenosis cases. Hence, a scheme to reduce the computational burden may include the adoption of reduced-order models (e.g. one-dimensional models) in artery segments of less importance. However, such an approach will neglect the accurate depiction of flow phenomena found in the three-dimensional system as the input to a three-dimensional domain from a one-dimensional domain cannot be equal to that from a three-dimensional domain. A network of one-dimensional and three-dimensional systems would consequently have discontinuities in the flow phenomena. A notable advance in the coherent blending of one and three-dimensional boundaries, effectively representing the entire three-dimensional domain may enable more realistic haemodynamic simulations at significantly reduced computational costs.
5. Conclusion
Predictive, progressive CS conditions were studied with ACV for the first time. As a result, transitional changes in the represented CoW were observed, where the prevalence of ‘complete’ CoW peaked at 50% CS and then declined. Such tendency, however, became statistically insignificant in groups of ‘<70%’ and ‘>70%’. The redirection of ipsilateral blood flow to other major arteries and the effective collateral capability of CoAs, activated from a degree of 75% and above, significantly contributed to this phenomenon, while hemispheric perfusion was preserved in the contralateral side and moderately sustained in the ipsilateral side. We discovered a new aspect of the conventional Windkessel model: it can demonstrate accurate flow reduction in the stenosed artery and bulk cerebral auto-regulation effects when a large arterial network, such as the aortic-cerebral domain, is used. In a manner similar to other literature reports, collateral flow through CoAs compensated for the reduced ipsilateral hemispheric perfusion but was activated only at severe CS. The presence of blood flow in CoAs at moderate CS may be due to an imbalance in hemispheric haemodynamic perfusion. This study should motivate more comprehensive predictive studies, which have been limited by statistical complexities and large engineering scales.
The use of a rigid wall, incompressible Newtonian assumptions, and a small number of patient samples are the primary limitations of this study. Future computational studies may need to adopt the specified limitations noted above for improved accuracy but would encounter extreme computational costs. Nonetheless, this study is a promising advancement in developing a mechanistic approach to the analysis of cardiovascular diseases.
Supplemental Material
Download PDF (5 MB)Disclosure statement
No potential conflict of interest was reported by the author(s).
Additional information
Funding
References
- Ackroyd, N., Gill, R., Griffiths, K., Kossoff, G., & Appleberg, M. (1986). Quantitative common carotid artery blood flow: Prediction of internal carotid artery stenosis. Journal of Vascular Surgery, 3(6), 846–853. https://doi.org/https://doi.org/10.1016/0741-5214-(86)90148-5
- Adams, H. P., Jr., Davis, P. H., Leira, E. C., Chang, K. C., Bendixen, B. H., Clarke, W. R., Woolson, R. F., & Hansen, M. D. (1999). Baseline NIH Stroke Scale score strongly predicts outcome after stroke: A report of the Trial of Org 10172 in Acute Stroke Treatment (TOAST). Neurology, 53(1), 126. https://doi.org/https://doi.org/10.1212/WNL.53.1.126
- Alastruey, J., Parker, K. H., Peiró, J., Byrd, S. M., & Sherwin, S. J. (2007). Modelling the circle of Willis to assess the effects of anatomical variations and occlusions on cerebral flows. Journal of Biomechanics, 40(8), 1794–1805. https://doi.org/https://doi.org/10.1016/j.jbiomech.2006.07.008
- Alnæs, M. S., Isaksen, J., Mardal, K.-A., Romner, B., Morgan, M. K., & Ingebrigtsen, T. J. S. (2007). Computation of hemodynamics in the circle of Willis. Stroke, 38(9), 2500–2505. https://doi.org/https://doi.org/10.1161/STROKEAHA.107.482471
- Alpers, B. J., Berry, R. G., & Paddison, R. M. (1959). Anatomical studies of the circle of Willis in normal brain. Archives of Neurology And Psychiatry, 81(4), 409–418. https://doi.org/https://doi.org/10.1001/archneurpsyc.1959.02340160007-002
- Arzani, A. J. (2018). Accounting for residence-time in blood rheology models: Do we really need non-Newtonian blood flow modelling in large arteries? Journal of The Royal Society Interface, 15(146), 20180486. https://doi.org/https://doi.org/10.1098/rsif.2018.0486
- Banga, P. V., Varga, A., Csobay-Novak, C., Kolossváry, M., Szántó, E., Oderich, G. S., Entz, L., & Sótonyi, P. (2018). Incomplete circle of Willis is associated with a higher incidence of neurologic events during carotid eversion endarterectomy without shunting. Journal of Vascular Surgery, 68(6), 1764–1771. https://doi.org/https://doi.org/10.1016/j.jvs.2018.03.429
- Berger, S., & Jou, L.-D. (2000). Flows in stenotic vessels. Annual Review of Fluid Mechanics, 32(1), 347–382. https://doi.org/https://doi.org/10.1146/annurev.fluid.32.1.347
- Berguer, R., & Hwang, N. H. (1974). Critical arterial stenosis: A theoretical and experimental solution. Annals of Surgery, 180(1), 39–50. https://doi.org/https://doi.org/10.1097/00000658-1974070-00-00007
- Blanco, P. J., Müller, L. O., & Spence, J. D. (2017). Blood pressure gradients in cerebral arteries: A clue to pathogenesis of cerebral small vessel disease. Stroke and Vascular Neurology, 2(3), 108–117. https://doi.org/https://doi.org/10.1136/svn-2017-000087
- Brooks, A. N., & Hughes, T. J. R. (1982). Streamline upwind/Petrov-Galerkin formulations for convection dominated flows with particular emphasis on the incompressible Navier-Stokes equations. Computer Methods in Applied Mechanics and Engineering, 32(1-3), 199–259. https://doi.org/https://doi.org/10.1016/0045-7825(82)90071-8
- Brown, A. G., Shi, Y., Marzo, A., Staicu, C., Valverde, I., Beerbaum, P., Lawford, P. V., & Hose, D. R. (2012). Accuracy vs. computational time: Translating aortic simulations to the clinic. Journal of Biomechanics, 45(3), 516–523. https://doi.org/https://doi.org/10.1016/j.jbiomech.2011.11.041
- Cassot, F., Vergeur, V., Bossuet, P., Hillen, B., Zagzoule, M., & Marc-Vergnes, J. P. (1995). Effects of anterior communicating artery diameter on cerebral hemodynamics in internal carotid artery disease. A model study. Circulation, 92(10), 3122–3131. https://doi.org/https://doi.org/10.1161/01.CIR.92.10.3122
- Cassot, F., Zagzoule, M., & Marc-Vergnes, J. P. (2000). Hemodynamic role of the circle of Willis in stenoses of internal carotid arteries. An analytical solution of a linear model. Journal of Biomechanics, 33(4), 395–405. https://doi.org/https://doi.org/10.1016/S0021-9290(99)00193-1
- Chatzikonstantinou, A., Wolf, M. E., Schaefer, A., & Hennerici, M. G. (2012). Asymptomatic and symptomatic carotid stenosis: An obsolete classification? Stroke Research and Treatment, 2012, 1–8. https://doi.org/https://doi.org/10.1155/2012/340798
- Chuang, Y. M., Liu, C. Y., Pan, P. J., & Lin, C. P. (2008). Posterior communicating artery hypoplasia as a risk factor for acute ischemic stroke in the absence of carotid artery occlusion. Journal of Clinical Neuroscience, 15(12), 1376–1381. https://doi.org/https://doi.org/10.1016/j.jocn.2008.02.002
- Coogan, J. S., Humphrey, J. D., & Figueroa, C. A. (2013). Computational simulations of hemodynamic changes within thoracic, coronary, and cerebral arteries following early wall remodeling in response to distal aortic coarctation. Biomechanics and Modeling in Mechanobiology, 12(1), 79–93. https://doi.org/https://doi.org/10.1007/s10237-012-0383-x
- Esmaily-Moghadam, M., Bazilevs, Y., & Marsden, A. L. (2013). A new preconditioning technique for implicitly coupled multidomain simulations with applications to hemodynamics. Computational Mechanics, 52(5), 1141–1152. https://doi.org/https://doi.org/10.1007/s00466-013-0868-1
- Franca, L. P., & Frey, S. L. (1992). Stabilized finite element methods: II. The incompressible Navier-Stokes equations. Computer Methods in Applied Mechanics and Engineering, 99(2-3), 209–233. https://doi.org/https://doi.org/10.1016/0045-7825(92)90041-H
- Franca, L. P., Frey, S. L., & Hughes, T. J. (1992). Stabilized finite element methods: I. Application to the advective-diffusive model. Computer Methods in Applied Mechanics and Engineering, 95(2), 253–276. https://doi.org/https://doi.org/10.1016/0045-7825(92)90143-8
- Ghalandari, M., Bornassi, S., Shamshirband, S., Mosavi, A., & Chau, K. W. (2019). Investigation of submerged structures’ flexibility on sloshing frequency using a boundary element method and finite element analysis. Engineering Applications of Computational Fluid Mechanics, 13(1), 519–528. https://doi.org/https://doi.org/10.1080/19942060.2019.1619197
- Hall, J. E., & Hall, M. E. (2020). Guyton and Hall textbook of medical physiology e-book. Elsevier Health Sciences.
- Halliday, A. J. L. (2004). MRC asymptomatic Carotid Surgery Trial (ACST) Collaborative Group: Prevention of disabling and fatal strokes by successful carotid endarterectomy in patients without recent neurological symptoms: Randomized controlled trial. Lancet, 363(9420), 1491–1502. https://doi.org/https://doi.org/10.1016/S0140-6736(04)16146-1
- Henderson, R. D., Eliasziw, M., Fox, A. J., Rothwell, P. M., & Barnett, H. J. (2000). Angiographically defined collateral circulation and risk of stroke in patients with severe carotid artery stenosis. North American Symptomatic Carotid Endarterectomy Trial (NASCET) group. Stroke, 31(1), 128–132. https://doi.org/https://doi.org/10.1161/01.STR.31.1.128
- Hendrikse, J., Hartkamp, M. J., Hillen, B., Mali, W. P., & van der Grond, J. (2001). Collateral ability of the circle of Willis in patients with unilateral internal carotid artery occlusion: Border zone infarcts and clinical symptoms. Stroke, 32(12), 2768–2773. https://doi.org/https://doi.org/10.1161/hs1201.099892
- Hoksbergen, A. W., Fülesdi, B., Legemate, D. A., & Csiba, L. (2000). Collateral configuration of the circle of Willis: Transcranial color-coded duplex ultrasonography and comparison with postmortem anatomy. Stroke, 31(6), 1346–1351. https://doi.org/https://doi.org/10.1161/01.STR.31.6.1346
- Hoksbergen, A. W., Legemate, D. A., Csiba, L., Csáti, G., Síró, P., & Fülesdi, B. (2003). Absent collateral function of the circle of Willis as risk factor for ischemic stroke. Cerebrovascular Diseases, 16(3), 191–198. https://doi.org/https://doi.org/10.1159/000071115
- Jaff, M. R., Goldmakher, G. V., Lev, M. H., & Romero, J. M. (2008). Imaging of the carotid arteries: The role of duplex ultrasonography, magnetic resonance arteriography, and computerized tomographic arteriography. Vascular Medicine, 13(4), 281–292. https://doi.org/https://doi.org/10.1177/1358863-X08091971
- Kapoor, K., Singh, B., & Dewan, L. I. (2008). Variations in the configuration of the circle of Willis. Anatomical Science International, 83(2), 96–106. https://doi.org/https://doi.org/10.1111/j.1447-073X.2007.00216.x
- Kety, S. S. (1950). Circulation and metabolism of the human brain in health and disease. American Journal of Medicine, 8(2), 205–217. https://doi.org/https://doi.org/10.1016/0002-9343(50)90363-9
- Kim, K. M., Kang, H. S., Lee, W. J., Cho, Y. D., Kim, J. E., & Han, M. H. (2016). Clinical significance of the circle of Willis in intracranial atherosclerotic stenosis. Journal of Neurointerventional Surgery, 8(3), 251–255. https://doi.org/https://doi.org/10.1136/neurintsurg-2014-011439
- Ku, D. N. (1997). Blood flow in arteries. Annual Review of Fluid Mechanics, 29(1), 399–434. https://doi.org/https://doi.org/10.1146/annurev.fluid.29.1.399
- Les, A. S., Shadden, S. C., Figueroa, C. A., Park, J. M., Tedesco, M. M., Herfkens, R. J., Dalman, R. L., & Taylor, C. A. (2010). Quantification of hemodynamics in abdominal aortic aneurysms during rest and exercise using magnetic resonance imaging and computational fluid dynamics. Annals of Biomedical Engineering, 38(4), 1288–1313. https://doi.org/https://doi.org/10.1007/s10439-010-9949-x
- Lippert, H., & Pabst, R. (1985). Arterial variations in man: Classification and frequency. Springer.
- Liu, X., Gao, Z., Xiong, H., Ghista, D., Ren, L., Zhang, H., Wu, W., Huang, W., & Hau, W. K. (2016). Three-dimensional hemodynamics analysis of the circle of Willis in the patient-specific nonintegral arterial structures. Biomechanics and Modeling in Mechanobiology, 15(6), 1439–1456. https://doi.org/https://doi.org/10.1007/s10237-016-0773-6
- Liu, H., Wang, D., Leng, X., Zheng, D., Chen, F., Wong, L. K. S., Shi, L., & Leung, T. W. H. (2020). State-of-the-art computational models of circle of willis with physiological applications: A review. IEEE Access, 8, 156261–156273. https://doi.org/https://doi.org/10.1109/ACCESS.2020.3007737
- Long, Q., Luppi, L., König, C. S., Rinaldo, V., & Das, S. K. (2008). Study of the collateral capacity of the circle of Willis of patients with severe carotid artery stenosis by 3D computational modeling. Journal of Biomechanics, 41(12), 2735–2742. https://doi.org/https://doi.org/10.1016/j.jbiomech.2008.06.006
- Miyazawa, N., Shinohara, T., & Yamagata, Z. (2011). Association of incompleteness of the anterior part of the circle of Willis with the occurrence of lacunes in the basal ganglia. European Journal of Neurology, 18(11), 1358–1360. https://doi.org/https://doi.org/10.1111/j.1468-1331.2011.03400.x
- Moneta, G. L., Edwards, J. M., Chitwood, R. W., Taylor, L. M., Jr., Lee, R. W., Cummings, C. A., & Porter, J. M. (1993). Correlation of North American Symptomatic Carotid Endarterectomy Trial (NASCET) angiographic definition of 70% to 99% internal carotid artery stenosis with duplex scanning. Journal of Vascular Surgery, 17(1), 152–159. https://doi.org/https://doi.org/10.1067/mva.1993.42888
- Morgenstern, L. B., Fox, A. J., Sharpe, B. L., Eliasziw, M., Barnett, H. J., & Grotta, J. C. (1997). The risks and benefits of carotid endarterectomy in patients with near occlusion of the carotid artery. North American Symptomatic Carotid Endarterectomy Trial (NASCET) group. Neurology, 48(4), 911–915. https://doi.org/https://doi.org/10.1212/wnl.48.4.911
- Mukherjee, D., Jani, N. D., Narvid, J., & Shadden, S. C. (2018). The role of circle of Willis anatomy variations in cardio-embolic stroke: A patient-specific simulation based study. Annals of Biomedical Engineering, 46(8), 1128–1145. https://doi.org/https://doi.org/10.1007/s10439-018-2027-5
- Mukherjee, D., Jani, N. D., Selvaganesan, K., Weng, C. L., & Shadden, S. C. (2016). Computational assessment of the relation between embolism source and embolus distribution to the circle of Willis for improved understanding of stroke etiology. Journal of Biomechanical Engineering, 138(8). https://doi.org/https://doi.org/10.1115/1.4033986
- Nicolau, C., Gilabert, R., Garcia, A., Blasco, J., Chamorro, A., & Brú, C. (2001). Effect of internal carotid artery occlusion on vertebral artery blood flow: A duplex ultrasonographic evaluation. Journal of Ultrasound in Medicine, 20(2), 105–111. https://doi.org/https://doi.org/10.7863/jum.2001.20.2.105
- Oktar, S. O., Yucel, C., Karaosmanoglu, D., Akkan, K., Ozdemir, H., Tokgoz, N., & Tali, T. (2006). Blood-flow volume quantification in internal carotid and vertebral arteries: Comparison of 3 different ultrasound techniques with phase-contrast MR imaging. American Journal of Neuroradiology, 27(2), 363–369. https://www.ncbi.nlm.nih.gov/pubmed/16484412
- Olufsen, M. S., Peskin, C. S., Kim, W. Y., Pedersen, E. M., Nadim, A., & Larsen, J. (2000). Numerical simulation and experimental validation of blood flow in arteries with structured-tree outflow conditions. Annals of Biomedical Engineering, 28(11), 1281–1299. https://doi.org/https://doi.org/10.1114/1.1326031
- Pagoulatou, S., Stergiopulos, N., & Bjornstad, P. (2017). Evolution of aortic pressure during normal ageing: A model-based study. PLoS One, 12(7), e0182173. https://doi.org/https://doi.org/10.1371/journal.pone.0182173
- Papantchev, V., Stoinova, V., Aleksandrov, A., Todorova-Papantcheva, D., Hristov, S., Petkov, D., Nachev, G., & Ovtscharoff, W. (2013). The role of Willis circle variations during unilateral selective cerebral perfusion: A study of 500 circles. European Journal of Cardio-Thoracic Surgery, 44(4), 743–753. https://doi.org/https://doi.org/10.1093/ejcts/ezt103
- Payne, S. J. (2017). Cerebral blood flow and metabolism: A quantitative approach. World Scientific.
- Pedley, T. J., & Luo, X. (1995). Fluid mechanics of large blood vessels. Shaanxi People’s Press.
- Riggs, H. E., & Rupp, C. (1963). Variation in form of circle of Willis. The relation of the variations to collateral circulation: Anatomic analysis. Archives of Neurology, 8(1), 8–14. https://doi.org/https://doi.org/10.1001/archneur.1963.00460010024002
- Rothwell, P. M., Gibson, R. J., Slattery, J., Sellar, R. J., & Warlow, C. P. (1994). Equivalence of measurements of carotid stenosis. A comparison of three methods on 1001 angiograms. European Carotid Surgery Trialists’ Collaborative Group. Stroke, 25(12), 2435–2439. https://doi.org/https://doi.org/10.1161/01.STR.25.12.2435
- Ryu, J., Hu, X., & Shadden, S. C. (2015). A coupled lumped-parameter and distributed network model for cerebral pulse-wave hemodynamics. Journal of Biomechanical Engineering, 137(10), 101009. https://doi.org/https://doi.org/10.1115/1.4031331
- Ryu, J., Ko, N., Hu, X., & Shadden, S. C. (2017). Numerical investigation of vasospasm detection by extracranial blood velocity ratios. Cerebrovascular Diseases, 43(5-6), 214–222. https://doi.org/https://doi.org/10.1159/000454992
- Salih, S. Q., Aldlemy, M. S., Rasani, M. R., Ariffin, A. K., Ya, T. M. Y. S. T., Al-Ansari, N., Yaseen, Z. M., & Chau, K. W. (2019). Thin and sharp edges bodies-fluid interaction simulation using cut-cell immersed boundary method. Engineering Applications of Computational Fluid Mechanics, 13(1), 860–877. https://doi.org/https://doi.org/10.1080/19942060.2019.1652209
- Saqqur, M., Khan, K., Derksen, C., Alexandrov, A., & Shuaib, A. (2018). Transcranial Doppler and transcranial color duplex in defining collateral cerebral blood flow. Journal of Neuroimaging, 28(5), 455–476. https://doi.org/https://doi.org/10.1111/jon.12535
- Schnerr, R. S., Jansen, J. F. A., Uludag, K., Hofman, P. A. M., Wildberger, J. E., van Oostenbrugge, R. J., & Backes, W. H. (2017). Pulsatility of lenticulostriate arteries assessed by 7 tesla flow MRI—Measurement, reproducibility, and applicability to aging effect. Frontiers in Physiology, 8, 961. https://doi.org/https://doi.org/10.3389/fphys.2017.00961
- Schomer, D. F., Marks, M. P., Steinberg, G. K., Johnstone, I. M., Boothroyd, D. B., Ross, M. R., Pelc, N. J., & Enzmann, D. R. (1994). The anatomy of the posterior communicating artery as a risk factor for ischemic cerebral infarction. New England Journal of Medicine, 330(22), 1565–1570. https://doi.org/https://doi.org/10.1056/NEJM199406023302204
- Schroeder, W. J., Lorensen, B., & Martin, K. (2004). The visualization toolkit: An object-oriented approach to 3D graphics. Kitware.
- Seed, W. A., & Wood, N. B. (1971). Velocity patterns in the aorta. Cardiovascular Research, 5(3), 319–330. https://doi.org/https://doi.org/10.1093/cvr/5.3.319
- Smith, W. S., Lev, M. H., English, J. D., Camargo, E. C., Chou, M., Johnston, S. C., Gonzalez, G., Schaefer, P. W., Dillon, W. P., Koroshetz, W. J., & Furie, K. L. (2009). Significance of large vessel intracranial occlusion causing acute ischemic stroke and TIA. Stroke, 40(12), 3834–3840. https://doi.org/https://doi.org/10.1161/STROKEAHA.109.561787
- Spencer, M. P., & Reid, J. M. (1979). Quantitation of carotid stenosis with continuous-wave (CW) Doppler ultrasound. Stroke, 10(3), 326–330. https://doi.org/https://doi.org/10.1161/01.STR.10.3.326
- Strandness, D. E., & Sumner, D. S. (1975). Hemodynamics for surgeons. Grune & Stratton.
- Sun, H. T., Sze, K. Y., Tang, A. Y. S., Tsang, A. C. O., Yu, A. C. H., & Chow, K. W. (2019). Effects of aspect ratio, wall thickness and hypertension in the patient-specific computational modeling of cerebral aneurysms using fluid-structure interaction analysis. Engineering Applications of Computational Fluid Mechanics, 13(1), 229–244. https://doi.org/https://doi.org/10.1080/19942060.2019.1572540
- Sutalo, I. D., Bui, A. V., Ahmed, S., Liffman, K., & Manasseh, R. (2014). Modeling of flow through the circle of willis and cerebral vasculature to assess the effects of changes in the peripheral small cerebral vasculature on the inflows. Engineering Applications of Computational Fluid Mechanics, 8(4), 609–622. https://doi.org/https://doi.org/10.1080/19942060.2014.11083311
- Taylor, C. A., & Figueroa, C. A. (2009). Patient-specific modeling of cardiovascular mechanics. Annual Review of Biomedical Engineering, 11(1), 109–134. https://doi.org/https://doi.org/10.1146/annurev.bioeng.10.061807.160521
- Tezduyar, T. E., & Osawa, Y. (2000). Finite element stabilization parameters computed from element matrices and vectors. Computer Methods in Applied Mechanics and Engineering, 190(3-4), 411–430. https://doi.org/https://doi.org/10.1016/S0045-7825(00)00211-5
- Toloui, M., Firoozabadi, B., & Saidi, M. S. (2012). A numerical study of the effects of blood rheology and vessel deformability on the hemodynamics of carotid bifurcation. Scientia Iranica, 19(1), 119–126. https://doi.org/https://doi.org/10.1016/j.scient.2011.12.008
- Trudnowski, R. J., & Rico, R. C. (1974). Specific gravity of blood and plasma at 4 and 37°C. Clinical Chemistry, 20(5), 615–616. https://doi.org/https://doi.org/10.1093/clinchem/20.5.615
- Updegrove, A., Wilson, N. M., Merkow, J., Lan, H., Marsden, A. L., & Shadden, S. C. (2017). Simvascular: An open source pipeline for cardiovascular simulation. Annals of Biomedical Engineering, 45(3), 525–541. https://doi.org/https://doi.org/10.1007/s10439-016-1762-8
- Vignon-Clementel, I. E., Figueroa, C. A., Jansen, K. E., & Taylor, C. A. (2006). Outflow boundary conditions for three-dimensional finite element modeling of blood flow and pressure in arteries. Computer Methods in Applied Mechanics and Engineering, 195(29-32), 3776–3796. https://doi.org/https://doi.org/10.1016/j.cma.2005.04.014
- Vignon-Clementel, I. E., Figueroa, C. A., Jansen, K. E., & Taylor, C. A. (2010). Outflow boundary conditions for 3D simulations of non-periodic blood flow and pressure fields in deformable arteries. Computer Methods in Biomechanics and Biomedical Engineering, 13(5), 625–640. https://doi.org/https://doi.org/10.1080/10255840903413565
- Wang, B. H., Leung, A., & Lownie, S. P. (2016). Circle of Willis collateral during temporary internal carotid artery occlusion II: Observations from computed tomography angiography. Canadian Journal of Neurological Sciences / Journal Canadien des Sciences Neurologiques, 43(4), 538–542. https://doi.org/https://doi.org/10.1017/cjn.2016.10
- Wilson, N., Wang, K., Dutton, R. W., & Taylor, C. (2001). A software framework for creating patient specific geometric models from medical imaging data for simulation based medical planning of vascular surgery. In W. J. Niessen & M. A. Viergever (Eds.), International conference on medical image computing and computer-assisted intervention (pp. 449–456). Springer.
- Xiao, N., Alastruey, J., & Alberto Figueroa, C. (2014). A systematic comparison between 1-D and 3-D hemodynamics in compliant arterial models. International Journal for Numerical Methods in Biomedical Engineering, 30(2), 204–231. https://doi.org/https://doi.org/10.1002/cnm.2598
- Yamamoto, T., Mori, K., Yasuhara, T., Tei, M., Yokoi, N., Kinoshita, S., & Kamei, M. (2004). Ophthalmic artery blood flow in patients with internal carotid artery occlusion. British Journal of Ophthalmology, 88(4), 505–508. https://doi.org/https://doi.org/10.1136/bjo.2003.025809
- Zhou, H., Sun, J., Ji, X., Lin, J., Tang, S., Zeng, J., & Fan, Y. H. (2016). Correlation between the integrity of the circle of Willis and the severity of initial noncardiac cerebral infarction and clinical prognosis. Medicine, 95(10), e2892. https://doi.org/https://doi.org/10.1097/MD.0000000000002892
- Zhu, G., Yuan, Q., Yang, J., & Yeo, J. H. (2015a). Experimental study of hemodynamics in the circle of Willis. Biomedical Engineering Online, 14(1), 1–15. https://doi.org/https://doi.org/10.1186/1475-925X-14-S1-S10
- Zhu, G., Yuan, Q., Yang, J., & Yeo, J. H. (2015b). The role of the circle of Willis in internal carotid artery stenosis and anatomical variations: A computational study based on a patient-specific three-dimensional model. Biomedical Engineering Online, 14(1), 1–19. doi:https://doi.org/10.1186/s12938-015-0105-6