
 ?Mathematical formulae have been encoded as MathML and are displayed in this HTML version using MathJax in order to improve their display. Uncheck the box to turn MathJax off. This feature requires Javascript. Click on a formula to zoom.
Abstract
With airborne transmissions found as one of the major transmission routes of SARS-CoV-2, its transmission in airliner cabin environments drew special attention due to high number of imported cases and in-cabin transmissions. This study numerically investigated the transmission of COVID-19 by cough-induced particles in a cabin section of Boeing 737 model. One passenger was coughing in each case, while cough particles with measured size distributions were released during coughs and were tracked using the Lagrangian framework. Outcomes revealed that cough flow released by passengers could develop rapidly into a strong turbulent cough jet, breaking up the local airflow field. The released cough particles were largely dominated by the cough jet within 5 s, especially the first 1.5 s. Deposition of particles under 100 µm were relatively delayed when released from a window-seat location. Small particles (under 50 µm) released by a window-seat passenger were more likely to spread widely in the studied cabin section, which could lead to the highest exposure risks to nearby passengers. Also, due to ventilation design and seating arrangement, cough particles released by the middle-seat passenger were found easily trapped in his/her own local environment. Cough particles released from aisle-seat passengers had the least exposure risk to adjacent passengers.
Introduction
The global coronavirus disease 19 (COVID-19) pandemic continues to impact our lives and the world economy (McKibbin & Fernando, Citation2020), which has resulted in over 100 million confirmed cases worldwide (Johns Hopkins University, Citation2020). Compared with the 2003 Severe Acute Respiratory Syndrome (SARS) pandemic, COVID-19 transmission is more difficult to prevent due to its high contagion and severity (Evans, Citation2020). From the latest report by the Texas Medical Association (TMA), traveling by plane is indicated as moderate-to-high risk during this pandemic (Annear & Cooper, Citation2020). Most countries have rolled out restrictive measures, such as lock-down, suspension of airline operation, etc., to prevent an overwhelming number of cases being imported from overseas. However, since an infected individual is highly contagious even before the occurrence of any symptoms, the possibility of in-flight transmission is inevitably increased (Anderson et al., Citation2020; He et al., Citation2020). A deepened understanding of virus transmission, therefore, is crucial in helping local authorities to mitigate the in-flight spread of droplets.
With soaring demands on containing the pandemic, the world is continuing to perform many investigations to obtain information about the disease. The predominant production of COVID-19 was identified as being during human-to-human respiratory activities (speaking, coughing or sneezing), which releases large droplets, surface contaminants and aerosols (Evans, Citation2020). The droplets ejected by expiratory events can generate thousands of droplets with a magnitude ranging from 0.1 to 1000 µm (Mittal et al., Citation2020). A more devastating factor is that asymptomatic COVID-19 infectors could generate over 103 virion-containing aerosols in just one minute of speaking loudly (Stadnytskyi et al., Citation2020). Several case studies on the possibility of virus transmission in both indoor and outdoor spaces found that indoor transmission appears to be more common, severe and contagious (Feng, Marchal, et al., Citation2020; Qian, Yang, et al., Citation2020). In confined areas with densely gathered people, the released infectious aerosols picked up by the airstream can be suspended over a long period of time in relatively high concentrations, thereby raising the chances of inhalation (Buonanno et al., Citation2020). In addition, more evidence has revealed that these asymptomatic patients are capable of spreading the virus during the incubation period (14 days) and can be the key drivers for most of the viral infection cases (up to 79%) (Asadi et al., Citation2020). This evidence explained the reasons why cross-infections were so severe during flights. Inside the cabin environment where passengers are seated close to one another, the concentration of infectious aerosols via the respiratory activities of asymptomatic passengers gradually escalates over time, causing high exposure risks to neighboring passengers (Liu et al., Citation2020; Wei et al., Citation2020). Considering the much higher reproduction number (R0) of COVID-19 compared to SARS (Liu et al., Citation2020), an airliner cabin is an ideal environment for disease transmission, with potentially more lethal consequences. Recent studies conducted by Qian, Miao, et al. (Citation2020) and Yang, Shen, et al. (Citation2020), who applied retrospective investigations in Zhejiang, China, found that in excess of 10% of passengers could be infected during flight. Ventilation rate, associated airflow patterns, and other vital factors could all serve to modulate the pathway of disease transmission.
Numerous studies investigating the fate of respiratory droplets in indoor environments have shown that transmission is significantly influenced by ventilation strategies, obstacles (Li et al., Citation2007; Qian et al., Citation2006; Wei & Li, Citation2015), thermal plumes generated by the human body (Li, Yan, et al., Citation2015), and human movements and behavior (Edge et al., Citation2005; Tao, Citation2018). Although these factors have prime roles in determining the contaminant trajectories and distribution in traditional indoor spaces, the situation in cabin environments is more complex. When compared to traditional indoor spaces, cabin environments are noteworthy due to the structure of obstacles (seating arrangements, etc.), dense occupation by passengers, and a more sophisticated ventilation scheme (personalized gaspers and well-mixed ventilation). Most existing studies in cabin environments have placed more emphasis on investigating the overall transport pattern of contaminants and achieving large-scale cabin modeling using over-simplified passenger models (Gupta et al., Citation2011a, Citation2011b). However, one vital component, the micro-environment of each passenger, has been overlooked. In a densely occupied cabin, the micro-environment of each passenger could potentially merge and form a larger local environment with other passengers seated in the same row. Owing to this factor, the ascending thermal plume from passengers would be significantly enlarged (Yan, Li, & Tu, Citation2016). Compared to a standing posture, the thermal plume induced through sitting can accelerate the upward velocity at the top of the head (Feng, Bi, et al., Citation2020), particularly when passengers are largely sedentary. Further to this, in many existing studies, the detailed release conditions of contaminants have been mostly overlooked due to the time-consuming and costly modeling of cabin environments. However, real respiratory activities (e.g. coughing or sneezing) can generate a very strong jet flow and have significant impacts on the initial transport characteristics of contaminants in passengers’ local environment (Chao et al., Citation2009; Dudalski et al., Citation2020). For a highly infectious virus such as COVID-19, it is essential to capture its instantaneous transport characteristics after its exhalation.
Among all human respiratory activities, coughing seems to be the most significant pathway for aerosol and droplet transmission (Wei & Li, Citation2015). It generates higher expiratory speeds with elevated droplet concentrations; close to 3000 droplets could be generated in a single cough (Fellouah et al., Citation2009; Mittal et al., Citation2020). The cough flow is identified as a round jet with a leading vortex, which has similarities to a puff (Fellouah et al., Citation2009). The maximum speed of the jet flow of coughing has been measured to be approximately 20 m/s, which plays an important role in determining its entire velocity profile (Kwon et al., Citation2012). In the indoor environment, the droplets expelled via coughing can be suspended in the air for a prolonged period owing to the indoor airflows (Ai & Melikov, Citation2018). Another study conducted by Yan et al. (Citation2019) found that ascending thermal flow was the key driver of delayed droplet deposition time and extended traveling distance, especially for smaller expelled droplets in a quiescent indoor space. Although numerous studies have identified these impacts in indoor spaces, little analytic attention has been paid to the cabin environment. It follows that airborne transmission through aerosols and droplets by coughing in an airliner should be put in the spotlight. Owing to narrow seating arrangements in a confined space, along with complex cabin environmental variables, measuring cough flow during flights or in a cabin environment could be ineffective as well as extremely costly. Numerical simulation, on the other hand, could achieve this in a more cost-effective way (Elmaghraby et al., Citation2018) and with advancements in the mathematical application CFD methods, the results could be predicted more robustly and effectively (Ghalandari et al., Citation2019; Salih et al., Citation2019). It is essential to investigate the influence of cough jets on droplet transport and its characteristics.
With increasing studies on droplet fluid dynamics and their transport characteristics during the pandemic, recent experimental measurements in a Boeing 767 showed that aerosol exposure risk was typically highest in the row of an index patient, which indicated that passengers seated close to the index patient were the most susceptible (Silcott et al., Citation2020). Several numerical case studies were conducted aiming to understand airborne transmission in traditional indoor spaces such as classrooms (Abuhegazy et al., Citation2020) and outdoor spaces considering real coughing processes (Feng, Marchal, et al., Citation2020). These studies showed the importance of droplet size in determining their transport behavior and deposition. In this paper, a more complex cough scenario was studied in an airliner cabin section. The main purpose of this work was to analyze the transport characteristic of COVID-19 particles induced by coughing and the cough flow effect on the local airflow, particularly in a single row cabin. The coughing process with specified velocities released thousands of particles from various passengers in a one-row economy cabin section based on a widely serving aircraft – the Boeing 737. Detailed coughing and particle release processes were studied through transient simulations, considering real size distributions of cough droplet nuclei. The time-dependent effects of turbulent cough jets on particle dispersion and deposition were carefully investigated. The outcomes of this study investigated the cough-jet effect, particle transport and its deposition fraction in a typical cabin environment. Quantitative studies were carried out to explore the exposure risks to passengers seated in the airliner cabin, with which to prepare a better understanding against in-flight transmission.
Methods
Geometry and mesh
As one of the most widely serving narrow-bodied airliners, a three-dimensional Boeing 737 cabin model was developed to study cough-induced contaminant transport characteristics. Considering the highly symmetrical structure of the airliner cabin, half the cabin section was utilized to save computational cost. Realistic dimensions were used to build the computational model, as shown in (1.02 × 1.65 m2 in area and 2.15 m in height). Three seated passengers were included at various locations, known as window-seat passenger (A), middle-seat passenger (B), and aisle-seat passenger (C), respectively.
Figure 1. Schematic of the computational domain with three passengers, hybrid mesh details of the manikins and the initial flow pattern.
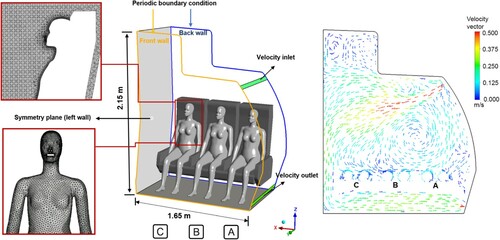
In terms of the ventilation layout of Boeing 737 economy cabins, the air inlet diffuser was located at the upper side of the cabin wall, whereas the airflow leaves the domain from the floor grilles. Three computational thermal manikins (CTMs) with detailed features from our previous work (Yan, Li, Yang, et al., Citation2016) were employed in this study as seated passengers. The meshing process was conducted by ANSYS® ICEM™ 18.2, by which the entire domain and CTMs were discretized by an unstructured tetrahedron mesh. Mesh was locally refined with ten inflation layers applied near CTM surfaces so as accurately to capture the detailed gradient change of important parameters (e.g. velocity, temperature, etc.). Also, y + <5 was achieve on the surface of each CTM during the simulations. Mesh independence tests were conducted with four sets of mesh settings and were achieved at a total number of mesh elements of 2.1 million, in which 90% of mesh quality was above 0.8. Further refining the mesh only contributed less than 5% deviations on velocity magnitudes.
Boundary conditions
Since the airflow pattern was highly symmetric along the center plane of the entire cabin section (Wang et al., Citation2020), the symmetry plane was applied in the model as demonstrated in . To save the computational cost, periodicity was employed to both front and back planes of the selected section. This setting could avoid the unreal air recirculation trapped near the front or back boundaries and would significantly reduce the computational resources when focusing only on the local environment. A convective heat load of 35.6 W was applied at each manikin, which was consistent with the existing literature (Kurazumi et al., Citation2008). Since the CTMs were the main heat sources in the domain, the solid walls (e.g. floor, seats, etc.) were assumed to be adiabatic; the heat transfer through these walls was therefore not considered in this paper. The air conditioning of this commercial airliner follows the Refrigerating and Air-condition Engineering (ASHRAE) aviation standard for acceptable indoor air quality. The minimum air supply required for the passengers should be at least 9.4 L/s per person, which is equivalent to a mass flow rate of 0.04 kg/s in this study. The air temperature was set to 20°C for the inlet to ensure flight safety and passenger comfort (ASHRAE, Citation2016).
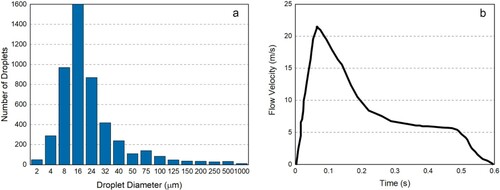
In terms of the coughing process, its size distribution and numbers of expelled particles through a single cough were set according to experimental measurements (Bourouiba et al., Citation2014). As the evaporation status was not clearly stated in the experimental data, droplet size reduction due to evaporation was not considered in this study to keep the size distribution consistent with the experimental measurements. The particle diameter in this simulation was largely distributed from a minimum of 2 µm to a maximum of 1000 µm. The largest number fraction of a single cough was dominated by 8–16 µm particles as illustrated in (a). Particles were expelled from the mouths of passengers A, B and C, respectively, from an equivalent mouth opening of approximately 2.5 cm2. The instantaneous velocity of a single cough and its flow rate profiles were based on the results of experiments conducted by Gupta et al. (Citation2009). A time-dependent velocity function was fitted to their measurements and a summary of particle flow velocity is illustrated in (b).
Figure 2. Cough flow release condition: (a) number of released particles; (b) velocity profile of the cough flow.
Three transient simulations considering a real coughing process were further calculated based on the steady-state results. These simulations were conducted to capture the time-dependent effect of the cough jet on the local airflow and released particles. Each cough was released from a different passenger’s mouth at a time. The description of each case is outlined in . Case 1 was where particles were released from the window-seat passenger (A); case 2 was from the middle-seat passenger (B); and case 3 was from the aisle-seat passenger (C). Cough particles were assumed to be fully trappable on the cabin walls (floor, seats, etc.) as they are primarily made of highly absorptive material (e.g. fabric). The particles were assumed to be fully escapable from the outlet, while only fresh air was entering the cabin via the ventialted air supply. In terms of the time steps of each transient simulation, a total of ten seconds were used to track the development of cough flow and particle dispersion. Since a single cough process finished within 0.6 s, a very small time step of 0.01 s was set initially during the coughing release period (0–0.6 s), followed by a gradually increased time step to 0.05 s per time step after the completion of the coughing process (0.6–10 s). All the transient simulations were performed using commercial CFD software ANSYS CFX. Convergence was achieved when the RMS residual of the continuity equation decreased to be lower than 1 × 10⁻⁶. Cough released particles were assumed to be fully deposited when reaching surfaces in the cabin section (e.g. floors, seats and cabin walls), owing to the fact that the materials on these boundaries in typical cabin interior are highly absorbant materials (wool or nylon carpet, leather upholstery, fabric, etc.).
Table 1. Summary of the three cases.
Mathematical model
The present study was performed using commercial CFD software ANSYS CFX, to predict the local airflow and particle transport. For a typical cabin environment, the airflow pattern is dominated by both natural convection flow (thermal plumes) and forced convection flow (air-supply jet), in which the variation of density is related to temperature difference. The Reynolds Averaged Navier–Stokes (RANS) solver with the Boussinesq approximation was employed in this study, to solve the continuity and momentum equations of the buoyancy driven flow induced by the heated manikins. The density terms only appear when it is multiplied by gravity. The thermal expansion of air was calculated with respect to a reference density ρref by
(1)
(1)
where β is the coefficient of thermal expansion. The density variation is only important in the buoyancy term.
The features of the turbulent airflow were modeled using the RNG k–ε model owing to its successful application in indoor spaces (Chen, Citation1995; Rohdin & Moshfegh, Citation2007). Many previous studies validated its good predictions for high Reynolds number turbulent flow generated within a low velocity indoor environment (Yan et al., Citation2019). It was also more robust and accurate in solving cabin airflow compared with the standard k–ε model, realizable k–ε model and SST k–ω model (Li et al., Citation2018; You et al., Citation2016). The SIMPLEC algorithm implemented in ANSYS CFX was applied for velocity–pressure coupling and the application of the high-resolution advection scheme was utilized to obtain more accurate and robust results. Five thousand trajectories were released during each cough and were solved using the Euler–Lagrange approach. In a continuous fluid, the dominating forces on micro-sized particle motions are the drag force, FD, and the buoyancy force, FB (ANSYS, Citation2009), which are expressed in Equations (2)–(4):
(2)
(2)
(3)
(3)
(4)
(4)
where mp is the mass of the particle, CD is the drag coefficient, AF is the effective particle cross section, UF is the fluid velocity, Up is the particle velocity, and g is the gravity vector.
To track the turbulent dispersion of particles in this study, the characteristics of each eddy, fluctuating velocity, , length,
, and lifetime,
, were added into the calculation, as shown with the following Equations (6)–(8):
(5)
(5)
(6)
(6)
(7)
(7)
where k and ε are the local turbulent kinetic energy and dissipation, respectively. Cµ represents turbulence constant. is a normally distributed random number used for the randomness of the turbulence about a mean value.
Results and discussion
Airflow field
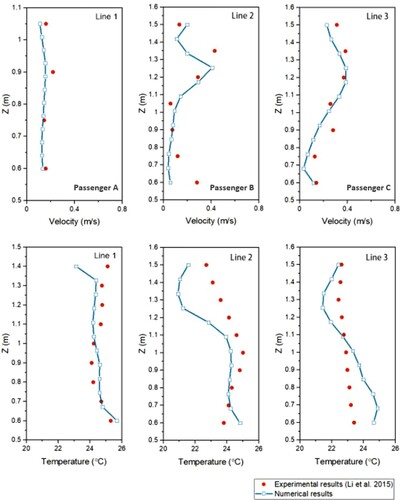
Based on the aforementioned methodology with consideration of the real coughing process, the aim of this study was to investigate the cough-jet effect on local airflow and released particles in each case. A steady case was simulated as the initial value before conducting three transient simulations with coughing processes. The local airflow field was first investigated and validated, and the results yielded from the CTMs and ventilation schema are displayed in , which illustrates the initial steady state of the local airflow pattern. The supply air entering from the inlets forms a strong air re-circulation zone near the window-seat passenger, where the ascending airflow traveled further anti-clockwise along to the aisle-seat passenger. The computational model was further validated by the previous experimental results based on a seven rows 737 cabin mock-up (Li, Zhao, et al., Citation2015). The data obtained in their previous studies used hot-sphere anemometers and infrared thermometers to measure the local velocity and temperature fields, respectively. Results from three vertical lines inside the cabin model were extracted to compare against the experimental data, as shown in . The lines were selected based on the measured locations, which were approximately 0.15 m (on the y-axis) in front of each passenger’s mouth. As can be noticed from , the velocity profiles predicted from numerical cases were highly consistent with the experimental data, which only contributed a few deviations in all three lines. It was also noticed that the difference in terms of temperature gradient was slightly larger. The deviation regarding the temperature distribution may be for the following reasons. Firstly, the manikin models used in the experimental studies were without arm segments, while the CTMs employed in this study contained full body segments and features. The additional arms of CTMs from the simulations could cause additional local heat generation and lead to deviations of temperature gradient. Secondly, the slight geometric differences on the cabin model could also cause deviations of the temperature profiles. Overall, the temperature profiles were still within a reasonable range compared to the experimental results. It was evident that our numerical results were in a good agreement with existing experimental measurements.
Figure 3. Velocity and temperature validation at selected lines.
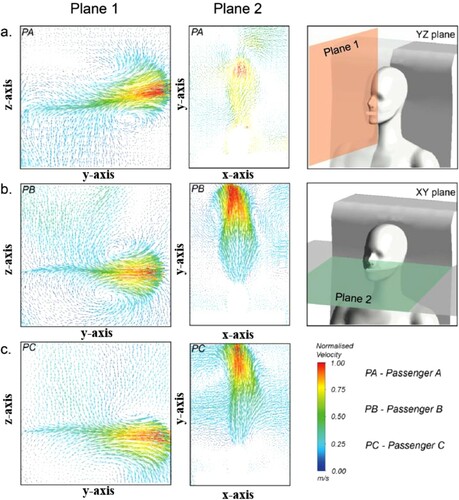
Three unsteady simulations were then conducted by adding coughing processes from passengers A, B and C, respectively. The impact of cough-jet flow obtained from each case was analyzed by plotting a vector figure, as demonstrated in . Two cross-section planes in each passenger’s breathing zone were extracted to compare the cough-jet effects after the completion of the cough (t = 0.6 s), respectively. Plane 1 (vertical – Y-Z) and Plane 2 (horizontal – X-Y) were extracted from the centerlines of each passenger’s mouth. As can be seen, the cough jet significantly broke up the relatively uniform flow field while the cough-jet trend differed noticeably in each case. Owing to the large counter-clockwise vortex induced by the local ventilated air supply, the cough jet released by passenger A obviously ascended after interacting with the returning ventilated flow, as illustrated in (a). Also, as observed from the horizontal plane, owing to close interaction with the ascending ventilated flow, the cough jet was largely mitigated in passenger A’s breathing zone. In (b), since the ventilated flow was separated and started to return from the middle-seat passenger, the cough flow released from passenger B ((b)) mainly traveled further and had fewer interactions with the ventilated airflow. It can be noticed in (c), owing to the anti-clockwise airstream induced by the local ventilated flow, the cough jet released by passenger C was largely suppressed and tended to travel downwards. It is evident from the results that, overall, cough flow released in cases 1 and 3 interacted considerably with the local airflow pattern and in line with its development. The turbulent flow induced by cough jets was found to be significant in the breathing zones of passengers B and C when they were coughing (Figures (b) and (c)). The induced turbulent flow could play a dominant role in the initial transport pattern of cough particles after release.
Figure 4. Vector plot of cough flow at 0.6 s released by: (a) passenger A; (b) passenger B; (c) passenger C.
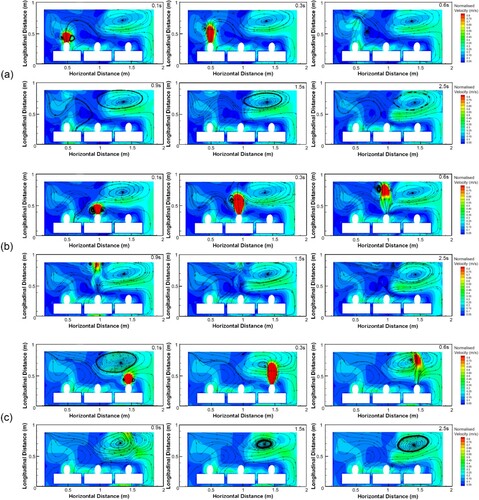
A detailed comparison regarding the time-dependent development of cough jets was further analyzed, as illustrated in . Plane 2 was used for the velocity contour and streamline plot of the simulated result via six time-steps (0.1 s, 0.3 s, 0.6 s, 0.9 s, 1.5 s, 2.5 s), respectively. It can be noticed clearly that the cough jet had a strong domination in the first few seconds in all cases. Although these results obtained in terms of the initial velocity profile were similar, its time-dependent development varied among the three cases. Prior to cough release, a strong air recirculation zone was observed in front of passenger C’s local environment. When the cough flow was conducted in the simulation and released by passenger C, the cough flow developed swiftly as a cough jet and interacted intensively with the ventilated flow during the releasing period (up to 0.6 s), as shown in (c). Separation of the local air recirculation induced by the cough jet was observed at 0.6 s. That cough flow developed further, while the observed air recirculation was not restored until 1.5 s. However, the scene differed in the other two cases. The cough flow released by passenger B still dominated the local airflow in the breathing zone in the first 0.6 s, but the development of the cough jet was not fully capable of breaking up the nearby air recirculation located in front of passenger C. That is to say, the cough jet induced by passenger B can slightly intervene into the adjacent local environment. It was noticed from (b) that a higher velocity profile still existed at 0.9 s. This indicated that the ventilated air supply contributed less impact to passenger B’s local airflow field; thereby, the cough jet was relatively more dominating in case 2. The cough jet developed at passenger A’s local environment revealed similar development patterns to the other two cases while, owing to the returning (ascending) airflow field, the cough flow tended to travel upwards from the breathing zone. The velocity profile of this induced cough jet was quickly alleviated from the extracted plane 2 even before the completion of the coughing process. It was therefore speculated that, at the window-seat passenger’ location, the generated thermal plume and its local airflow contributed a larger impact on the released cough flow, which demonstrated that the interaction between airflow and cough flow was more severe. The results obtained from each case seemed to indicate that the effect of the cough flow in this limited space could last for approximately 1.5 s, and the cabin flow could be reasonably restored after 2.5 s in all cases. In addition, because of the limited seating arrangement, the cough flow released in all three cases was trapped and not capable of leaving its local environment. It was concluded that the cough flow can be limited by this typical cabin space, where the cough flow could only travel further, up to a maximum of 0.55 m.
Figure 5. Time-dependent contour and streamlines plot of cough flow released by: (a) passenger A; (b) passenger B; (c) passenger C.
Particle transport characteristics
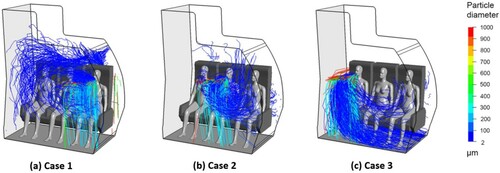
Numerous studies have indicated that droplet size plays a vital role in determining aerosol transport in an indoor environment (Ai & Melikov, Citation2018; Gupta et al., Citation2011a; Morawska, Citation2006; Xie et al., Citation2007; Yan et al., Citation2017). In the context of fluid dynamics, droplet size considerably impacts on the droplet’s fate – suspension or deposition. The present study considered the full size range of cough droplet-nuclei (2–1000 µm) and their real releasing process by using a Lagrangian framework to investigate their time-dependent development and transport characteristics in a typical aircraft cabin. The possibility of infection greatly depends on the spatial–temporal distribution of the exhaled particles from the index patients. Therefore, cough particles were assumed to be released from each passenger’s mouth in the first 0.6 s and tracked for an entire 10 s. Ten seconds were sufficient to capture the cough-jet effect on the passengers’ local micro-environment. shows the effect of a cough jet on the particle trajectories released from each passenger’s mouth. The trajectories of (2–1000 µm) particles were noticeably different in the three cases within the simulated period (10 s), which was mostly consistent with local ventilated flow as mentioned in the previous section. However, different particle sizes can contribute significant deviations. Large particles were deposited in a short distance in three cases, while small-size particles were more likely to be carried by the local airflow. According to (a), based on the returning airflow field, small particles largely traveled upwards and closely followed the counter-clockwise vortex. Reasonable differences were observed in the other two cases (cases 2 and 3). It is worth noting that released particles were mostly trapped in case 2, as illustrated in (b). Small particles released by passenger B followed the air-recirculation zone and tended to ascend to near the window-seat passenger. Owing to the lower velocity observed in that region from , the impact of the ventilated flow was significantly reduced and the particles were suspended at the front, which is in line with our explanation in the previous section. It can be inferred that his/her own exposure risk is significantly increased if harmful droplets enter into passenger B’s local environment. In terms of case 3, the trajectories of particles from passenger C revealed a strong interaction with the ventilated flow; the particles were largely suppressed by the descending airstream and tended to deposit on the ground. Respiratory particles followed the local airstream and then traveled towards the outlet along the floor. The results in (c) demonstrate that the dispersion of particles was suppressed by the cabin ventilation and thereby the related exposure risks to other passengers appeared to be much lower. To evaluate the time-dependent development of the cough particles more extensively, case 2 was studied further.
Figure 6. Particle trajectories within 10 s released by: (a) passenger A; (b) passenger B; (c) passenger C.
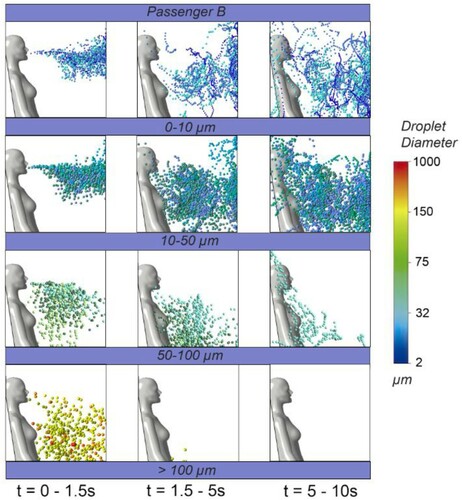
A qualitative analysis was then conducted to illustrate the time-dependent trajectories of the particles released by passenger B with various size classifications (i.e. 0–10 µm, 10–50 µm, 50–100 µm, and >100 µm), respectively, as shown in . It was noticed that the respiratory-induced particles were highly controlled by the cough jet in the first time interval (0–1.5 s), the particles traveled further horizontally and reached the seat in front. Larger particles, on the other hand, tended to settle rapidly in the first 1.5 s owing to gravity, particularly for particle sizes over 100 µm. During the period from 1.5 to 5 s, the effect of the cough flow was significantly reduced, the ventilated flow and passengers’ thermal plumes began to escalate their impact on the dispersion of the released particles. These factors appeared to delay the settling of larger particles (50–100, over 100 µm), while smaller size particles (0–10 and 10–50 µm) were relatively more buoyant, and thus remained suspended in the air. In the third time interval, owing to the limited seating arrangement, cough particles ejected by passenger B were more likely to bounce back from the seat in front and return to the passenger’s breathing zone after 5 s. From 5 to 10 s, particles were highly dominated by local airflow and passengers’ thermal plumes, and the cough-jet effect on particles was almost fully lost. It can be observed that, in this particular situation, large particles settled much more quickly than small particles. This is mainly because, for large particles, a higher Stokes number can lead to less effect of viscous dissipation forces. In addition, as particle size increases, the inertia terms of the particle become more dominant from the governing equation, resulting in a moe ballistic trajectory for the larger particles. The smaller particles, on the other hand, can be carried more easily by the drag force caused by the ventilated flow, losing their initial momentum and being rapidly affected by the viscous dissipation effect. Thus, the ventilation will keep the small particles suspended in this local region. These effects are weakened with larger self-weight particles. Particles of size group 50–100 µm are approximately the largest size group that can be carried by local flow after 5 s. Beyond this size group, it is reasoned that particles are more dominated by their initial momenta.
Figure 7. Particle trajectories after release by passenger B in three time-regions (0–1.5 s, 1.5–5 s, 5–10 s).
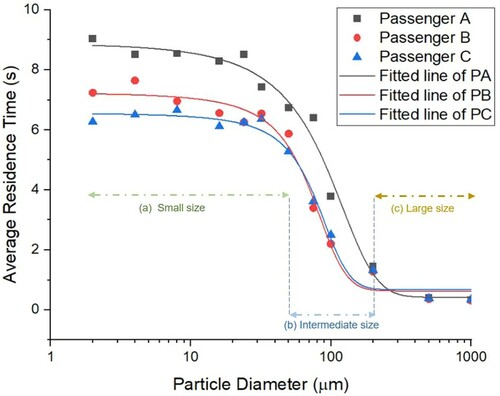
Three particle size groups were then reclassified based on the specific characteristic observed from the results. One of the important parameters, the residence times of the particles in relation to various sizes, were quantitatively analyzed, as demonstrated in . The average residence time is used to describe how long a particle of interest stays in the domain. In this study, the residence time was determined when the particle was either trapped by the absorbant materials or escaped from the outlet. Small size (< 50 µm), intermediate size (50–200 µm) and large size (> 200 µm) particles were investigated in the three cases, respectively. When cough particles were released by passenger A, the small-size group contributed the longest residence time (up to 9 s) owing to the ascending ventilated air and the enlarged thermal plume, such that the particles were suspended longer in the local environment. In case 2, the aforementioned lower velocity of the vortex had less impact on the dispersion of the contaminants, which resulted in a lower residence time of that size group compared to case 1. However, the residence time was significantly reduced in case 3 because of the strong anti-clockwise airflow, which effectively suppressed suspension of the small particles (< 50 µm), the residence time of which reduced to approximately 6 s. It can be speculated that, when small particles are released from different locations, the ventilated convection is more dominant on their trajectories. For the intermediate size group, the dominant ventilated convection alleviates its impact on the particles, for which a sudden drop is observed in all three cases. The initial momentum and kinetic energy started to be more dominant. With the recirculation airflow effect in front of the window-seat passenger compared with other regions, the residence time in case 1 was relatively higher, indicating higher kinetic energy gained from local air supply to these particles, making them travel further in the domain. For the other two cases, the results appear to be nearly identical. It is certain to conclude that the particles were more likely to be suspended when released from passenger A. For the large size group (over 200 µm), the particle characteristics were almost identical among all three cases, which revealed a really short deposition time (up to 1 s). That is to say, in a typical cabin environment, particles over 200 µm settled down in approximately one second and were intensively dominated by their weight and inertia. There was no detectable difference for this size group between the seating locations.
Figure 8. Impact of particle diameter on average residence time.
Five representative particle sizes (i.e. 4, 16, 50, 100 and 200 µm) were further utilized to investigate their velocity development along the horizontal and vertical directions, as shown in . The positive horizontal velocity represented particles traveling to the right-hand side, whereas negative velocity means traveling in the opposite direction. Also, a positive vertical velocity indicated the particle was ascending, and the converse meant descending. The velocity profiles of 4–16 µm particles in case 1 were completely different from the other two cases. It can be noticed that, when the coughing process ended, the particles traveled horizontally to the right, while their vertical velocity highly fluctuated in the 10 s. This indicated that the particles were suspended widely and dispersed to the aisle-seat passengers in the entire 10 s tracking time. On the other hand, small cough particles (4–16 µm) traveled horizontally to the left in both cases 2 and 3, whereas the particles released from the middle-seat passenger had lower negative horizontal velocity, which indicated slower traveling speed to the left compared to case 3. For case 2, the velocity fluctuated in the 10 s in both the horizontal and vertical directions. The initial momentum induced by the cough jet provided high velocity for the particles and the effect lasted for approximately 4 s. And a lower velocity was observed afterwards, indicating that the smaller particles almost fully lost their initial kinetic energy induced by the cough. That is to say, the particles were trapped in passenger B’s local environment, hardly dispersing to the adjacent passengers’ locations in the first 10 s. In terms of case 3, the small particles (4–16 µm) were consistently deposited and traveled to the outlet in all ten seconds. As a result, for the small size of particles, they were more easily suspended when released by passengers A and B, whereas particles released by passenger C were effectively suppressed by the strong air recirculation.
Figure 9. Horizontal and vertical velocity of time-dependent particles for five sizes (4 µm, 16 µm, 50 µm, 100 and 200 µm).
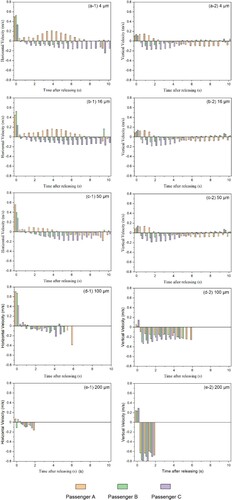
For particles in the intermediate group (50–100 µm), the profile changed significantly. The velocity fluctuation still remained for 50 µm particles in both cases 1 and 2, while it disappeared for the larger particles (i.e. 100–200 µm). This indicated that the local ventilated airflow was not capable of providing sufficient momentum and kinetic energy to these particles to keep them traveling in the air.
With regard to 100 µm particles, as shown in Figures (d–1) and (d–2), the particle velocity profile was highly consistent in all three cases. All particles quickly deposited towards the cabin floor within 6 s, whereas at passenger C’s location, it shortened to approximately 4 s. However, for the large size (200 µm) particles, as shown in Figures (e–1) and (e–2), depositions were largely shortened to 2 s. It was noticed that, the larger the particles were, the faster the particles deposited, and the shorter the time spent on gravitational sedimentation. The deposition velocity of 200 µm was doubled compared with 100 µm and even quadrupled compared with small particles in this situation. Additionally, particles released by passengers A and B fluctuated greatly in this cabin environment, especially for particles of size smaller than 50 µm.
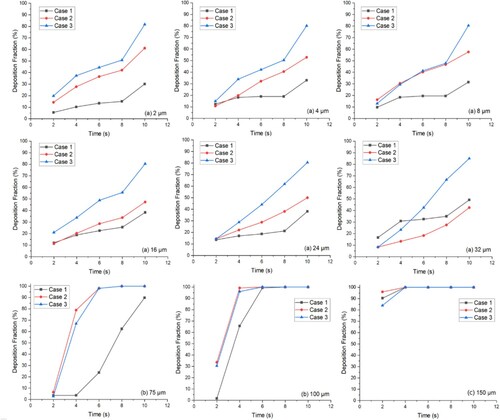
Smaller droplets could be inhaled and deposited much more easily into humans’ nasal cavities owing to their dynamic properties (Inthavong, Citation2020), and could thereby increase the exposure risk to seated passengers. Small size and intermediate size groups of the released particles were quantitatively studied further, as displayed
in , showing the influence of cough jets on the particle deposition fraction in all three cases. The deposition fraction was determined when the particle was deposited on the cabin surface or escaped from the floor grilles. In the majority of cases within the small size groups, similar behavior was observed with no sudden changes, but nevertheless, the time-dependent deposition pattern seemed to vary from particles of size of 32 µm. For smaller particles (< 32 µm), the pattern was almost identical. In the first two seconds, the particle deposition due to strong cough flow was between 10% and 20%, indicating that, wherever the cough particles were released in the cabin, the cough-jet effect on particle deposition was similar, as shown in (a). The deposition pattern differed after 2 s and then these small particles were mechanistically controlled by air turbulence and did not present significant discrepancies. It could be concluded that the deposition of small particles was highly affected by different release locations but negligibly affected by size change (e.g. from 2 to 24 µm). In the entire tracking period (10 s), nearly 30% of these particles (< 32 µm) were deposited when the particles were released from passenger A. On the other hand, roughly 50% of the particles in case 2 were deposited quickly, and approximately 90% for case 3. It was evident that these particles were not significantly affected by gravity, but instead, the ventilated flow played a significant role in determining their transport dynamics in this time domain. For the intermediate size group, the deposition pattern became more sensitive and noticeably different with increasing particle size. In the case of 75 µm particles, the deposition in cases 2 and 3 rapidly shortened to 6 s, in which approximately 100% of the particles were deposited or escaped from the simulated domain. In case 1, however, the transport dynamics of this particle size were relatively in line with small size group particles (2–50 µm), indicating that the ascending airflow potentially provided higher kinetic energy and momentum to these particles and caused them to be suspended longer in the air. The scenario became nearer identical with larger particles (100–150 µm), as shown in (b). In terms of case 1 (100 µm), the stronger airflow induced by recirculation and momentum delayed the deposition led by inertial and gravitational sedimentation. Only 65% of the particles were deposited within 4 s, whereas approximately 100% of particle deposition occurred in the other two cases. Since no significant difference was observed in (c), it could be concluded that, in a typical Boeing 737 cabin, gravitational sedimentation and particle inertia impaction were mostly dominated by particles of size 150 µm, no matter where the passenger was coughing. It is worth noting that our deposition fraction was relatively higher compared with recent simulations (Abuhegazy et al., Citation2020; Feng, Bi, et al., Citation2020; Yang, Ou, et al., Citation2020). This was mainly due to the volume size of the computational domain, as ours was much smaller and more obstacles were employed. On the other hand, the surface roughness could also impact the particle deposition (Lai & Nazaroff, Citation2005), but to avoid unnecessary variables affecting the computational results, a particle was assumed to be deposited when it hit the wall in our study.
Figure 10. Effect of particle size on deposition fraction.
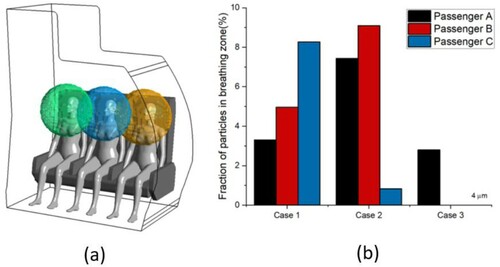
Since particles of diameter 4 µm were of a sensitive size, separating airborne and droplet transmission, and of such a size are COVID-19 particles (Redrow et al., Citation2011), their transport characteristics were investigated further. In general, the breathing zone was defined as a radius of 0.3 m from the occupant’s mouth or nose. To evaluate the exposure
risk further in all cases tested, three spheres were utilized to highlight the breathing zone of each passenger, respectively, as shown in (a) (orange – passenger A; blue – passenger B; green – passenger C). The number fraction of the representative particles (4 µm) was studied quantitatively, as illustrated in (b). This figure presented the number fraction of the particles that remained within each passenger’s local breathing environment after 10 s of tracking time. A considerable amount of difference was observed from the results. As can be seen in case 1, about 3% of the exhaled small particles could be trapped in his/her own local environment, more than 5% of the particles could intrude into passenger B’s breathing zone, and approximately 9% of particles could intrude into passenger C’s breathing zone. It was evident that, when a particle was exhaled from the window-seat passenger, the number fraction of the aerosol that remained in the middle-seat passenger’s breathing zone could be 1.5 times as much as the particles trapped in his/her local environment. This number fraction could even triple in passenger C’s local environment, which indicates that this was the worst scenario for the aisle-seat passenger. From case 2, of the number fraction of particles mostly trapped and suspended in both passenger A’s and passenger B’s breathing zones, roughly 8% of the particles could be inhaled by the window-seat passenger and about 9% by the middle-seat passenger. The aisle-seat passenger was less susceptible in this scenario, having only 1% of the aerosol remaining in his/her local environment. The results obtained in case 3 were consistent with the above discussion – the small aerosol particles can be carried effectively by the ventilated flow. However, about 3% of the aerosol particles can travel to passenger A’s breathing zone because of the ascending airflow. This suggests that virus-laden droplets released from the aisle-seat passenger present the least exposure risk to adjacent passengers.
Figure 11. Number fraction of particles remaining in each passenger’s breathing zone (radius < 0.3 m).
Conclusions
In this study, the transport of respiratory particles induced by coughing and the effect of the cough jet was carefully investigated in a typical airliner cabin environment. Three transient simulations from each passenger were employed adding real coughing processes, respectively. The outcomes showed that, under the Boeing 737 ventilation layout, the cough jet has a significant impact on the local airflow field. The cough flow can quickly interact with the local airflow and break up the air recirculation zone in this limited space, in which the cough jet was highly dominating in the first 0.6 s. After that time region, local ventilated airflow becomes more dominant, but nevertheless the cough jet remains influential on the local airflow field even after the completion of the cough. At the window-seat passenger’s location, the generated thermal plume and its local airflow contribute a larger impact on the released cough flow; the interaction between airflow and cough jet was the most severe. The high velocity profile of the cough jet no longer exists even before the completion of the coughing process (0.6 s). The cough jet from the middle-seat passenger has the least interaction with the local airflow, and the cough-jet profile can still be observed after approximately 1 s. The cough-flow effect can be limited in this environment. Its effect on local airflow lasts for approximately 1.5 s and can only travel further with a maximum of 0.55 m in all three cases.
A full size range of respiratory-induced particles (2–1000 µm) was added and released with specified cough jets within the simulation and the transport characteristics of particles and their deposition were carefully studied. The results obtained from the simulation demonstrated the particle dispersion and its relative exposure risks to adjacent passengers when considering a real coughing process. In this typical cabin environment, approximately 90% of larger particles (> 150 µm) can rapidly deposit within 2 s in all three cases. As for the intermediate size group (50–200 µm), its transport characteristics become more sensitive and noticeably different among the three cases. When 100 µm particles are exhaled by the window-seat passenger, the ascending ventilated flow near the window can reduce the gravity effect for this size group causing a 2 s delay of deposition compared with cough particles released from the middle- and aisle-seat passengers. The small size group (2–50 µm) has a similar deposition pattern. However, from different passengers, the number fraction of 4 µm particles remaining within the breathing zone is noticeably different. When particles are released from the window-seat passenger, the exposure risk to the middle-seat passenger is 1.5 times greater than to his/her self (the window-seat passenger), and even tripled for the aisle-seat passenger. Cough aerosol exhaled from the middle-seat passenger intrudes into the window-seat passenger’s local breathing zone, and only a small amount of the particles can enter into the aisle-seat passenger’s local environment. It is suggested that cough particles released from the aisle-seat passenger have the least exposure risk to adjacent passengers. In this typical cabin environment, it is highly recommended that passengers seated in the window seat should put on his/her own mask if he/she is the potential index patient.
There were some limitations of this study. Firstly, the periodic boundary conditions at the front and back of the plane might cause slight deviations in the spatial distribution of particles. Another limitation was the exclusion of droplet size reduction during the evaporation process. The possible impact of this is size distribution change, specifically for particle (droplet-nuclei) sizes of around 2–5 µm. Both experimental and numerical studies of the evaporation processes and particle deposition in the aircraft cabin environment would be highly recommended for future study.
Disclosure statement
No potential conflict of interest was reported by the authors.
Additional information
Funding
References
- Abuhegazy, M., Talaat, K., Anderoglu, O., & Poroseva, S. V. (2020). Numerical investigation of aerosol transport in a classroom with relevance to COVID-19. Physics of Fluids, 32(10), 103311–103311. https://doi.org/https://doi.org/10.1063/5.0029118
- Ai, Z. T., & Melikov, A. K. (2018). Airborne spread of expiratory droplet nuclei between the occupants of indoor environments: A review. Indoor Air, 28(4), 500–524. https://doi.org/https://doi.org/10.1111/ina.12465
- Anderson, E. L., Turnham, P., Griffin, J. R., & Clarke, C. C. (2020). Consideration of the aerosol transmission for COVID-19 and public health. Risk Analysis, 40(5), 902–907. https://doi.org/https://doi.org/10.1111/risa.13500
- Annear, B., & Cooper, M. (2020). Know your risk during COVID-19. https://www.texmed.org/TexasMedicineDetail.aspx?id=54216
- ANSYS. (2009). ANSYS CFX-solver theory guide.
- Asadi, S., Bouvier, N., Wexler, A. S., & Ristenpart, W. D. (2020). The coronavirus pandemic and aerosols: Does COVID-19 transmit via expiratory particles? Aerosol Science and Technology, 54(6), 635–638. https://doi.org/https://doi.org/10.1080/02786826.2020.1749229
- ASHRAE, ANSI/ASHRAE Standard. (2016). Air quality within commercial aircraft. Atlanta.
- Bourouiba, L., Dehandschoewercker, E., & Bush, J. W. M. (2014). Violent expiratory events: On coughing and sneezing. Journal of Fluid Mechanics, 745, 537–563. https://doi.org/https://doi.org/10.1017/jfm.2014.88
- Buonanno, G., Stabile, L., & Morawska, L. (2020). Estimation of airborne viral emission: Quanta emission rate of SARS-CoV-2 for infection risk assessment. Environment International, 141, 105794. https://doi.org/https://doi.org/10.1016/j.envint.2020.105794
- Chao, C. Y. H., Wan, M. P., Morawska, L., Johnson, G. R., Ristovski, Z. D., Hargreaves, M., Mengersen, K., Corbett, S., Li, Y., Xie, X., & Katoshevski, D. (2009). Characterization of expiration air jets and droplet size distributions immediately at the mouth opening. Journal of Aerosol Science, 40(2), 122–133. https://doi.org/https://doi.org/10.1016/j.jaerosci.2008.10.003
- Chen, Q. (1995). Comparison of different k-ϵ models for indoor air flow computations. Numerical Heat Transfer, Part B: Fundamentals, 28(3), 353–369. https://doi.org/https://doi.org/10.1080/10407799508928838
- Dudalski, N., Mohamed, A., Mubareka, S., Bi, R., Zhang, C., & Savory, E. (2020). Experimental investigation of far-field human cough airflows from healthy and influenza-infected subjects. Indoor Air, 30(5), 966–977. https://doi.org/https://doi.org/10.1111/ina.12680
- Edge, B. A., Paterson, E. G., & Settles, G. S. (2005). Computational study of the wake and contaminant transport of a walking human. Journal of Fluids Engineering, 127(5), 967–977. https://doi.org/https://doi.org/10.1115/1.2013291
- Elmaghraby, H. A., Chiang, Y. W., & Aliabadi, A. A. (2018). Ventilation strategies and air quality management in passenger aircraft cabins: A review of experimental approaches and numerical simulations. Science & Technology for the Built Environment, 24(2), 160–175. https://doi.org/https://doi.org/10.1080/23744731.2017.1387463
- Evans, M. J. (2020). Avoiding COVID-19: Aerosol guidelines. medRxiv, 2020.2005.2021.20108894. https://doi.org/https://doi.org/10.1101/2020.05.21.20108894
- Fellouah, H., Ball, C. G., & Pollard, A. (2009). Reynolds number effects within the development region of a turbulent round free jet. International Journal of Heat and Mass Transfer, 52(17), 3943–3954. https://doi.org/https://doi.org/10.1016/j.ijheatmasstransfer.2009.03.029
- Feng, G., Bi, Y., Zhang, Y., Cai, Y., & Huang, K. (2020). Study on the motion law of aerosols produced by human respiration under the action of thermal plume of different intensities. Sustainable Cities and Society, 54, 101935. https://doi.org/https://doi.org/10.1016/j.scs.2019.101935
- Feng, Y., Marchal, T., Sperry, T., & Yi, H. (2020). Influence of wind and relative humidity on the social distancing effectiveness to prevent COVID-19 airborne transmission: A numerical study. Journal of Aerosol Science, 147, 105585–105585. https://doi.org/https://doi.org/10.1016/j.jaerosci.2020.105585
- Ghalandari, M., Shamshirband, S., Mosavi, A., & Chau, K.-W. (2019). Flutter speed estimation using presented differential quadrature method formulation. Engineering Applications of Computational Fluid Mechanics, 13(1), 804–810. https://doi.org/https://doi.org/10.1080/19942060.2019.1627676
- Gupta, J. K., Lin, C. H., & Chen, Q. (2009). Flow dynamics and characterization of a cough. Indoor Air, 19(6), 517–525. https://doi.org/https://doi.org/10.1111/j.1600-0668.2009.00619.x
- Gupta, J. K., Lin, C. H., & Chen, Q. (2011a). Inhalation of expiratory droplets in aircraft cabins. Indoor Air, 21(4), 341–350. https://doi.org/https://doi.org/10.1111/j.1600-0668.2011.00709.x
- Gupta, J. K., Lin, C. H., & Chen, Q. (2011b). Transport of expiratory droplets in an aircraft cabin. Indoor Air, 21(1), 3–11. https://doi.org/https://doi.org/10.1111/j.1600-0668.2010.00676.x
- He, X., Lau, E. H. Y., Wu, P., Deng, X., Wang, J., Hao, X., Lau, Y. C., Wong, J. Y., Guan, Y., Tan, X., Mo, X., Chen, Y., Liao, B., Chen, W., Hu, F., Zhang, Q., Zhong, M., Wu, Y., Zhao, L., … Leung, G. M. (2020). Temporal dynamics in viral shedding and transmissibility of COVID-19. Nature Medicine, 26(5), 672–675. https://doi.org/https://doi.org/10.1038/s41591-020-0869-5
- Inthavong, K. (2020). From indoor exposure to inhaled particle deposition: A multiphase journey of inhaled particles. Experimental and Computational Multiphase Flow, 2(2), 59–78. https://doi.org/https://doi.org/10.1007/s42757-019-0046-6
- Johns Hopkins University. (2020). Covid-19 dashboard by the center for systems science and 431 engineering (csse) at Johns Hopkins University (JHU). https://coronavirus.jhu.edu/map.html
- Kurazumi, Y., Tsuchikawa, T., Ishii, J., Fukagawa, K., Yamato, Y., & Matsubara, N. (2008). Radiative and convective heat transfer coefficients of the human body in natural convection. Building and Environment, 43(12), 2142–2153. https://doi.org/https://doi.org/10.1016/j.buildenv.2007.12.012
- Kwon, S.-B., Park, J., Jang, J., Cho, Y., Park, D.-S., Kim, C., Bae, G.-N., & Jang, A. (2012). Study on the initial velocity distribution of exhaled air from coughing and speaking. Chemosphere, 87(11), 1260–1264. https://doi.org/https://doi.org/10.1016/j.chemosphere.2012.01.032
- Lai, A. C. K., & Nazaroff, W. W. (2005). Supermicron particle deposition from turbulent chamber flow onto smooth and rough vertical surfaces. Atmospheric Environment, 39(27), 4893–4900. https://doi.org/https://doi.org/10.1016/j.atmosenv.2005.04.036
- Li, M., Yan, Y., Zhao, B., Tu, J., Liu, J., Li, F., & Wang, C. (2018). Assessment of turbulence models and air supply opening models for CFD modelling of airflow and gaseous contaminant distributions in aircraft cabins. Indoor and Built Environment, 27(5), 606–621. https://doi.org/https://doi.org/10.1177/1420326X16688049
- Li, M., Zhao, B., Tu, J., & Yan, Y. (2015). Study on the carbon dioxide lockup phenomenon in aircraft cabin by computational fluid dynamics. Building Simulation, 8(4), 431–441. https://doi.org/https://doi.org/10.1007/s12273-015-0217-8
- Li, X., Yan, Y., Shang, Y., & Tu, J. (2015). An Eulerian-Eulerian model for particulate matter transport in indoor spaces.
- Li, Y., Leung, G. M., Tang, J. W., Yang, X., Chao, C. Y. H., Lin, J. Z., Lu, J. W., Nielsen, P. V., Niu, J., Qian, H., Sleigh, A. C., Su, H. J. J., Sundell, J., Wong, T. W., & Yuen, P. L. (2007). Role of ventilation in airborne transmission of infectious agents in the built environment – A multidisciplinary systematic review. Indoor Air, 17(1), 2–18. https://doi.org/https://doi.org/10.1111/j.1600-0668.2006.00445.x
- Liu, Y., Gayle, A. A., Wilder-Smith, A., & Rocklöv, J. (2020). The reproductive number of COVID-19 is higher compared to SARS coronavirus. Journal of Travel Medicine, 27(2), https://doi.org/https://doi.org/10.1093/jtm/taaa021
- McKibbin, W., & Fernando, R. (2020). The global macroeconomic impacts of COVID-19: Seven scenarios (CAMA Working Paper No. 19/2020). https://doi.org/https://doi.org/10.2139/ssrn.3547729
- Mittal, R., Ni, R., & Seo, J.-H. (2020). The flow physics of COVID-19. Journal of Fluid Mechanics, 894(F2), Article F2. https://doi.org/https://doi.org/10.1017/jfm.2020.330
- Morawska, L. (2006). Droplet fate in indoor environments, or can we prevent the spread of infection? Indoor Air, 16(5), 335–347. https://doi.org/https://doi.org/10.1111/j.1600-0668.2006.00432.x
- Qian, G., Yang, N., Ding, F., Ma, A. H. Y., Wang, Z., Shen, Y., Shi, C., Lian, X., Chu, J., Chen, L., Wang, Z., Ren, D.-W., Li, G.-X., Chen, X., Shen, H., & Chen, X. (2020). Epidemiologic and clinical characteristics of 91 hospitalized patients with COVID-19 in Zhejiang, China: A retrospective, multi-centre case series. QJM: An International Journal of Medicine, 113, 474–481. https://doi.org/https://doi.org/10.1093/qjmed/hcaa089
- Qian, H., Li, Y., Nielsen, P. V., Hyldgaard, C. E., Wong, T. W., & Chwang, A. T. Y. (2006). Dispersion of exhaled droplet nuclei in a two-bed hospital ward with three different ventilation systems. Indoor Air, 16(2), 111–128. https://doi.org/https://doi.org/10.1111/j.1600-0668.2005.00407.x
- Qian, H., Miao, T., Liu, L., Zheng, X., Luo, D., & Li, Y. (2020). Indoor transmission of SARS-CoV-2. medRxiv, 2020.2004.2004.20053058. https://doi.org/https://doi.org/10.1101/2020.04.04.20053058
- Redrow, J., Mao, S., Celik, I., Posada, J. A., & Feng, Z.-G. (2011). Modeling the evaporation and dispersion of airborne sputum droplets expelled from a human cough. Building and Environment, 46(10), 2042–2051. https://doi.org/https://doi.org/10.1016/j.buildenv.2011.04.011
- Rohdin, P., & Moshfegh, B. (2007). Numerical predictions of indoor climate in large industrial premises. A comparison between different k–ϵ models supported by field measurements. Building and Environment, 42(11), 3872–3882. https://doi.org/https://doi.org/10.1016/j.buildenv.2006.11.005
- Salih, S. Q., Aldlemy, M. S., Rasani, M. R., Ariffin, A. K., Ya, T. M. Y. S. T., Al-Ansari, N., Yaseen, Z. M., & Chau, K.-W. (2019). Thin and sharp edges bodies-fluid interaction simulation using cut-cell immersed boundary method. Engineering Applications of Computational Fluid Mechanics, 13(1), 860–877. https://doi.org/https://doi.org/10.1080/19942060.2019.1652209
- Silcott, D., Kinahan, S., Santarpia, J., Silcott, B., Silcott, R., Silcott, P., Silcott, B., Distelhorst, S., Herrera, V., Rivera, D., Crown, K., Lucero, G., Bryden, W., McLoughlin, M., Cetta, M., & Accardi, R. (2020). TRANSCOM/AMC commercial aircraft cabin aerosol dispersion tests. Transportation Research Board.
- Stadnytskyi, V., Bax, C. E., Bax, A., & Anfinrud, P. (2020). The airborne lifetime of small speech droplets and their potential importance in SARS-CoV-2 transmission. Proceedings of the National Academy of Sciences, 117(22), 11875–11877. https://doi.org/https://doi.org/10.1073/pnas.2006874117
- Tao, Y. (2018). Numerical and experimental study of motion-induced wake flow and contaminant transport in interior environments. RMIT University.
- Wang, C., Zhang, J., Chen, H., & Liu, J. (2020). Experimental study of thermo-fluid boundary conditions, airflow and temperature distributions in a single aisle aircraft cabin mockup. Indoor and Built Environment, 1420326X2093227. https://doi.org/https://doi.org/10.1177/1420326x20932271
- Wei, J., & Li, Y. (2015). Enhanced spread of expiratory droplets by turbulence in a cough jet. Building and Environment, 93, 86–96. https://doi.org/https://doi.org/10.1016/j.buildenv.2015.06.018
- Wei, L., Lin, J., Duan, X., Huang, W., Lu, X., Zhou, J., & Zong, Z. (2020). Asymptomatic COVID-19 patients can contaminate their surroundings: An environment sampling study. mSphere, 5(3), e00442–e00420. https://doi.org/https://doi.org/10.1128/mSphere.00442-20
- Xie, X., Li, Y., Chwang, A. T. Y., Ho, P. L., & Seto, W. H. (2007). How far droplets can move in indoor environments – Revisiting the Wells evaporation–falling curve. Indoor Air, 17(3), 211–225. https://doi.org/https://doi.org/10.1111/j.1600-0668.2007.00469.x
- Yan, Y., Li, X., Shang, Y., & Tu, J. (2017). Evaluation of airborne disease infection risks in an airliner cabin using the Lagrangian-based Wells-Riley approach. Building and Environment, 121, 79–92. https://doi.org/https://doi.org/10.1016/j.buildenv.2017.05.013
- Yan, Y., Li, X., & Tu, J. (2016). Effects of passenger thermal plume on the transport and distribution characteristics of airborne particles in an airliner cabin section. Science and Technology for the Built Environment, 22(2), 153–163. https://doi.org/https://doi.org/10.1080/23744731.2015.1090254
- Yan, Y., Li, X., & Tu, J. (2019). Thermal effect of human body on cough droplets evaporation and dispersion in an enclosed space. Building and Environment, 148, 96–106. https://doi.org/https://doi.org/10.1016/j.buildenv.2018.10.039
- Yan, Y., Li, X., Yang, L., & Tu, J. (2016). Evaluation of manikin simplification methods for CFD simulations in occupied indoor environments. Energy and Buildings, 127, 611–626. https://doi.org/https://doi.org/10.1016/j.enbuild.2016.06.030
- Yang, N., Shen, Y., Shi, C., Ma, A. H. Y., Zhang, X., Jian, X., Wang, L., Shi, J., Wu, C., Li, G., Fu, Y., Wang, K., Lu, M., & Qian, G. (2020). In-flight transmission cluster of COVID-19: A retrospective case series. medRxiv, 2020.2003.2028.20040097. https://doi.org/https://doi.org/10.1101/2020.03.28.20040097
- Yang, X., Ou, C., Yang, H., Liu, L., Song, T., Kang, M., Lin, H., & Hang, J. (2020). Transmission of pathogen-laden expiratory droplets in a coach bus. Journal of Hazardous Materials, 397, 122609. https://doi.org/https://doi.org/10.1016/j.jhazmat.2020.122609
- You, R., Chen, J., Shi, Z., Liu, W., Lin, C.-H., Wei, D., & Chen, Q. (2016). Experimental and numerical study of airflow distribution in an aircraft cabin mock-up with a gasper on. Journal of Building Performance Simulation, 9(5), 555–566. https://doi.org/https://doi.org/10.1080/19401493.2015.1126762