
 ?Mathematical formulae have been encoded as MathML and are displayed in this HTML version using MathJax in order to improve their display. Uncheck the box to turn MathJax off. This feature requires Javascript. Click on a formula to zoom.
Abstract
This work computationally explores the two-phase flow of nanofluids and their thermal energy transport coefficients in 3D diamond-shaped cavities with square-shaped barriers having reducing dimensions. Materials with two emissivity values, and 0.9, have been considered to investigate the effect of the radiation thermal energy transport coefficient while the hot side is maintained at 400 or 500 K. Two values of the Rayleigh number, Ra = 106 and 108, are used for the study. Cu nanoparticles (NPs) with an average size of 25 nm have been used at a concentration of 0.01–0.05% in the base fluid. The temperature gradients and thermal energy transport coefficient characteristics are enhanced by raising the volume concentration of nanoparticles, but the streamlines do not alter substantially. By increasing Ra, the thermal energy transport coefficient rate is further augmented. It is also found that increasing the Ra and volume concentration of NPs results in enhanced heat transfer inside a cavity, while a change in the emissivity coefficient has no significant impact on the thermal and flow characteristics of the nanofluid. For each case, there is an optimum NP volume fraction for each model that leads to the highest Nusselt number.
1. Introduction
Developing energy concerns have encouraged the expansion of novel models for the utilization of high-performance heat exchangers (HEs). Nowadays, electronic cooling heat exchangers (ECHEs) that are used in fast all-electric systems and computing applications, and using nanofluids (NFs) to achieve a higher heat transfer (HT) coefficient, have been investigated by several authors for increased thermal performance. Furthermore, nanofluids have recently been at the center of attention because of their accurate thermophysical properties.
Khodabandeh et al. (Citation2020) studied numerically the thermohydraulic characteristics of H2O–silver NF in a spiral HE. The objective of this work is to improve the HT performance of an HE using two-phase NFs. The results show that, with an increase in the volume fraction of nanoparticles (NPs), the HT increases but at the same time the pressure drop (PD) penalty increases with the increase of spiral rotation and velocity of the working fluid.
He et al. (Citation2020) investigated computationally the influence of a swirl generator on the thermohydraulic characteristics of a H2O–CuO NF inside a tube. The objective of the work was to explore a swirl generator effect on the performance of HT by using NFs. An interesting outcome reported by the investigators was that, by using a helical swirl generator and the NFs studied, the thermohydraulic performance was enhanced by 18.2%.
Computational studies were performed by Barnoon et al. (Citation2019) on different NFs (H2O–Al2O3, H2O–SiO2, H2O–ZnO and H2O–TiO2) to investigate entropy generation in the presence of a magnetic field. The results showed that increasing the diameter of the NPs increased the wall temperature and produced entropy. Also, by increasing the Hartmann number, the entropy produced increased.
Mashayekhi et al. (Citation2017) studied computationally the influence of a conical strip on the thermohydraulic characteristics of a H2O–silver NF in a tube. The outcome illustrated that, by using conical strip spiral turbulators, the average Nusselt number (Nu) and friction factor ( f ) increased significantly compared to the base case.
Siavashi et al. (Citation2017) studied computationally the influence of a porous type swirl generator on the thermohydraulic characteristics of an H2O–Al2O3 NF in a two-phase channel. The outcomes demonstrated that the tooth height and porous setting had a significant influence on the HT performance.
Alsarraf et al. (Citation2019) studied computationally the influence of alumina NPs on HT and PD in a two-phase HE. The results showed that the shapes of spherical and platelet nanoparticles had the highest and lowest HT performance in the HE, respectively.
Varzaneh et al. (Citation2020) studied computationally the influence of a ribbed micro-tube on the thermohydraulic characteristics of an alumina NF. The effects demonstrated that, by using rib roughness, the thermohydraulic performance rose by about 19%.
Milani Shirvan et al. (Citation2017) investigated computationally the influence of an Al2O3 aluminum water-oxide NF in a two-tube HE using a two-phase model. The results showed that, with increasing Reynolds number (Re), the average Nu increased.
Samadifar and Toghraie (Citation2018) studied computationally the influence of vortex generators on the flow field and HT in HEs having triangular cross sections. Their results showed that the use of rectangular vortex generators increased HT more than other vortex generators.
Xu et al. (Citation2017) studied computationally the influence of vortex generators on the flow field and HT within a circular tube with constant heat flux. Their results showed that the maximum HT was achieved with an angle of attack of 45° when the obstruction ratio was 0.3. Also, as the instability increased, the HT and the coefficient of friction increased.
Sheikholeslami et al. (Citation2020) made a numerical study of turbulator generated entropy on the flow field and HT of water–copper oxide NFs by considering a two-phase model in a solar system. Their results show that the greatest decrease in entropy production with increasing Re occurred when using a twisted barrier.
Some researchers (Alsabery et al., Citation2019; Alsabery, Gedik, et al., Citation2020; Alsabery, Ismael, et al., Citation2020; Ayoubi Ayoubloo et al., Citation2019; Chamkha et al., Citation2019; Dogonchi et al., Citation2020; Hoseinzadeh et al., Citation2019; Mehryan, Izadi, et al., Citation2019; Mehryan, Izadpanahi, et al., Citation2019; Selimefendigil et al., Citation2019; Shashikumar et al., Citation2019; Tayebi et al., Citation2019) have studied the thermohydraulic characteristics numerically through circular and non-circular tubes by using various single acting NFs and hybrid NFs. Also, some others researchers (Aghayari et al., Citation2020; Ahmadi et al., Citation2020; Beigzadeh et al., Citation2020; Ez Abadi et al., Citation2020; Gan et al., Citation2020; Ghahremannezhad et al., Citation2019; Jilte et al., Citation2020; Maddah et al., Citation2019; Sharma et al., Citation2020) explored, both experimentally and computationally, the thermal performance of NFs in micro, mini and conventional circular and non-circular channels. Similarly, Mahdavi et al. (Citation2017), Neyestani et al. (Citation2019) and Sharifpur et al. (Citation2018) studied, both experimentally and numerically, natural and forced convection by using newly developed nanofluids.
After reviewing the available literature based on the effect of using NFs in electrical heat exchangers, the present authors found that no study had investigated NF flow and HT in a 3D diamond-shaped cavity fitted with a square-shaped barrier having reducing dimensions. Therefore, the chief objective of the present work is to investigate numerically the influence of the emissivity of the material, the Rayleigh number (Ra), and the volume fraction of NPs on the thermal and flow characteristics of a 3D diamond-shaped cavity (DSC) fitted with a square-shaped barrier having reducing dimensions. ANSYS®-Fluent® 15.0 was used for the solution to the boundary-value problem, and the SolidWorks® and ANSYS®-Workbench software packages were used for the creation of the mesh considered.
2. Methodology
2.1. Model
Figures and illustrate the schematic of a basic 3D DSC fitted with a square-shaped obstacle having reducing dimensions. The diamond height is varied from 173.10 to 283.93 mm, and the length of the diamond is 1000 mm. Also, the square height is varied from 46.03 to 70.71 mm (Lsquare = 1000 mm). The system is made of stainless steel 304 of 2.0 mm thickness ( = 0.3 and
= 0.9); Ra = 106 and 108. It is very clear that, in the present study, Ra is in the turbulent regime (Tinitial = 350 K, Tc = 280 K, Th = 400 or 500 K). The HT fluid is a water–Cu NF, which creates a Newtonian NF, with concentrations
of 0.01–0.05%. Table reports the important properties of the Newtonian base fluid and solid particles.
Figure 1. Schematic diagrams of the basic geometry in the present paper.
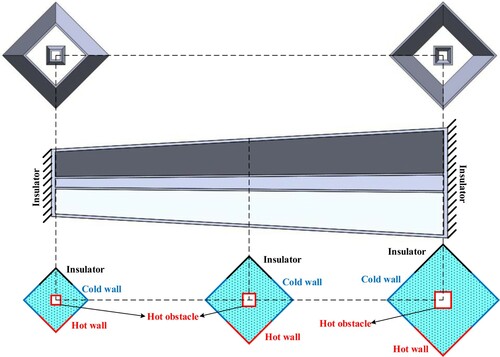
Figure 2. Schematic diagrams of the geometry studied in the present work and boundary conditions.
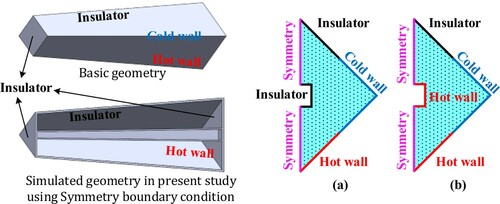
Table 1. Thermophysical properties (Aladdin et al., Citation2020).
Assumptions: (1) the problem is steady state; (2) the flow regime is turbulent; (3) the fluid flow is incompressible; (4) the nanofluid has Newtonian behavior; and (5) the nanofluid is two phase.
The effective density and specific heat
of the NF at each section-temperature
are calculated using the equations of Kim et al. (Citation2009). Also, the thermal conductivity (k) can be calculated using the equations in Table . By considering the Brownian motion of nanoparticles and employing the equations of Corcione (Citation2011) in a 3D cavity, the NF thermal conductivity can be obtained, where
is the Re of the NPs, the Prandtl number (Pr) is that of the base liquid,
is the temperature of the nanofluid,
is the base liquid freezing point,
is the thermal/heat conductivity of NPs, and
is the suspended nanoparticle volume fraction. The Re of the NPs is calculated from Table (Corcione, Citation2011), where
and
are the base fluid density and the dynamic viscosity, and
and
are the nanoparticle size and average Brownian velocity, respectively. Considering no agglomeration, the NPs’ Brownian velocity
can attain as
and
ratio obligatory to shelter such distance (Corcione, Citation2011), where
is the self-diffusion coefficient and
is Boltzmann’s constant (Corcione, Citation2011). Note that in the earlier equations all the physical properties were calculated at the NF temperature T. Also, the dynamic viscosity was calculated from Table (Corcione, Citation2011), where
is the molar weight of the base fluid,
is Avogadro’s number, and
is the density of the base fluid calculated at
, where
is the equivalent diameter of a base fluid molecule (Corcione, Citation2011).
Table 2. Equations used in this study (Aladdin et al., Citation2020; Corcione, Citation2011).
The symmetry conditions
fluxes across the symmetry = 0
normal components of all variables = 0
can be applied to both planar or non-planar faces/surfaces on the domain boundaries.
To compute the NF flow through a cylinder, the two-phase flow method is engaged and presented in Table . The equations of continuity, energy and momentum are also presented in Table (Al-Ansary & Zeitoun, Citation2011; Arani et al., Citation2017; Heris et al., Citation2012; Kim et al., Citation2009; Patankar, Citation1980; Sadripour, Citation2019; Sadripour & Chamkha, Citation2019; Salari et al., Citation2020). The volume fraction/concentration equation for a two-phase mixture and the slip velocity are also in Table (Al-Ansary & Zeitoun, Citation2011; Aladdin et al., Citation2020; Arani et al., Citation2017; Corcione, Citation2011; Heris et al., Citation2012; Karami et al., Citation2020; Karimi et al., Citation2019; Kim et al., Citation2009; Patankar, Citation1980; Sadripour, Citation2019; Sadripour & Chamkha, Citation2019; Salari et al., Citation2020). The NFs’ Re is also calculated using the equations in Table , where is the mean particle diameter. The equations that describe the k–ϵ model are also reported in Table , where the turbulent dynamic viscosity is
and the production rate of
is
(Ahmadi et al., Citation2019; Karimi et al., Citation2019; Vatani & Mohammed, Citation2013). The standard constants
,
,
,
,
and
are used, and the Ra and Nu of the nanofluid are also reported in Table (Karimi et al., Citation2019).
Table 3. Governing equations and important parameters (Al-Ansary & Zeitoun, Citation2011; Arani et al., Citation2017; Patankar, Citation1980; Sadripour, Citation2019; Sadripour & Chamkha, Citation2019; Salari et al., Citation2020).
2.2. Validation
2.2.1. Mesh independency test
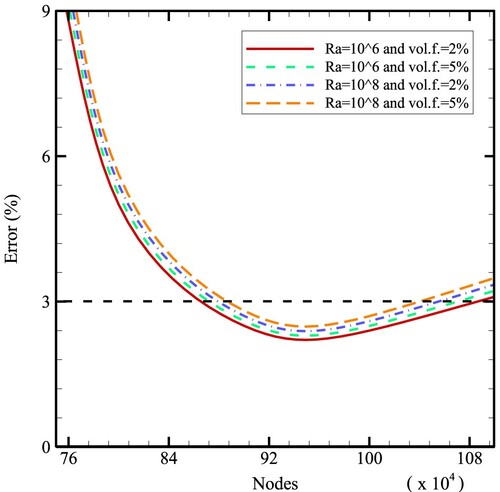
A grid independency study is an important study in the numerical analysis (Baghban et al., Citation2019; Fereidoon et al., Citation2013; Ghalandari et al., Citation2019; Heris et al., Citation2012; Ramezanizadeh et al., Citation2019). Figure shows a grid independence test (GIT) performed for the studied cavity filled with NF to explore the influences of grid size on the results for the grid mesh generated.
Figure 3. Mesh independency test.
2.2.2. Code validation
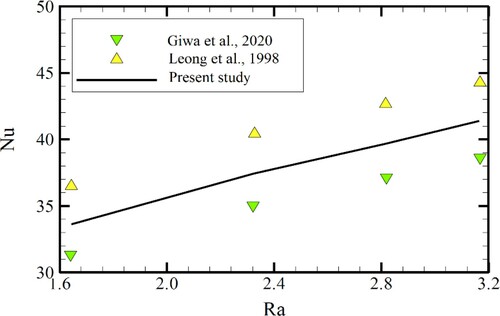
The other important issue is to validate the employed computer code using available validated numerical or experimental papers in the literature. Figure illustrates the validation of the current work with the results obtained by Leong et al. (Citation1998) and Giwa et al. (Citation2020) in cases where Nu is a function of Ra. Giwa et al. (Citation2020) studied experimentally the convection HT characteristics of a differentially heated square-shaped cavity filled with an Al2O3–MWCNT/water NF. Also, Leong et al. (Citation1998) conducted an experimental study to investigate the natural convection HT performance of a cubic-shaped cavity.
Figure 4. Validation of current study with the results obtained by Leong et al. (Citation1998) and Giwa et al. (Citation2020) in the case of Nu versus different Ra’s.
3. Results and discussion
NF flow has a higher thermal conductivity than the base fluid and can transfer more energy. But the nanofluid also has more dynamic viscosity than the base fluid, which increases the PD penalty and f in the system. However, in the present system a pressure drop does not matter. Figure illustrates the temperature and velocity contours for various nanoparticle volume fractions and at various cross sections of a 3D cavity with = 0.3 and Ra = 106 for a case with Th = 400 K and an insulator obstacle. As shown in this figure, on the left-hand side of the cavity, which has smaller dimensions, the HT characteristics are stronger. Also, it is seen that, in all cases, a non-clockwise vortex exists in the cavity because of temperature gradients. It is also realized that, by raising the NPs’
, the temperature gradients and HT behavior are better, but the streamlines do not show any noteworthy change. Figure illustrates the temperature and velocity contours for various nanoparticle volume fractions and at various cross sections of a 3D cavity with
= 0.3 and Ra = 108 for a case with Th = 400 K and an insulator obstacle. Also, by comparing Figures and , it is realized that, at higher Ra, the HT characteristics are augmented. Figure illustrates the temperature and velocity contours for various nanoparticle volume fractions and at various cross sections of a 3D cavity with
= 0.3 and Ra = 106 for a case with Th = 400 K and a heated obstacle. As shown in this figure, on the left-hand side of the cavity, which has smaller dimensions, the HT characteristics are stronger. Additionally, it is seen that, in all cases, a non-clockwise vortex exists in the cavity because of temperature gradients. It is also realized that, by raising the NPs’
, the temperature gradients and HT behavior are better, but the streamlines do not show any noteworthy change. Figure illustrates the temperature and velocity contours for various nanoparticle volume fractions and at various cross sections of a 3D cavity with
= 0.3 and Ra = 108 for a case with Th = 400 K and a heated obstacle. As shown in this figure, on the left-hand side of the cavity, which has smaller dimensions, the HT characteristics are stronger. Also, it is seen that, in all cases, a non-clockwise vortex exists in the cavity because of temperature gradients. It is also realized that, by raising the NPs’
, the temperature gradients and HT behavior are better, but the streamlines do not show any noteworthy change. The HT rate is always raised by increasing Ra. Higher Rayleigh numbers lead to more turbulent flow and more vortex generation in the system, which increase the flow mixing rate in channels. This leads to a higher HT coefficient and increases the HT rate in the system.
Figure 5. Temperature and velocity contours for various nanoparticle volume fractions and at various cross sections of a 3D cavity with = 0.3 and Ra = 106 for a case with Th = 400 K and an insulator obstacle.
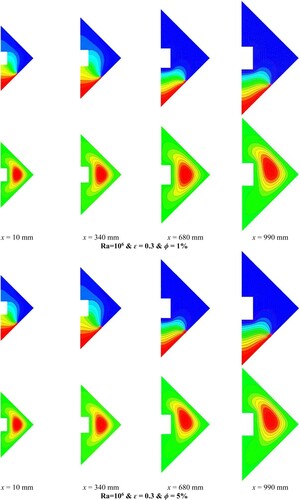
Figure 6. Temperature and velocity contours for various nanoparticle volume fractions and at various cross sections of a 3D cavity with = 0.3 and Ra = 108 for a case with Th = 400 K and an insulator obstacle.

Figure 7. Temperature and velocity contours for various nanoparticle volume fractions and at various cross sections of a 3D cavity with = 0.3 and Ra = 106 for a case with Th = 400 K and a heated obstacle.
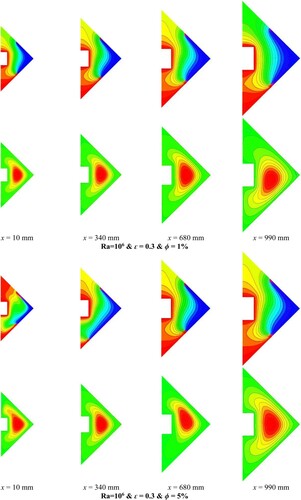
Figure 8. Temperature and velocity contours for various nanoparticle volume fractions and at various cross sections of a 3D cavity with = 0.3 and Ra = 108 for a case with Th = 400 K and a heated obstacle.

Figure illustrates the temperature and velocity contours for various nanoparticle volume fractions and at various cross sections of a 3D cavity with = 0.3 and Ra = 106 for a case with Th = 500 K and a heated obstacle. As shown in this figure, on the left-hand side of the cavity, which has smaller dimensions, the HT characteristics are stronger. Also, it is seen that, in all cases, a clockwise and also a non-clockwise vortex exist in the cavity because of temperature gradients. It is also realized that, by raising the NPs’
, the temperature gradients and HT behavior are better.
Figure 9. Temperature and velocity contours for various nanoparticle volume fractions and at various cross sections of a 3D cavity with = 0.3 and Ra = 106 for a case with Th = 500 K and a heated obstacle.
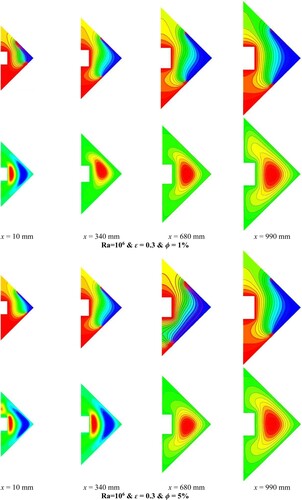
Figure illustrates the temperature and velocity contours for various nanoparticle volume fractions and at various cross sections of a 3D cavity with = 0.3 and Ra = 108 for a case with Th = 500 K and a heated obstacle. As shown in this figure, on the left-hand side of the cavity, which has smaller dimensions, the HT characteristics are stronger. Also, it is seen that, in all cases, a clockwise and also a non-clockwise vortex exist in the cavity because of temperature gradients. It is also realized that, by raising the number of NPs
, the temperature gradients and HT behavior are better, but the streamlines do not show any noteworthy change. Also, by comparing Figures and it is realized that, at higher Ra, the HT characteristics are augmented. Therefore, it is realized that, in the case of using a material with an emissivity of 0.3, usage of a cavity with a heated obstacle and a constant hot-side temperature of 500 K should be suggested. Also, higher Ra’s and NPs’
lead to more HT inside the cavity.
Figure 10. Temperature and velocity contours for various nanoparticle volume fractions and at various cross sections of a 3D cavity with = 0.3 and Ra = 108 for a case with Th = 500 K and a heated obstacle.
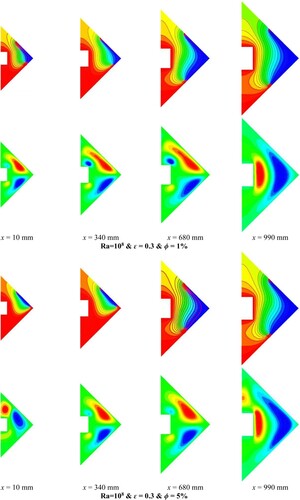
Figure illustrates the temperature and velocity contours for various nanoparticle volume fractions and at various cross sections of a 3D cavity with = 0.9 and Ra = 106 for a case with Th = 400 K and an insulator obstacle. As shown in this figure, on the left-hand side of the cavity, which has smaller dimensions, the HT characteristics are stronger. Furthermore, it is seen that, in all cases, a non-clockwise vortex exists in the cavity because of temperature gradients. It is also realized that, by raising the NPs’
, the temperature gradients and HT behavior are better. Figure illustrates the temperature and velocity contours for various nanoparticle volume fractions and at various cross sections of a 3D cavity with
= 0.9 and Ra = 108 for a case with Th = 400 K and an insulator obstacle. As shown in this figure, on the left-hand side of the cavity, which has smaller dimensions, the HT characteristics are stronger. Also, it is seen that, in all cases, a non-clockwise vortex exists in the cavity because of temperature gradients. It is also realized that, by raising the NPs’
, the temperature gradients and HT behavior are better, but the streamlines do not show any noteworthy change. Moreover, by comparing Figures and , it is realized that, at higher Ra, the HT characteristics are augmented. A higher nanoparticle volume fraction leads to higher thermal conductivity and a higher Nusselt number.
Figure 11. Temperature and velocity contours for various nanoparticle volume fractions and at various cross sections of a 3D cavity with = 0.9 and Ra = 106 for a case with Th = 400 K and an insulator obstacle.
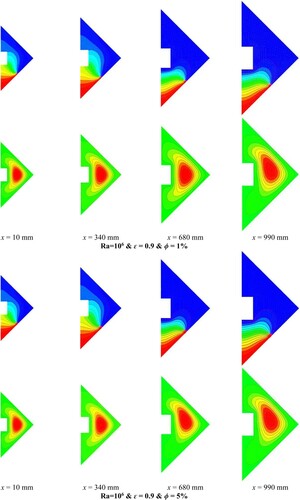
Figure 12. Temperature and velocity contours for various nanoparticle volume fractions and at various cross sections of a 3D cavity with = 0.9 and Ra = 108 for a case with Th = 400 K and an insulator obstacle.
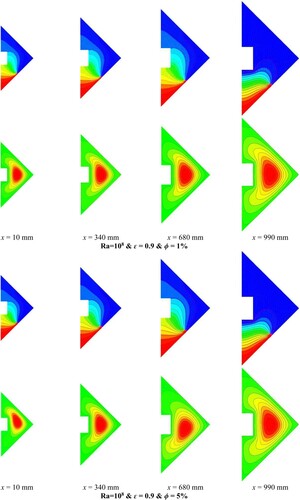
Figure illustrates the temperature and velocity contours for various nanoparticle volume fractions and at various cross sections of a 3D cavity with = 0.9 and Ra = 106 for a case with Th = 400 K and a heated obstacle. As shown in this figure, on the left-hand side of the cavity, which has smaller dimensions, the HT characteristics are stronger. Also, it is seen that, in all cases, a non-clockwise vortex exists in the cavity because of temperature gradients. It is also realized that, by raising the NPs’
, the temperature gradients and HT behavior are better. Figure illustrates the temperature and velocity contours for various nanoparticle volume fractions and at various cross sections of a 3D cavity with
= 0.9 and Ra = 108 for a case with Th = 400 K and a heated obstacle. As shown in this figure, on the left-hand side of the cavity, which has smaller dimensions, the HT characteristics are stronger. Also, it is seen that, in all cases, a non-clockwise vortex exists in the cavity because of temperature gradients. It is also realized that, by raising the NPs’
, the temperature gradients and HT behavior are better. Also, by comparing Figures and , it is realized that, at higher Ra, the HT characteristics are augmented.
Figure 13. Temperature and velocity contours for various nanoparticle volume fractions and at various cross sections of a 3D cavity with = 0.9 and Ra = 106 for a case with Th = 400 K and a heated obstacle.

Figure 14. Temperature and velocity contours for various nanoparticle volume fractions and at various cross sections of a 3D cavity with = 0.9 and Ra = 108 for a case with Th = 400 K and a heated obstacle.
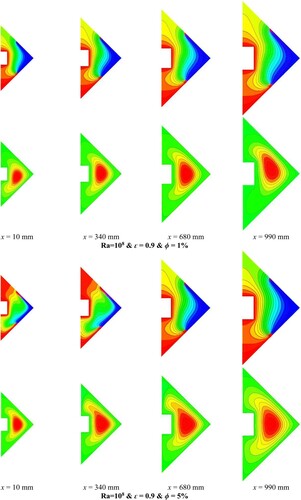
Figure illustrates the temperature and velocity contours for various nanoparticle volume fractions and at various cross sections of a 3D cavity with = 0.9 and Ra = 106 for a case with Th = 500 K and a heated obstacle. As shown in this figure, on the left-hand side of the cavity, which has smaller dimensions, the HT characteristics are stronger. Also, it is seen that, in all cases, a clockwise and also a non-clockwise vortex exist in the cavity because of temperature gradients. It is also realized that, by raising the NPs’
, the temperature gradients and the HT behavior are better, but the streamlines do not show any noteworthy change.
Figure 15. Temperature and velocity contours for various nanoparticle volume fractions and at various cross sections of a 3D cavity with = 0.9 and Ra = 106 for a case with Th = 500 K and a heated obstacle.
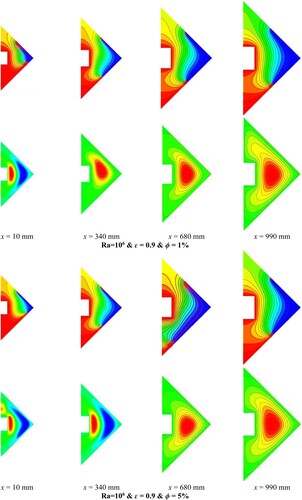
Figure illustrates the temperature and velocity contours for various nanoparticle volume fractions and at various cross sections of a 3D cavity with = 0.9 and Ra = 108 for a case with Th = 500 K and a heated obstacle. As shown in this figure, on the left-hand side of the cavity, which has smaller dimensions, the HT characteristics are stronger. Also, it is seen that, in all cases, a clockwise and also a non-clockwise vortex exist in the cavity because of temperature gradients. It is also realized that, by raising the NPs’
, the temperature gradients and the HT behavior are better, but the streamlines do not show any noteworthy change. Also, by comparing Figures and , it is realized that, at higher Ra, the HT characteristics are augmented. Therefore, it is realized that, in the case of using material with an emissivity of 0.9, usage of the cavity with a heated obstacle and a constant hot-side temperature of 500 K should be suggested. Also, higher Ra and NPs’
lead to more HT inside the cavity. It is also found that changes in the coefficients of emissivity do not show any noteworthy influence on the HT characteristics or NF flow in the cavity.
Figure 16. Temperature and velocity contours for various nanoparticle volume fractions and at various cross sections of a 3D cavity with = 0.9 and Ra = 108 for a case with Th = 500 K and a heated obstacle.
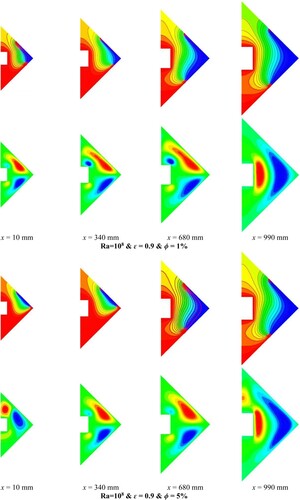
Figure illustrates the predicted total average Nu versus different NP volume fractions for different base fluids for a 3D cavity with
= 0.3 and Ra = 106 and 108 for cases with Th = 400 and 500 K and a heated obstacle. As shown in Figure (a), for the case with Ra = 106 and Th = 400, the predicted average Nu is always raised by increasing the number of nanoparticles, and consequently, at an NP volume fraction of 0.05, the highest Nu is achieved. Also, it is realized that, for a case with water as the base fluid, the predicted mean Nu is more than for all other models in all ranges of nanoparticle concentrations studied when the base fluids are ethylene-glycol/water or ethylene-glycol, respectively. As seen in Figure (b) for the case with Ra = 108 and Th = 400, the predicted average Nu is always raised by increasing the volume concentration of nanoparticles
until a nanoparticle volume fraction of 0.01 (for ethylene-glycol), 0.02 (for ethylene-glycol/water) and 0.03 (for water) is reached, and then the Nusselt number values reduce. Consequently, there is an optimum nanoparticle volume fraction/concentration
for each model that leads to the highest Nusselt number.
Figure 17. Predicted total Nu versus different NF volume fractions for different base fluids for a 3D cavity with = 0.3 and Ra = 106 and 108 for cases with Th = 400 and 500 K and a heated obstacle.
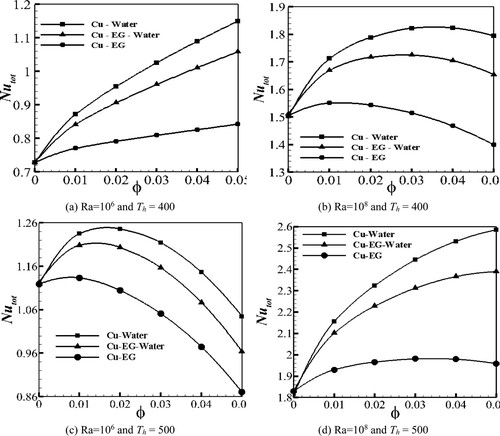
As shown in Figure (c) for the case with Ra = 106 and Th = 500, the predicted average Nusselt number is always increased by increasing the number of nanoparticles until a nanoparticle volume fraction of 0.02 (for water and ethylene-glycol/water) and 0.01 (for ethylene-glycol) is reached, and then the Nusselt number values reduce. Consequently, there is an optimum nanoparticle volume fraction for each model that leads to the highest Nu. As shown in Figure (d) for the case with Ra = 108 and Th = 500, the predicted average Nu is always raised by increasing the number of nanoparticles until a nanoparticle volume fraction of 0.03 (for ethylene-glycol/water) is reached, and then the Nusselt number values reduce. Also, for the ethylene-glycol model and the water cases, the average Nu is always increased by increasing the nanoparticle volume fraction. Consequently, there is an optimum nanoparticle volume fraction
for each model that leads to the highest Nusselt number.
4. Conclusion
The chief objective of the current study was to investigate numerically the effects of the emissivity of the material, the Rayleigh number, and the volume fraction of nanoparticles (NPs) on the thermal and flow characteristics of a three-dimensional diamond-shaped cavity fitted with a square-shaped barrier having reducing dimensions:
two-phase NF flow and heat transfer were modeled numerically;
a 3D diamond-shaped cavity was simulated using symmetric boundary conditions;
the effects of using a square-shaped obstacle having decreasing dimensions were analyzed;
copper nanoparticles were added to the base fluid for making the nanofluid;
the influences of different emissivity values, Rayleigh numbers and nanoparticle volume fractions were investigated.
The important findings of the investigation are summarized as follows.
On the left-hand sides of cavities, which have smaller dimensions, the rate of HT is stronger. Also, it is seen that, in all cases, a clockwise and also a counter-clockwise vortex exist in the cavities because of temperature gradients.
Increasing the volume concentration
of NFs in the base fluid results in enhanced heat transfer (HT) without showing any significant change in the streamlines.
Enhanced HT is also noticed at higher values of Ra.
In the case of using material with an emissivity of 0.3, usage of the cavity with a heated obstacle and a constant hot-side temperature of 400 or 500 K should be suggested.
At higher
The emissivity coefficient does not influence the thermal or flow characteristics of nanofluids.
For the case with Ra = 106 and Th = 400 K, the predicted Nu is always raised by increasing the nanoparticle volume concentration
It is realized that, for water as the base fluid, the predicted mean Nu is more than for all other models in all ranges of nanoparticle concentrations studied when the base fluids are ethylene-glycol/water or ethylene-glycol, respectively.
For the case with Ra = 108 and Th = 400 K, the predicted Nu is always raised by increasing the number of nanoparticles
There is an optimum nanoparticle volume fraction for each model that leads to the highest Nu.
For the case with Ra = 106 and Th = 500 K, the predicted average Nusselt number is always increased by increasing the nanoparticle concentration
For the case with Ra = 108 and Th = 500 K, the predicted average Nusselt number is always increased by increasing the nanoparticle concentration
This paper offers an appropriate simulation method for the investigation of 3D symmetrical geometries that are filled with two-phase nanofluids, when both radiation and convection equations are solved.
Nomenclature
| cp | = | Specific heat (J/kg·K) |
| Cu | = | Copper |
| = | Nanoparticle size (nm) | |
| = | Gravity (m/s2) | |
| k | = | Thermal conductivity (W/m·K) |
| Ra | = | Rayleigh number (–) |
| = | Molecular weight of the base fluid (kg/kmol) | |
| = | Avogadro’s number (–) | |
| Nu | = | Nusselt number (–) |
| = | Pressure (Pa) | |
| Tc | = | Cold side temperature (K) |
| = | Liquid freezing point of base fluid (K) | |
| Th | = | Hot-side temperature (K) |
| Tinitial | = | Initial nanofluid temperature (K) |
| Tm | = | Each section-temperature (K) |
| = | Nanoparticle drift velocity (m/s) | |
| = | Fluid drift velocity (m/s) | |
| = | Average Brownian velocity (m/s) |
Greek symbols
| = | Acceleration (m/s2) | |
| ρ | = | Density (kg/m3) |
| = | Emissivity (–) | |
| = | volume concentration of nanoparticles (%) | |
| = | Dynamic viscosity (Pa·s) |
Disclosure statement
No potential conflict of interest was reported by the authors.
References
- Aghayari, R., Maddah, H., Pourkiaei, S. M., Ahmadi, M. H., Chen, L., & Ghazvini, M. (2020). Theoretical and experimental studies of heat transfer in a double-pipe heat exchanger equipped with twisted tape and nanofluid. European Physical Journal Plus, 135(2). https://doi.org/https://doi.org/10.1140/epjp/s13360-020-00252-8
- Ahmadi, M. H., Ghahremannezhad, A., Chau, K.-W., Seifaddini, P., Ramezannezhad, M., & Ghasempour, R. (2019). Development of simple-to-use predictive models to determine thermal properties of Fe2O3/water-ethylene glycol nanofluid. Computation, 7(1), 18. https://doi.org/https://doi.org/10.3390/computation7010018
- Ahmadi, M. H., Ghazvini, M., Maddah, H., Kahani, M., Pourfarhang, S., Pourfarhang, A., & Heris, S. Z. (2020). Prediction of the pressure drop for CuO/(ethylene glycol-water) nanofluid flows in the car radiator by means of artificial neural networks analysis integrated with genetic algorithm. Physica A: Statistical Mechanics and Its Applications, 546, 124008. https://doi.org/https://doi.org/10.1016/j.physa.2019.124008
- Al-Ansary, H., & Zeitoun, O. (2011). Numerical study of conduction and convection heat losses from a half-insulated air-filled annulus of the receiver of a parabolic trough collector. Solar Energy, 85(11), 3036–3045. https://doi.org/https://doi.org/10.1016/j.solener.2011.09.002
- Aladdin, N. A. L., Bachok, N., & Pop, I. (2020). Cu-Al2O3/water hybrid nanofluid flow over a permeable moving surface in presence of hydromagnetic and suction effects. Alexandria Engineering Journal, 59(2), 657–666. https://doi.org/https://doi.org/10.1016/j.aej.2020.01.028
- Alsabery, A. I., Gedik, E., Chamkha, A. J., & Hashim, I. (2020). Impacts of heated rotating inner cylinder and two-phase nanofluid model on entropy generation and mixed convection in a square cavity. Heat and Mass Transfer/Waerme- Und Stoffuebertragung, 56(1), 321–338. https://doi.org/https://doi.org/10.1007/s00231-019-02698-8
- Alsabery, A. I., Ismael, M. A., Chamkha, A. J., & Hashim, I. (2020). Effect of nonhomogeneous nanofluid model on transient natural convection in a non-Darcy porous cavity containing an inner solid body. International Communications in Heat and Mass Transfer, 110, 104442. https://doi.org/https://doi.org/10.1016/j.icheatmasstransfer.2019.104442
- Alsabery, A. I., Mohebbi, R., Chamkha, A. J., & Hashim, I. (2019). Impacts of magnetic field and non-homogeneous nanofluid model on convective heat transfer and entropy generation in a cavity with heated trapezoidal body. Journal of Thermal Analysis and Calorimetry, 138(2), 1371–1394. https://doi.org/https://doi.org/10.1007/s10973-019-08249-x
- Alsarraf, J., Moradikazerouni, A., Shahsavar, A., Afrand, M., Salehipour, H., & Tran, M. D. (2019). Hydrothermal analysis of turbulent boehmite alumina nanofluid flow with different nanoparticle shapes in a minichannel heat exchanger using two-phase mixture model. Physica A: Statistical Mechanics and Its Applications, 520, 275–288. https://doi.org/https://doi.org/10.1016/j.physa.2019.01.021
- Arani, A. A. A., Sadripour, S., & Kermani, S. (2017). Nanoparticle shape effects on thermal-hydraulic performance of boehmite alumina nanofluids in a sinusoidal–wavy mini-channel with phase shift and variable wavelength. International Journal of Mechanical Sciences, 128-129, 550–563. https://doi.org/https://doi.org/10.1016/j.ijmecsci.2017.05.030
- Ayoubi Ayoubloo, K., Ghalambaz, M., Armaghani, T., Noghrehabadi, A., & Chamkha, A. J. (2019). Pseudoplastic natural convection flow and heat transfer in a cylindrical vertical cavity partially filled with a porous layer. International Journal of Numerical Methods for Heat and Fluid Flow, 30(3), 1096–1114. https://doi.org/https://doi.org/10.1108/HFF-06-2019-0464
- Baghban, A., Sasanipour, J., Pourfayaz, F., Ahmadi, M. H., Kasaeian, A., Chamkha, A. J., Oztop, H. F., & Chau, K. W. (2019). Towards experimental and modeling study of heat transfer performance of water- SiO2 nanofluid in quadrangular cross-section channels. Engineering Applications of Computational Fluid Mechanics, 13(1), 453–469. https://doi.org/https://doi.org/10.1080/19942060.2019.1599428
- Barnoon, P., Toghraie, D., Eslami, F., & Mehmandoust, B. (2019). Entropy generation analysis of different nanofluid flows in the space between two concentric horizontal pipes in the presence of magnetic field: Single-phase and two-phase approaches. Computers and Mathematics with Applications, 77(3), 662–692. https://doi.org/https://doi.org/10.1016/j.camwa.2018.10.005
- Beigzadeh, M., Pourfayaz, F., & Ahmadi, M. H. (2020). Modeling and improvement of solid oxide fuel cell-single effect absorption chiller hybrid system by using nanofluids as heat transporters. Applied Thermal Engineering, 166, 114707. https://doi.org/https://doi.org/10.1016/j.applthermaleng.2019.114707
- Chamkha, A. J., Sazegar, S., Jamesahar, E., & Ghalambaz, M. (2019). Thermal non-equilibrium heat transfer modeling of hybrid nanofluids in a structure composed of the layers of solid and porous media and free nanofluids. Energies, 12(3), 541. https://doi.org/https://doi.org/10.3390/en12030541
- Corcione, M. (2011). Empirical correlating equations for predicting the effective thermal conductivity and dynamic viscosity of nanofluids. Energy Conversion and Management, 52(1), 789–793. https://doi.org/https://doi.org/10.1016/j.enconman.2010.06.072
- Dogonchi, A. S., Tayebi, T., Chamkha, A. J., & Ganji, D. D. (2020). Natural convection analysis in a square enclosure with a wavy circular heater under magnetic field and nanoparticles. Journal of Thermal Analysis and Calorimetry, 139(1), 661–671. https://doi.org/https://doi.org/10.1007/s10973-019-08408-0
- Ez Abadi, A. M., Sadi, M., Farzaneh-Gord, M., Ahmadi, M. H., Kumar, R., & Chau, K. W. (2020). A numerical and experimental study on the energy efficiency of a regenerative heat and mass exchanger utilizing the counter-flow Maisotsenko cycle. Engineering Applications of Computational Fluid Mechanics, 14(1), 1–12. https://doi.org/https://doi.org/10.1080/19942060.2019.1617193
- Fereidoon, A., Saedodin, S., Hemmat Esfe, M., & Noroozi, M. J. (2013). Evaluation of mixed convection in inclined square lid-driven cavity filled with al2o3/water nano-fluid. Engineering Applications of Computational Fluid Mechanics, 7(1), 55–65. https://doi.org/https://doi.org/10.1080/19942060.2013.11015453
- Gan, T., Ming, T., Fang, W., Liu, Y., Miao, L., Ren, K., & Ahmadi, M. H. (2020). Heat transfer enhancement of a microchannel heat sink with the combination of impinging jets, dimples, and side outlets. Journal of Thermal Analysis and Calorimetry, 141(1), 45–56. https://doi.org/https://doi.org/10.1007/s10973-019-08754-z
- Ghahremannezhad, A., Xu, H., Alhuyi Nazari, M., Hossein Ahmadi, M., & Vafai, K. (2019). Effect of porous substrates on thermohydraulic performance enhancement of double layer microchannel heat sinks. International Journal of Heat and Mass Transfer, 131, 52–63. https://doi.org/https://doi.org/10.1016/j.ijheatmasstransfer.2018.11.040
- Ghalandari, M., Mirzadeh Koohshahi, E., Mohamadian, F., Shamshirband, S., & Chau, K. W. (2019). Numerical simulation of nanofluid flow inside a root canal. Engineering Applications of Computational Fluid Mechanics, 13(1), 254–264. https://doi.org/https://doi.org/10.1080/19942060.2019.1578696
- Giwa, S. O., Sharifpur, M., & Meyer, J. P. (2020). Experimental study of thermo-convection performance of hybrid nanofluids of Al2O3-MWCNT/water in a differentially heated square cavity. International Journal of Heat and Mass Transfer, 148, 119072. https://doi.org/https://doi.org/10.1016/j.ijheatmasstransfer.2019.119072
- He, W., Toghraie, D., Lotfipour, A., Pourfattah, F., Karimipour, A., & Afrand, M. (2020). Effect of twisted-tape inserts and nanofluid on flow field and heat transfer characteristics in a tube. International Communications in Heat and Mass Transfer, 110(December 2019), 104440. https://doi.org/https://doi.org/10.1016/j.icheatmasstransfer.2019.104440
- Heris, S. Z., Kazemi-Beydokhti, A., Noie, S. H., & Rezvan, S. (2012). Numerical study on convective heat transfer of AL2O 3/water, CuO/water and Cu/water nanofluids through square cross-section duct in laminar flow. Engineering Applications of Computational Fluid Mechanics, 6(1), 1–14. https://doi.org/https://doi.org/10.1080/19942060.2012.11015398
- Hoseinzadeh, S., Moafi, A., Shirkhani, A., & Chamkha, A. J. (2019). Numerical validation heat transfer of rectangular cross-section porous fins. Journal of Thermophysics and Heat Transfer, 33(3), 698–704. https://doi.org/https://doi.org/10.2514/1.T5583
- Jilte, R., Ahmadi, M. H., Kumar, R., Kalamkar, V., & Mosavi, A. (2020). Cooling performance of a novel circulatory flow concentric multi-channel heat sink with nanofluids. Nanomaterials, 10(4), 647. https://doi.org/https://doi.org/10.3390/nano10040647
- Karami, M., Farahani, S. D., Kowsary, F., & Mosavi, A. (2020). Experimental estimation of temporal and spatial resolution of coefficient of heat transfer in a channel using inverse heat transfer method. Engineering Applications of Computational Fluid Mechanics, 14(1), 271–283. https://doi.org/https://doi.org/10.1080/19942060.2020.1712261
- Karimi, A., Al-Rashed, A. A. A. A., Afrand, M., Mahian, O., Wongwises, S., & Shahsavar, A. (2019). The effects of tape insert material on the flow and heat transfer in a nanofluid-based double tube heat exchanger: Two-phase mixture model. International Journal of Mechanical Sciences, 156(April), 397–409. https://doi.org/https://doi.org/10.1016/j.ijmecsci.2019.04.009
- Khodabandeh, E., Boushehri, R., Akbari, O. A., Akbari, S., & Toghraie, D. (2020). Numerical investigation of heat and mass transfer of water—Silver nanofluid in a spiral heat exchanger using a two-phase mixture method. Journal of Thermal Analysis and Calorimetry, 144, 1003–1012. https://doi.org/https://doi.org/10.1007/s10973-020-09533-x
- Kim, D., Kwon, Y., Cho, Y., Li, C., Cheong, S., Hwang, Y., Lee, J., Hong, D., & Moon, S. (2009). Convective heat transfer characteristics of nanofluids under laminar and turbulent flow conditions. Current Applied Physics, 9(2 Suppl), e119–e123. https://doi.org/https://doi.org/10.1016/j.cap.2008.12.047
- Leong, W. H., Hollands, K. G. T., & Brunger, A. P. (1998). Experimental Nusselt numbers for a cubical-cavity benchmark problem in natural convection. International Journal of Heat and Mass Transfer, 42(11), 1979–1989. https://doi.org/https://doi.org/10.1016/S0017-9310(98)00299-3
- Maddah, H., Ghazvini, M., & Ahmadi, M. H. (2019). Predicting the efficiency of CuO/water nanofluid in heat pipe heat exchanger using neural network. International Communications in Heat and Mass Transfer, 104(March), 33–40. https://doi.org/https://doi.org/10.1016/j.icheatmasstransfer.2019.02.002
- Mahdavi, M., Sharifpur, M., & Meyer, J. P. (2017). A novel combined model of discrete and mixture phases for nanoparticles in convective turbulent flow. Physics of Fluids, 29(8), 082005. https://doi.org/https://doi.org/10.1063/1.4998181
- Mashayekhi, R., Khodabandeh, E., Bahiraei, M., Bahrami, L., Toghraie, D., & Akbari, O. A. (2017). Application of a novel conical strip insert to improve the efficacy of water–Ag nanofluid for utilization in thermal systems: A two-phase simulation. Energy Conversion and Management, 151, 573–586. https://doi.org/https://doi.org/10.1016/j.enconman.2017.09.025
- Mehryan, S. A. M., Izadi, M., Namazian, Z., & Chamkha, A. J. (2019). Natural convection of multi-walled carbon nanotube–Fe3O4/water magnetic hybrid nanofluid flowing in porous medium considering the impacts of magnetic field-dependent viscosity. Journal of Thermal Analysis and Calorimetry, 138(2), 1541–1555. https://doi.org/https://doi.org/10.1007/s10973-019-08164-1
- Mehryan, S. A. M., Izadpanahi, E., Ghalambaz, M., & Chamkha, A. J. (2019). Mixed convection flow caused by an oscillating cylinder in a square cavity filled with Cu–Al2O3/water hybrid nanofluid. Journal of Thermal Analysis and Calorimetry, 137(3), 965–982. https://doi.org/https://doi.org/10.1007/s10973-019-08012-2
- Milani Shirvan, K., Mamourian, M., Mirzakhanlari, S., & Ellahi, R. (2017). Numerical investigation of heat exchanger effectiveness in a double pipe heat exchanger filled with nanofluid: A sensitivity analysis by response surface methodology. Powder Technology, 313, 99–111. https://doi.org/https://doi.org/10.1016/j.powtec.2017.02.065
- Neyestani, M., Nazari, M., Shahmardan, M. M., Sharifpur, M., Ashouri, M., & Meyer, J. P. (2019). Thermal characteristics of CPU cooling by using a novel porous heat sink and nanofluids: Comparative experimental study. Journal of Thermal Analysis and Calorimetry, 138(1), 805–817. https://doi.org/https://doi.org/10.1007/s10973-019-08256-y
- Patankar, S. V. (1980). Numerical heat transfer and fluid flow. https://doi.org/https://doi.org/10.13182/nse81-a20112
- Ramezanizadeh, M., Alhuyi Nazari, M., Ahmadi, M. H., & Chau, K. W. (2019). Experimental and numerical analysis of a nanofluidic thermosyphon heat exchanger. Engineering Applications of Computational Fluid Mechanics, 13(1), 40–47. https://doi.org/https://doi.org/10.1080/19942060.2018.1518272
- Sadripour, S. (2019). 3D numerical analysis of atmospheric-aerosol/carbon-black nanofluid flow within a solar air heater located in Shiraz, Iran. International Journal of Numerical Methods for Heat and Fluid Flow, 29(4), 1378–1402. https://doi.org/https://doi.org/10.1108/HFF-04-2018-0169
- Sadripour, S., & Chamkha, A. J. (2019). The effect of nanoparticle morphology on heat transfer and entropy generation of supported nanofluids in a heat sink solar collector. Thermal Science and Engineering Progress, 9, 266–280. https://doi.org/https://doi.org/10.1016/j.tsep.2018.12.002
- Salari, A., Kazemian, A., Ma, T., Hakkaki-Fard, A., & Peng, J. (2020). Nanofluid based photovoltaic thermal systems integrated with phase change materials: Numerical simulation and thermodynamic analysis. Energy Conversion and Management, 205, 112384. https://doi.org/https://doi.org/10.1016/j.enconman.2019.112384
- Samadifar, M., & Toghraie, D. (2018). Numerical simulation of heat transfer enhancement in a plate-fin heat exchanger using a new type of vortex generators. Applied Thermal Engineering, 133, 671–681. https://doi.org/https://doi.org/10.1016/j.applthermaleng.2018.01.062
- Selimefendigil, F., Öztop, H. F., & Chamkha, A. J. (2019). Mixed convection of pulsating ferrofluid flow over a backward-facing step. Iranian Journal of Science and Technology, Transactions of Mechanical Engineering, 43(4), 593–612. https://doi.org/https://doi.org/10.1007/s40997-018-0238-x
- Sharifpur, M., Solomon, A. B., Ottermann, T. L., & Meyer, J. P. (2018). Optimum concentration of nanofluids for heat transfer enhancement under cavity flow natural convection with TiO2 – Water. International Communications in Heat and Mass Transfer, 98(October), 297–303. https://doi.org/https://doi.org/10.1016/j.icheatmasstransfer.2018.09.010
- Sharma, J. P., Sharma, A., Jilte, R. D., Kumar, R., & Ahmadi, M. H. (2020). A study on thermohydraulic characteristics of fluid flow through microchannels. Journal of Thermal Analysis and Calorimetry, 140(1), 1–32. https://doi.org/https://doi.org/10.1007/s10973-019-08741-4
- Shashikumar, N., Gireesha, B. J., Mahanthesh, B., Prasannakumara, B., & Chamkha, A. J. (2019). Entropy generation analysis of magneto-nanoliquids embedded with aluminium and titanium alloy nanoparticles in microchannel with partial slips and convective conditions. International Journal of Numerical Methods for Heat and Fluid Flow, 29(10), 3638–3658. https://doi.org/https://doi.org/10.1108/HFF-06-2018-0301
- Sheikholeslami, M., Jafaryar, M., Abohamzeh, E., Shafee, A., & Babazadeh, H. (2020). Energy and entropy evaluation and two-phase simulation of nanoparticles within a solar unit with impose of new turbulator. Sustainable Energy Technologies and Assessments, 39, 100727. https://doi.org/https://doi.org/10.1016/j.seta.2020.100727
- Siavashi, M., Bahrami, H. R. T., & Saffari, H. (2017). Numerical investigation of porous rib arrangement on heat transfer and entropy generation of nanofluid flow in an annulus using a two-phase mixture model. Numerical Heat Transfer, Part A: Applications, 71(12), 1251–1273. https://doi.org/https://doi.org/10.1080/10407782.2017.1345270
- Tayebi, T., Chamkha, A. J., & Djezzar, M. (2019). Natural convection of CNT-water nanofluid in an annular space between confocal elliptic cylinders with constant heat flux on inner wall. Scientia Iranica, 26(5 B), 0–0. https://doi.org/https://doi.org/10.24200/sci.2018.21069
- Varzaneh, A. A., Toghraie, D., & Karimipour, A. (2020). Comprehensive simulation of nanofluid flow and heat transfer in straight ribbed microtube using single-phase and two-phase models for choosing the best conditions. Journal of Thermal Analysis and Calorimetry, 139(1), 701–720. https://doi.org/https://doi.org/10.1007/s10973-019-08381-8
- Vatani, A., & Mohammed, H. A. (2013). Turbulent nanofluid flow over periodic rib-grooved channels. Engineering Applications of Computational Fluid Mechanics, 7(3), 369–381. https://doi.org/https://doi.org/10.1080/19942060.2013.11015478
- Xu, Y., Islam, M. D., & Kharoua, N. (2017). Numerical study of winglets vortex generator effects on thermal performance in a circular pipe. International Journal of Thermal Sciences, 112. https://doi.org/https://doi.org/10.1016/j.ijthermalsci.2016.10.015