
 ?Mathematical formulae have been encoded as MathML and are displayed in this HTML version using MathJax in order to improve their display. Uncheck the box to turn MathJax off. This feature requires Javascript. Click on a formula to zoom.
Abstract
Cage-type control valves are widely used in process industries, but cavitation can occur when the valves are used in extreme high-pressure drop and large volume flow rate conditions. In this study, the cage-type control valve with improved valve cages is introduced, and its flow and cavitation characteristics are compared with other cage-type control valves with no dead zones in the regulation process. Two cage numbers and four valve cage structures are studied. Numerical simulations are conducted, and their accuracy is validated using experimental results. Results show that cage-type control valves with valve cage 1 have the maximum flow coefficient and cavitation intensity under the same cage number. Cage-type control valves with valve cage 2 have the minimum flow coefficient but medium cavitation intensity. While cage-type control valves with improved valve cages have a medium flow coefficient but minimum cavitation intensity, and water vapor volume can be reduced by 2–8 times compared with cage-type control valves with the valve cage 2. Furthermore, for cage-type control valves with improved valve cages, the cavitation intensity, and flow coefficient decrease as the cage number and groove height increase.
Introduction
Control valves are key components used to regulate flow and pressure in many process industries, such as the nuclear power and thermal power stations. Usually, the volume flow rate of control valves increases monotonously as the pressure drop between the valve inlet and the valve outlet increases, but a choked flow appears when the pressure drop is large. For incompressible working fluid, cavitation or flashing phenomenon is the main reason for choked flow, which can eventually result in valve vibration, noise, or even valve damage.
To determine whether a control valve is suitable for a specific system and has a good performance, the flow characteristics curve which is the flow coefficient under different valve openings is often taken as a key indicator. To date, many works have been done about the flow characteristics of control valves, and mainly three aspects are focused, namely, the effects of the structure of control valves, the effects of the manufacturing method, and methods to calculate the flow characteristics directly. The computational fluid dynamics (CFD) method is the most welcomed method and the machine learning method is also adopted to accelerate calculation time (Mosavi et al., Citation2019 and Ramezanizadeh et al., Citation2019). Qian et al. (Citation2020b, Citation2020c) focused on globe valves and they investigated the effects of the valve core shape and the throttling window shape on the flow characteristics. Lin et al. (Citation2017) added two types of regulators to a sleeve regulating valve, and the structure of the regulator was similar to a normal valve cage, and their results showed that the flow coefficient and the velocity in the valve throat were decreased. Asim et al. (Citation2019) designed a new control valve that had a valve trim made of a staggered arrangement of columns, and they studied the flow capacity of the control valve under different flow path sizes. Qian et al. (Citation2020d) investigated the arrangement of the pilot pipe on the valve characteristics in a globe valve. Singh et al. (Citation2020) found that compared with the Electron Discharge Machining method, the Selective Laser Melting method would lead to a high surface roughness of the valve trim and a low flow capacity in control valves. Sun et al. (Citation2017) found that the roughness height affected the flow coefficient of butterfly valves during numerical simulations, which led to the difference between the numerical and simulated results. Li et al. (Citation2020b) optimized a balance valve to deal with the hydraulic maladjustment, and they found that machining burrs on the valve core surface affected the flow rate. Chern et al. (Citation2015) discussed the effects of the flow cross-area of a single cage and multi cages in a globe valve on flow characteristics. Lisowski and Filo (Citation2017) improved the flow characteristics under low velocity by creating additional undercuts in a proportional control valve, and they found that the flow coefficient could be obtained by the valve spool position and the flow rate.
When cavitation cannot be prevented, it is better to find an appropriate method to reduce cavitation intensity. By now, the commonly used method is to optimize the valve structure or add additional valve trims (Qian et al., Citation2019). Jin et al. (Citation2018, Citation2020) carried out numerical simulations to study the effects of the valve core shape and the valve body structure on cavitation intensity in globe valves, and four types of valve core shape were compared and the valve body structure was optimized. Yang et al. (Citation2015) found that the flapper shape affected cavitation intensity in a flapper-nozzle servo-valve, and their results showed that a rectangle shape could reduce cavitation intensity. Saha et al. (Citation2020) found that outlet pressure played an important role in reducing cavitation intensity of a servo valve. Gao et al. (Citation2006) found that the outlet flow area and the inlet velocity affected cavitation intensity in a poppet valve, and cavitation intensity could be reduced by decreasing the outlet flow area and the inlet velocity. Qiu et al. (Citation2019) investigated cavitation intensity under different pressure drops and different valve openings, and their results showed that the effects of pressure drop on cavitation intensity increased as the valve opening decreased. Qian et al. (Citation2020a) focused on cavitation intensity of bileaflet mechanical heart valves with different structural parameters, and structural parameters that could reduce cavitation intensity were found. Yaghoubi et al. (Citation2018) investigated cavitation in globe control valves under different numbers of trims, and they found that when the number of trims was larger than 2, there was no significant difference in cavitation intensity. Liu et al. (Citation2020) focused on the development process of cavitation in a regulating valve. Li et al. (Citation2020aa) discussed the effects of the cage number, the working temperature, and the working pressure on cavitation intensity in a globe valve, and they found that cavitation could be delayed by adding valve cages. Chern et al. (Citation2013) found that cavitation bubbles could be restricted in the vicinity of cages if two perforated valve cages were added in a globe valve. Han et al. (Citation2017) found that a two-stage throttle valve had better cavitation suppression ability than a single-stage throttle valve.
The labyrinth control valve, multi-stage and single flow path control valve, and multi-stage and multi-flow path control valve are commonly used to prevent or delay the occurrence of a choked flow under high-pressure drop conditions. There are dead zones in the regulation process for the labyrinth control valve due to structural limitations. While for the multi-stage and single flow path control valve, its decompression ability is limited. Based on the literature research, the cage-type control valve, which can be one of the multi-stage and multi-flow path control valves, has wide applications.
In this study, numerical methods are used to compare the flow and cavitation characteristics of cage-type control valves without dead zones in the regulation process to determine valve cages with better performance. First, the normal structure of cage-type control valves is illustrated, and a newly improved valve cage structure is introduced. Second, flow coefficient tests are conducted to validate the accuracy of the adopted numerical methods, then a comparison between normal cage-type control valves and the improved cage-type control valve is conducted in terms of the flow and cavitation characteristics. Finally, key parameters, including the groove structure between two adjacent cages and cage number, are focused on finding a better valve cage structure to reduce the cavitation intensity.
Model
Physic model
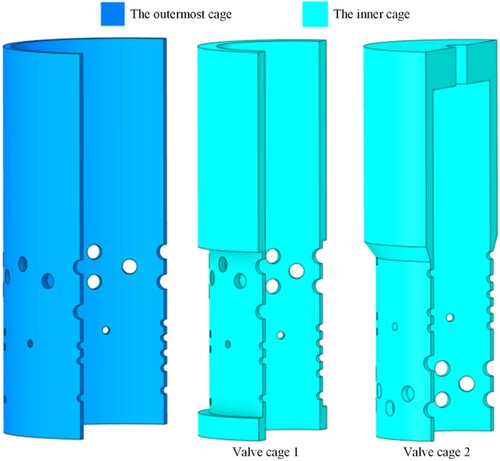
A typical cage-type control valve structure is shown in Figure . It consists of the valve body, valve seat, valve cage, valve core, valve bonnet, and valve stem. When used in high-pressure drop conditions, multi-cages are required. The commonly used multi-cages are shown in Figure , where the cage number can be adjusted according to relevant demand. Figure shows that there are dead zones in the regulation process if the mentioned commonly used multi-cages are installed in control valves. Figure shows the commonly used multi-cages to avoid dead zones during the regulation process, where the structure of the outermost cage is the same. For valve cage 1, the cage number can be adjusted according to relevant demand. For valve cage 2, the valve core of cage-type control valves is replaced by a movable valve cage. Furthermore, the valve cages shown in Figure have limited decompression ability.
Figure 1. Structure of a typical cage-type control valve.
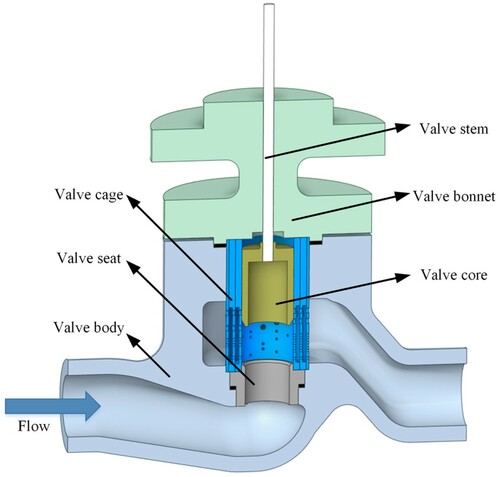
Figure 2. Commonly used multi-cages for high-pressure drop conditions.
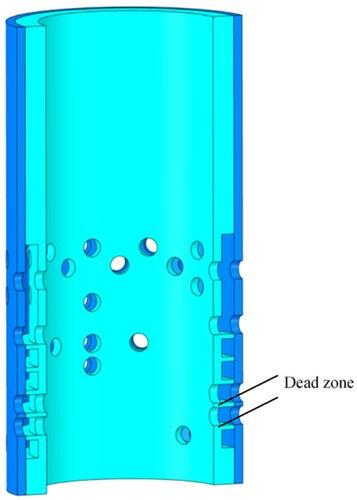
Figure 3. Commonly used multi-cages without dead zones in the regulation process.
Therefore, an improved structure of the multi-cages combining the advantages of the mentioned valve cage shown in Figures and is proposed. The diameter of orifices on each original valve cage is reduced by half for the improved valve cage structure, and the full circumferential grooves between two adjacent valve cages are changed to partial circumferential grooves. Figure shows the improved multi-cages. Compared with other multi-cages, the improved multi-cages will not only avoid dead zones in the regulation process but also reduce valve travel.
Figure 4. Improved structure of multi-cages without dead zones in the regulation process.
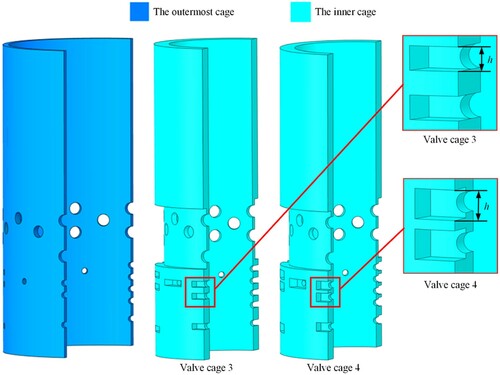
This study focuses on the flow and cavitation characteristics of cage-type control valves without dead zones in the regulation process; thus, four kinds of valve cages are discussed. The cage-type control valve designed in this study is used under the following conditions. When the valve opening is less than 50%, there is a high-pressure drop, and when the valve opening is greater than 50%, there is a low-pressure drop. Therefore, no partial circumferential grooves are designed in the improved multi-cages for large valve openings. Also, note that the only difference between valve cages 3 and 4 is the height of partial circumferential grooves. For valve cage 3, the groove height h is larger than the adjacent orifice diameter, whereas, for valve cage 4, the groove height h is equal to the adjacent orifice diameter.
Additional information on investigated cage-type control valves is as follows. The dimensions and arrangement of orifices on valve cages remain constant. The nominal diameter of the investigated cage-type control valve, Dv, is 50 mm, the maximum valve travel is 40 mm. The upstream pipe length is 2 Dv and the downstream pipe length is 6 Dv. When valve cages 1, 3, and 4 are installed, the diameter of the valve seat is 17 mm, whereas, when valve cage 2 is installed, the diameter of the valve seat is 22 mm. The thickness of orifices located on valve cages is 2 mm, and the thickness of grooves is 3 mm.
Numerical model
The working fluid is water and water vapor under 60 °C. The commercial software ANSYS Fluent based on the finite volume method is used. The Realizable k-ϵ turbulence model resulting in little difference when predicting cavitation compared with the SST k-ω turbulence model (Han et al., Citation2017), and scalable wall functions are applied to solve Navier-Stokes equations. The transportation equations of the applied turbulence model are shown as follows.
(1)
(1)
(2)
(2)
Here ρ is the density of water, u is the velocity of water, k is the turbulence kinetic, ϵ is the turbulence dissipation, υ is the viscosity of water.
The cavitation model proposed by Zwart-Gerber-Belamri (Zwart et al., Citation2004) is used to capture the cavitation phenomenon inside valves. The relevant equations are shown as follows.
(3)
(3)
(4)
(4)
Here, represents the mass transfer caused by condensation,
represents the mass transfer caused by evaporation. Fp is the condensation coefficient and is 0.01 by default, Fd is the evaporation coefficient and is 50 by default, and R is the bubble radius and is 10−6 m by default. p is the pressure, and psat is the saturated vapor pressure, α is the vapor volume fraction, subscript v is the vapor phase, subscript l is the liquid phase, αnuc is the nucleation site volume fraction, and is 5×10⁻⁴ by default.
Used boundary conditions and numerical schemes are listed and shown in Table , it is worth noticing that heat transfer is not considered, and there are two inlet pressure to obtain the flow characteristics and cavitation characteristics. The flow coefficients are obtained when inlet pressure is 1.0 MPa because cavitation should not appear. The cavitation characteristics are obtained when inlet pressure is 16.81 MPa, which is an actual pressure.
Table 1. Applied boundary conditions and numerical schemes.
Model verification
To validate the accuracy of the used numerical models, the flow coefficient of a similar cage-type control valve is tested, and the experimental results are used to compare with the numerical results.
The expression of the flow coefficient Cv is shown in EquationEq. (5(5)
(5) ).
(5)
(5) Here, Q is the volume flow rate (m3/h), ρ0, a reference value, is the water density under 15 °C (kg/m3), ρ is the water density under the investigated temperature, Δp is the pressure difference between the upstream and the downstream of the investigated cage-type control valves (kPa).
The nominal diameter of the tested valve, D, is 50 mm. The sketch of the test rig is shown in Figure . The main components of the test rig are a water tank, gate valves, pressure transducers, differential pressure transducers, a flowmeter, a pump, and the tested cage type control valve. The accuracy of the flowmeter is 0.35% rate, and the accuracy of the differential transducers is 0.3% rate. The distance between the upstream pressure detection point and the tested valve is 2D, and the distance between the downstream pressure detection point and the tested valve is 6D. For each valve opening, three data of volume flow rate and three data of pressure difference are recorded, and all experimental results recorded by transducers and instruments can be directly transferred to a computer. According to the uncertainties of the measured volume flow rate, pressure difference, and density of water, the uncertainties of obtained flow coefficients under different valve openings range from ±0.16 to ±0.65. The experimentally tested flow coefficients are shown in Figure .
Figure 5. The tested cage-type control valve, the mesh, and the sketch of the test rig.
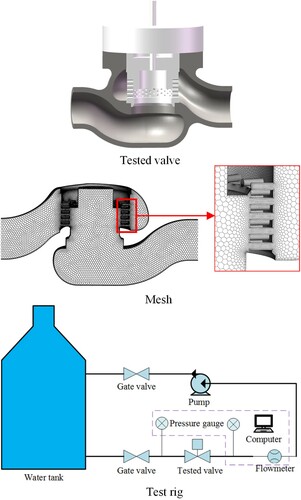
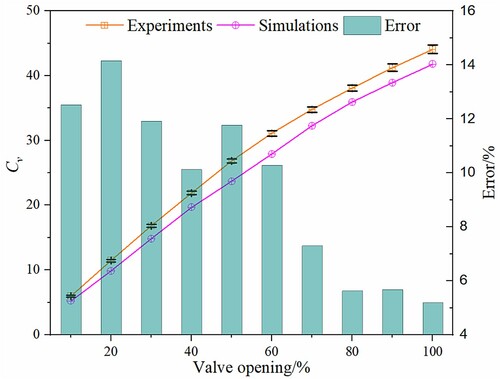
Figure 6. Comparison between the experimental results and simulated results.
To eliminate the effects of the grid on numerical results, a grid independence check when the valve is fully opened is made, and flow coefficients under three different grid numbers are compared and are shown in Table . Based on the Grid Convergence Method (GCI) method, is 0.011, so the numerical uncertainty is ±0.4. Therefore, grid set 2 is used finally considering the simulation time and accuracy of simulated results. Furthermore, to save simulation time, the GCI method for other valve openings is not carried out.
Table 2. The maximum flow coefficient of the tested cage-type control valve under different grid numbers.
The comparison between the simulated results and experimental results is also shown in Figure . Figure shows that the errors between the experimental results and simulated results are large under small valve openings, and the maximum error is 14.15%, while the errors are within 10% under large valve openings. The Large difference can result from the manufacturing and assembly errors, under small valve openings, the effects of the accuracy of the manufacturing and assembly on flow coefficients are large. A small error in assembly can result in a large difference in flow coefficient. To sum up, the numerical models used in this study have sufficient accuracy to capture flow characteristics in the investigated control valves.
Results and discussion
Two inlet pressure are used to investigate the flow and cavitation characteristics of different types of cage-type control valves without dead zones in the regulation process. The flow characteristics are compared in terms of the flow coefficient, and the cavitation characteristics are compared in terms of water vapor distributions and water vapor volume.
Flow characteristics
Figure shows the pressure distributions when the valve opening is 50%, and the cage number is two. It has been discovered that in cage-type control valves with valve cage 1, there is a large pressure drop after water flows through the first valve cage, but the pressure variation is not obvious. This is because the second cage is similar to a fixed perforated plate, and its decompression ability is low. For cage-type control valves with valve cages 2 and 4, the pressure variation near valve cages is more even compared with cage-type control valves with valve cage 1. From Figure , the pressure is maximum between the inner and outer cages in a cage-type control valves with cage 2, and it is minimum in cage-type control valves with cage 1. The reason is that water collides with the wall of the second valve cage after flowing out of the inner valve cage in cage-type control valves with cage 2, which leads to higher resistance.
Figure 7. Pressure distributions when the valve opening is 50% and the cage number is two.
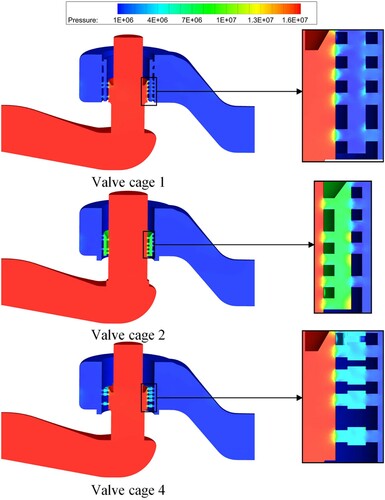
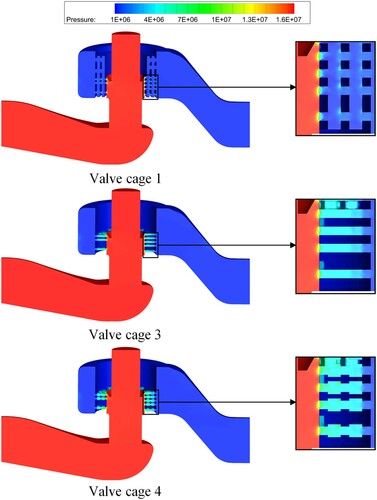
Figure shows the pressure distributions when the valve opening is 50%, and the cage number is three. For cage-type control valves with valve cage 1, a large pressure drop appears before and after the first valve cage, but the pressure variation is not significant for the outer valve cage. There is an obvious pressure drop for cage-type control valves with valve cages 3 and 4, except for the middle valve cage. Furthermore, from Figure , the decompression ability of cage-type control valves increases as the groove height increases.
Figure 8. Pressure distributions when the valve opening is 50% and the cage number is three.
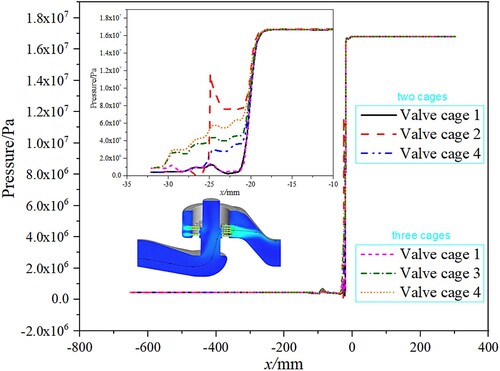
The pressure along a specific streamline is shown in Figure to quantitatively compare the pressure distributions. Also, from Figure , pressure distributions in different cage types of control valves are nearly the same before the water flows into the valve cage and after the water flows outside the valve cage, but pressure variation appears inside the valve cages. When the cage number is two, there are two obvious decompression processes for cage-type control valves with the valve cages 2 and 4, and pressure in cage-type control valves with valve cage 2 is higher. When the cage number is three, the pressure distributions for cage-type control valves with valve cage 1 barely change, and the pressure changes more smoothly as the groove height increases. Furthermore, for cage-type control valves with valve cage 1, the cage number has little effect on the pressure distribution, and the effects of groove height on the pressure distribution are higher than the cage number.
Figure 9. Pressure along a specific streamline in different cage-type control valves.
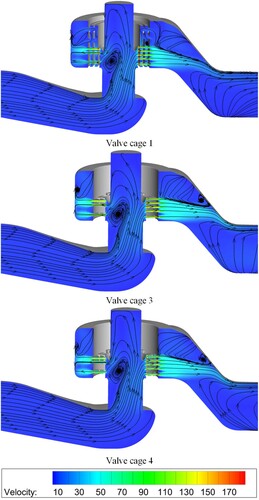
The velocity and streamline distributions on the symmetry plane when the valve opening is 50% are shown in Figures and . The streamlines and velocity distributions on the symmetry plane of cage-type control valves with the valve cages 1, 3, and 4 are similar when Figures and are combined. However, the streamline on the symmetry plane in cage-type control valves with valve cage 2 is different. The reason is that the diameter of the valve seat in cage-type control valves with valve cage 2 is different.
Figure 10. Velocity and streamline on the symmetry plane in different cage-type control valves when the cage number is two.
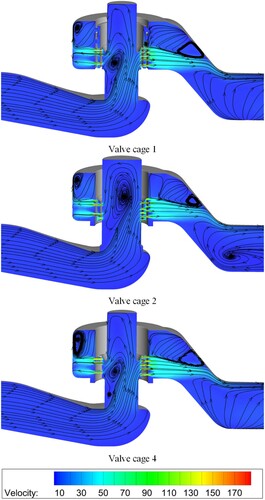
Figure 11. Velocity and streamline on the symmetry plane in different cage-type control valves when the cage number is three.
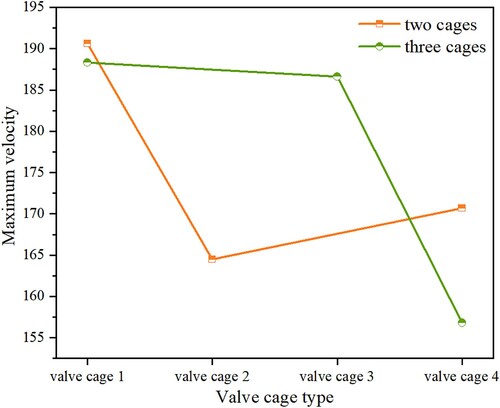
The maximum velocity in different cage-type control valves is shown in Figure . For the same valve cage, the maximum velocity decreases as the cage number increases. For the same cage number, the maximum velocity decreases as the groove height increases. The maximum velocity in cage-type control valves with valve cage 2 is higher than cage-type control valves with valve cage 4, but it is lower than cage-type control valves with valve cage 3.
Figure 12. Maximum velocity inside different cage type control valves.
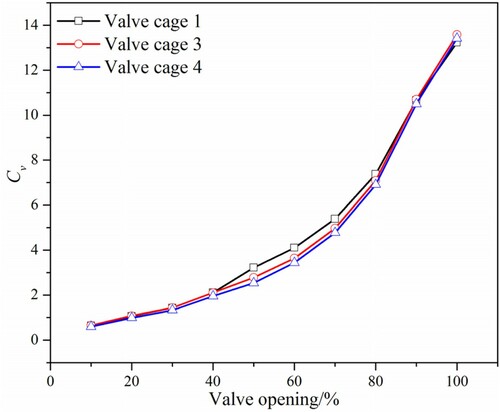
When the cage number is three, the flow coefficients in different valve openings are shown in Figure . There is the maximum flow coefficient for cage-type control valve with valve cage 1. The reason is that, except for the innermost valve cage, the valve cages are similar to a fixed perforated plate, and their effects on the flow coefficient do not change with the variation of the valve opening. Therefore, the flow resistance is the minimum, and the flow coefficient is the maximum. From Figure , there is a significant difference in the flow coefficient between different cage-type control valves when the valve opening varies from 50% to 80%. This is because, under small valve openings, the total cross-area of orifices located on the innermost valve cage is small, which means that the innermost cage mainly causes the flow resistance; thus, the difference in the flow coefficient under different cage-type control valves is small. While under large valve openings, the flow capacity is also restricted by the valve seat diameter; thus, there is also a small difference in the flow coefficient under different cage-type control valves. Furthermore, the flow coefficient is also affected by the height of the grooves, and the flow coefficient has a minimum when the height of the grooves is larger than the diameter of the orifice located on valve cages. This is because, under this circumstance, the flow cross-area has an obvious change between two adjacent valve cages, which increases in the flow resistance.
Figure 13. Flow coefficients in the investigated cage-type control valves when the cage number is three.
When the valve cage number is two, the flow coefficients under different valve openings are shown in Figure . Figure shows the effects of the cage number on the flow coefficient more directly. For cage-type control valves with valve cage 4, the flow coefficient has an obvious increase as the cage number decreases, whereas the difference in the flow coefficient under different cage numbers is not significant for cage-type control valves with valve cage 1. From Figures and , for cage-type control valves with valve cage 2, even though both cages have the regulation ability under different valve openings, the flow coefficient is still the minimum, consistent with the above-analyzed results.
Figure 14. Flow coefficients in the investigated cage-type control valves when the cage number is two.
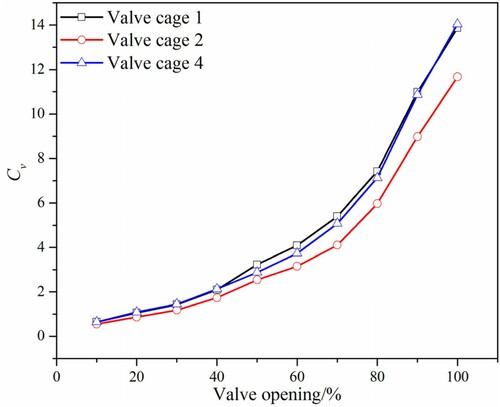
Figure 15. Flow coefficient under different cage numbers.
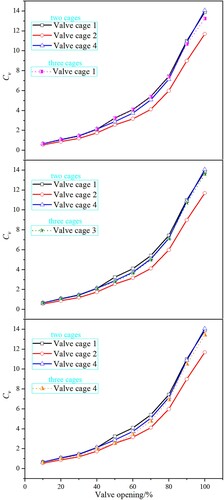
Based on the above analysis, a comparison of the flow characteristics for different valve cages is summarized and shown in Table . Specially, the flow coefficient for cage-type control valves with valve cage 1 is the highest, and the flow coefficient decreases as the cage number increases. The flow coefficient for cage-type control valves with valve cage 2 is the lowest. There is the medium flow coefficient for cage-type control valves with valve cages 3 and 4, and the flow coefficient decreases as the cage number or groove height increases.
Table 3. Summary of the flow characteristics for different cage-type control valves with different valve cages.
Cavitation characteristics
When a control valve is used in a high-pressure drop and high volume flow rate condition, multi-stage pressure reduction is a must to suppress cavitation. However, under some extreme circumstances, the pressure drop between the valve inlet and the valve outlet is so high that the pressure recovery coefficient of the control valve is close to 1, which makes the complete suppression of the cavitation phenomenon unlikely. Therefore, a control valve that has the minimum cavitation intensity is a better choice.
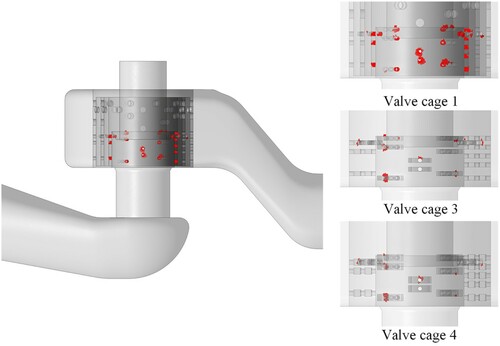
Figures and show the distribution of water vapor in the cage-type control valves investigated when the water vapor volume fraction is above 0.5. The water vapor mainly appears inside the outermost valve cage, and the water vapor volume is higher for cage-type control valves with valve cage 1. This is because when water flows through a valve cage, let us assume the pressure before the valve cage is p1, the pressure inside the valve cage but near the valve cage outlet is p2, and the pressure after the valve cage is p3. Then, there is p1> p3> p2, and the larger p1, a smaller p2. If p2 is smaller than the saturated vapor pressure, cavitation occurs. From Figure , when the cage number is two, the water vapor volume in the cage-type control valves with valve cage 4 is lower than the cage-type control valves with valve cage 2. This is because, under a large valve opening, the decompression ability of the outermost cage is lower with a large opening due to a large flow cross-area for cage-type control valves with valve cage 2. The same results can be obtained when the cage number is three, as shown in Figure . Furthermore, compared Figures and , for cage-type control valves with partial circumferential grooves, the water vapor volume decreases as the groove height increases, but the variation of water vapor volume is not obvious.
Figure 16. Water vapor distribution in cage-type control valves when the cage number is two.
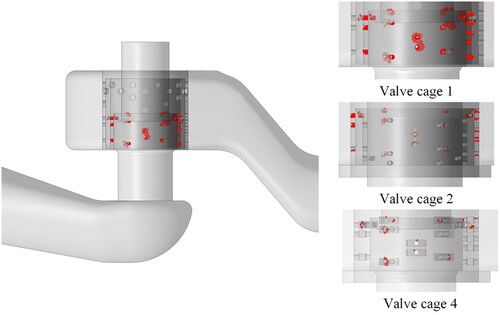
Figure 17. Water vapor distribution in cage-type control valves when the cage number is three.
During numerical simulations, the flow channel of cage-type control valves is divided into different small volumes; when the water vapor volume fraction in a small volume is larger than 0.5, cavitation can cause severe damage (Chern et al., Citation2013). When the water vapor volume fraction is larger than 0.5, the total water vapor volume in investigated cage-type control valves can be obtained and expressed as EquationEq. (6(6)
(6) ).
(6)
(6) Here vof is the total water vapor volume when the water vapor volume fraction is larger than 0.5.
Figure shows the water vapor volume in different cage-type control valves and valve openings. It can be found that the water vapor volume increases with the increase of valve opening, which is because of an increase in the flow cross-area as the valve opening increases, increasing water vapor volume. Also, the water vapor volume for cage-type control valves with valve cage 1 has a larger value. The reason is that the decompression ability of this valve structure is the lowest, and the flow cross-area of this valve structure is the largest. For cage-type control valves with valve cage 2, the water vapor volume is larger than cage-type control valves with partial circumferential grooves. Furthermore, for cage-type control valves with partial circumferential grooves, the variation in water vapor volume under different groove heights and cage numbers is not significant.
Figure 18. Water vapor volume in different cage-type control valves.
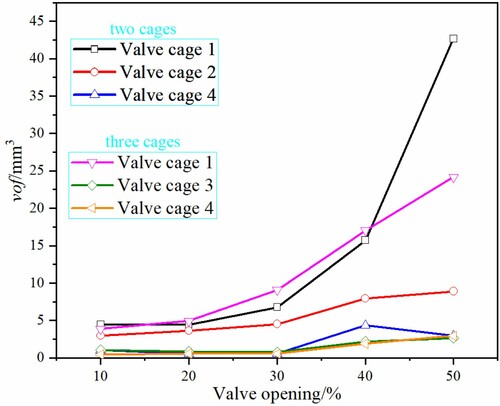
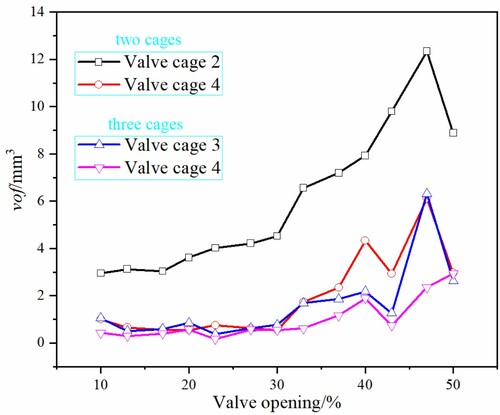
Figure shows the water vapor volume in different valve openings when the cage number is two. Here, the water vapor volume in cage-type control valves with valve cage 2 is expressed as vof1, and the water vapor volume in cage-type control valves with valve cage 4 is expressed as vof2. As shown in Figure , there is a large difference in the water vapor volume, and the water vapor volume in cage-type control valves with valve cage 2 is 8 times of cage-type control valves with valve cage 4 if the valve opening is 30%. Also, maximum water vapor volume appears when the valve opening ranges from 45% to 50%, which is because orifices of the valve cage are partially covered by the valve core or the inner valve cage, which increases the velocity and decreases pressure. Figure shows the water vapor volume in different cage-type control valves and valve openings. From Figure , when there are partial circumferential grooves, the water vapor volume under different cage numbers barely changes, and the variation of water vapor volume under different groove heights is also not significant except when the valve opening ranges from 30% to 50%. In summary, cage-type control valves with valve cage 4 and three cage numbers have minimum water vapor volume, which means the minimum cavitation intensity can be found.
Figure 19. Water vapor volume in the investigated cage-type control valves when the cage number is two.
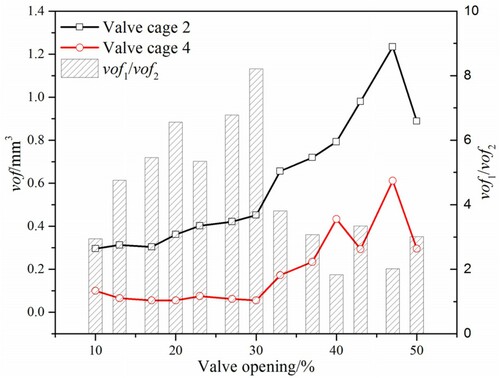
Figure 20. Water vapor volume in the investigated cage-type control valve under different valve openings.
A comparison of the cavitation characteristics for different valve cages is summarized and shown in Table . The highest cavitation intensity for cage-type control valves with valve cage 1, and the lowest cavitation intensity for cage-type control valves with partial circumferential grooves, are found. For cage-type control valves with valve cage 2, the cavitation intensity is medium.
Table 4. Summary of the cavitation characteristics for different cage-type control valves with different valve cages.
Conclusion
In this study, cage-type control valves with improved valve cages, which have the advantages of no dead zones in the regulation process and more applicable in higher pressure drop conditions, are introduced. The flow and cavitation characteristics of different cage-type control valves with no dead zones in the regulation process are compared. Four types of valve cages are studied: the cage with a full groove in the circumferential and axial directions between two adjacent cages, the cage with a full groove but the innermost cage is movable, and two other types of improved cages. First, the flow coefficient tests are conducted to verify the used numerical methods, and then the validated numerical methods are used to obtain the flow and cavitation distributions.
The results show that the cage-type control valves with valve cage 1 have the highest flow coefficient and maximum velocity under the same cage number, and the flow coefficient increases as the cage number increases. For cage-type control valves with valve cage 2, the flow coefficient is the lowest, and the maximum velocity is the minimum under the same cage number. While a medium flow coefficient can be obtained for cage-type control valves with improved valve cages, and the flow coefficient decreases as the groove height and cage number increase. Furthermore, cage-type control valves have the lowest maximum velocity with valve cage 4 and three cage numbers.
The results also show that cavitation intensity is maximum for cage-type control valves with valve cage 1. For cage-type control valves with valve cage 2, the water vapor volume inside the valve is more than 2 times of cage-type control valves with improved valve cages. The cavitation intensity is minimum for cage-type control valves with improved valve cages, and it decreases as the groove height and cage number increases. The improved valve cage is applicable when a small flow coefficient is required; for a larger flow coefficient, the applicability of the improved valve cage should be validated further in future studies. This work can be helpful when designing cage-type control valves used in high-pressure drop conditions.
Disclosure statement
No potential conflict of interest was reported by the author(s).
References
- Asim, T., Mishra, R., Oliveira, A., & Charlton, M. (2019). Effects of the geometrical features of flow paths on the flow capacity of a control valve trim. Journal of Petroleum Science and Engineering, 172, 124–138. https://doi.org/https://doi.org/10.1016/j.petrol.2018.09.050
- Chern, M. J., Hsu, P. H., Cheng, Y. J., Tseng, P. Y., & Hu, C. M. (2013). Numerical study on cavitation occurrence in globe valve. Journal of Energy Engineering, 139(1), 25–34. https://doi.org/https://doi.org/10.1061/(ASCE)EY.1943-7897.0000084
- Chern, M. J., Wang, C. H., Lu, G. T., Tseng, P. Y., Cheng, Y. J., Lin, C. A., & Hu, C. M. (2015). Design of cages in globe valve. Proceedings of the Institution of Mechanical Engineers, Part C: Journal of Mechanical Engineering Science, 229(3), 476–484. https://doi.org/https://doi.org/10.1177/0954406214535387
- Gao, H., Lin, W., & Tsukiji, T. (2006). Investigation of cavitation near the orifice of hydraulic valves. Proceedings of the Institution of Mechanical Engineers, Part G: Journal of Aerospace Engineering, 220(4), 253–265. https://doi.org/https://doi.org/10.1243/09544100JAERO26
- Han, M., Liu, Y., Wu, D., Zhao, X., & Tan, H. (2017). A numerical investigation in characteristics of flow force under cavitation state inside the water hydraulic poppet valves. International Journal of Heat and Mass Transfer, 111, 1–16. https://doi.org/https://doi.org/10.1016/j.ijheatmasstransfer.2017.03.100
- Jin, Z. J., Gao, Z. X., Qian, J. Y., Wu, Z., & Sunden, B. (2018). A parametric study of hydrodynamic cavitation inside globe valves. ASME J. Fluids Eng, 140(3), 031208. https://doi.org/https://doi.org/10.1115/1.4038090
- Jin, Z. J., Qiu, C., Jiang, C. H., Wu, J. Y., & Qian, J. Y. (2020). Effect of valve core shapes on cavitation flow through a sleeve regulating valve. Journal of Zhejiang University-SCIENCE A, 21(1), 1–14. https://doi.org/https://doi.org/10.1631/jzus.A1900528
- Li, J. Y., Gao, Z. X., Wu, H., & Jin, Z. J. (2020a). Numerical Investigation of methodologies for cavitation suppression inside globe valves. Applied Sciences, 10(16), 5541(1–13). https://doi.org/https://doi.org/10.3390/app10165541.
- Li, S., Li, C., Li, Z., Xu, X., Ye, C., & Zhang, W. (2020b). Design optimization and experimental performance test of dynamic flow balance valve. Eng. Appl. Comput. Fluid Mech, 14(1), 700–712. https://doi.org/https://doi.org/10.1080/19942060.2020.1756914
- Lin, Z., Ma, C., Xu, H., Li, X., Cui, B., & Zhu, Z. (2017). Numerical and experimental studies on hydrodynamic characteristics of sleeve regulating valves. Flow Measurement and Instrumentation, 53, 279–285. https://doi.org/https://doi.org/10.1016/j.flowmeasinst.2016.12.001
- Lisowski, E., & Filo, G. (2017). Analysis of a proportional control valve flow coefficient with the usage of a CFD method. Flow Measurement and Instrumentation, 53, 269–278. https://doi.org/https://doi.org/10.1016/j.flowmeasinst.2016.12.009
- Liu, X., Wu, Z., Li, B., Zhao, J., He, J., Li, W., Zhang, C., & Xie, F. (2020). Influence of inlet pressure on cavitation characteristics in regulating valve. Eng. Appl. Comput. Fluid Mech, 14(1), 299–310. https://doi.org/https://doi.org/10.1080/19942060.2020.1711811
- Mosavi, A., Shamshirband, S., Salwana, E., Chau, K. W., & Tah, J. H. (2019). Prediction of multi-inputs bubble column reactor using a novel hybrid model of computational fluid dynamics and machine learning. Eng. Appl. Comput. Fluid Mech, 13(1), 482–492. https://doi.org/https://doi.org/10.1080/19942060.2019.1613448
- Qian, J. Y., Gao, Z. X., Hou, C. W., & Jin, Z. J. (2019). A comprehensive review of cavitation in valves: Mechanical heart valves and control valves. Bio-Design and Manufacturing, 2(2), 119–136. https://doi.org/https://doi.org/10.1007/s42242-019-00040-z
- Qian, J. Y., Gao, Z. X., Li, W. Q., & Jin, Z. J. (2020a). Cavitation Suppression of bileaflet Mechanical heart valves. Cardiovasc. Eng. Tech, 11(6), 1–12. https://doi.org/https://doi.org/10.1007/s13239-020-00484-w
- Qian, J. Y., Hou, C. W., Mu, J., Gao, Z. X., & Jin, Z. J. (2020b). Valve core shapes analysis on flux through control valves in nuclear power plants. Nuclear Engineering and Technology, 52(10), 2173–2182. https://doi.org/https://doi.org/10.1016/j.net.2020.03.008
- Qian, J. Y., Wu, J. Y., Gao, Z. X., & Jin, Z. J. (2020c). Effects of throttling window on flow rate through feed-water valves. ISA Transactions, 104, 393–405. https://doi.org/https://doi.org/10.1016/j.isatra.2020.05.017
- Qian, J. Y., Wu, J. Y., Gao, Z. X., & Jin, Z. J. (2020d). Pilot pipe and damping orifice arrangements analysis of a Pilot-control globe valve. ASME J. Fluids Eng, 142(10), 101210(1–12). https://doi.org/https://doi.org/10.1115/1.4047533
- Qiu, C., Jiang, C. H., Zhang, H., Wu, J. Y., & Jin, Z. J. (2019). Pressure drop and cavitation analysis on sleeve regulating valve. Processes, 7(11), 829(1–16). https://doi.org/https://doi.org/10.3390/pr7110829.
- Ramezanizadeh, M., Alhuyi Nazari, M., Ahmadi, M. H., & Chau, K. W. (2019). Experimental and numerical analysis of a nanofluidic thermosyphon heat exchanger. Eng. Appl. Comput. Fluid Mech, 13(1), 40–47. https://doi.org/https://doi.org/10.1080/19942060.2018.1518272
- Saha, B. K., Peng, J., & Li, S. (2020). Numerical and experimental investigations of cavitation phenomena inside the Pilot stage of the deflector Jet servo-valve. IEEE Access, 8, 64238–64249. https://doi.org/https://doi.org/10.1109/ACCESS.2020.2984481
- Singh, D., Charlton, M., Asim, T., Mishra, R., Townsend, A., & Blunt, L. (2020). Quantification of additive manufacturing induced variations in the global and local performance characteristics of a complex multi-stage control valve trim. Journal of Petroleum Science and Engineering, 190, 107053(1–13). https://doi.org/https://doi.org/10.1016/j.petrol.2020.107053.
- Sun, X., Kim, H. S., Yang, S. D., Kim, C. K., & Yoon, J. Y. (2017). Numerical investigation of the effect of surface roughness on the flow coefficient of an eccentric butterfly valve. Journal of Mechanical Science and Technology, 31(6), 2839–2848. https://doi.org/https://doi.org/10.1007/s12206-017-0527-0
- Yaghoubi, H., Madani, S. A. H., & Alizadeh, M. (2018). Numerical study on cavitation in a globe control valve with different numbers of anti-cavitation trims. Journal of Central South University, 25(11), 2677–2687. https://doi.org/https://doi.org/10.1007/s11771-018-3945-y
- Yang, Q., Aung, N. Z., & Li, S. (2015). Confirmation on the effectiveness of rectangle-shaped flapper in reducing cavitation in flapper–nozzle pilot valve. Energy Conversion and Management, 98, 184–198. https://doi.org/https://doi.org/10.1016/j.enconman.2015.03.096
- Zwart, P. J., Gerber, A. G., & Belamri, T. (2004). A two-phase flow model for predicting cavitation dynamics. Proceedings of the fifth International conference on multiphase flow, Yokohama, Japan, May 30 to June 3, 2004.