
 ?Mathematical formulae have been encoded as MathML and are displayed in this HTML version using MathJax in order to improve their display. Uncheck the box to turn MathJax off. This feature requires Javascript. Click on a formula to zoom.
Abstract
To improve the poor in-cylinder combustion condition of the small spark ignition Wankel rotary engine (SI-WRE) and improve its efficiency, this paper conducted a comprehensive optimization of its ignition environment. Since there are no known effects of ignition chamber characteristics, including ignition chamber volume () and spark plug channel diameter (
), on the ignition environment, various combinations of
and
were established, simulated, and compared, using Computational Fluid Dynamics (CFD) methods with validated models. As there are small and complex structures in the small SI-WRE, along with the huge simulation load in the case study, special treatments were adopted in mesh division to maintain the fast and accurate simulation. The results showed a wide thermal efficiency range of 8.51–32.13% under various
and
combinations, indicating that the engine performance was deeply limited by the ignition chamber.
and
also had profound influences on short-term (affected by
) and long-term (affected by
) flow losses, fresh intake at spark region, combustion speed, and working stability. Stable working condition was achieved when
cc and
mm, while powerful situations were
cc and
mm, or
cc and
mm.
Nomenclature
| B | = | Cylinder width of the Wankel rotary engine |
| = | The diameter of the spark plug channel | |
| e | = | Eccentricity of the Wankel rotary engine |
| = | The frictional head loss | |
| = | The local head loss | |
| K | = | Shape parameter of the Wankel rotary engine |
| R | = | Generating radius of the Wankel rotary engine |
| = | Displacement of the Wankel rotary engine | |
| = | The volume of the ignition chamber | |
| BDC | = | Bottom dead center |
| CFD | = | computational fluid dynamics |
| CH | = | Methane |
| EC | = | Exhaust port close timing |
| EDC | = | The eddy-dissipation concept |
| EO | = | Exhaust port open timing |
| IC | = | Intake port close timing |
| IMEP | = | Indicated mean effective pressure |
| IO | = | Intake port open timing |
| LI | = | [ Laser ignition |
| RNG | = | The ‘renormalization group’ |
| SI | = | Spark ignition |
| SI-WRE | = | Spark ignition Wankel rotary engine |
| TDC | = | Top dead center |
| THJI | = | Turbulent hot-jet ignition |
| UDF | = | User-Defined Functions |
| WRE | = | Wankel rotary engine |
1. Introduction
Despite the low vibration and noise, high specific power, and broad fuel adaptability, the Wankel rotary engine (WRE) had faded out of the passenger car market due to its inherently poor efficiency and emissions (Meng et al., Citation2021). However, such disadvantages of the WRE have been gradually remedied by applying clean energy such as natural gas (Blank, Citation2007; Fan, Pan, Liu et al., Citation2015). The combination of the small spark ignition WRE (SI-WRE) and natural gas has drawn much attention in recent years due to the increasingly serious environmental problems (Erbil, Citation2011; Hemmati-Sarapardeh et al., Citation2020) and has been applied in many advanced platforms, including micro generators (Hack et al., Citation2016), range extenders (Sakib et al., Citation2017; Zambalov et al., Citation2020), and unmanned aerial vehicles (UAV) (Boretti, Citation2015). Therefore, developing small natural gas SI-WREs has become more and more meaningful.
Compared with the reciprocation piston engine, the main defects of the SI-WRE lie in efficiency and emission, which are mainly caused by its poor combustion. Researchers have been committed to optimizing combustion by various means, including organizing air intake and in-cylinder airflow (Gao et al., Citation2021; Grasso et al., Citation1987), improving fuel quality (Amrouche et al., Citation2014), reducing leakage and heat loss (Li et al., Citation1991; Menon & Cadou, Citation2013), and optimizing ignition (Su et al., Citation2018). More and more studies have shown that the optimizations of the ignition parameters and ignition environment in SI-WRE are of great benefit to the flame kernel formation and early development, thus contributing to the combustion. In terms of optimizations of the ignition parameters, Fujimoto et al. (Citation1987) indicated that multi-point ignition greatly reduces the flame propagation distance and can obviously improve the combustion speed and efficiency compared to single ignition. Lin et al. (Citation2018) showed that there are close correlations between spark plug types and spark energy with combustion stability, while spark plug types have less obvious influences than spark energy. Based on these studies, Shi et al. (Citation2019) compared synchronous and asynchronous ignition timings in a SI-WRE, indicating that an advanced ignition timing of the trailing spark plug is better for engine performance.
In terms of optimizing the ignition environment, Shi et al. (Citation2020) pointed out that reasonable organization of the mixture composition in the spark region can obviously improve the combustion condition and facilitate flame formation. Chen et al. (Citation2021) indicated that choosing a better place for ignition is the most feasible strategy to fundamentally improve the ignition environment of the SI-WRE, which agreed with Otchere et al. (Citation2020). From the aspect of changing ignition positions, Zambalov et al. (Citation2017) conducted an interesting study using a laser ignition (LI) system in an optical WRE to transfer the spark region from the ignition chamber to the combustion chamber. A remarkable increase in combustion speed and all-round flame distribution from the spark region was reported, which was different from the traditional one-way distribution. Furthermore, Taskiran (Citation2020) performed turbulent hot-jet ignition (THJI) in WRE, opening up a new way of linear ignition in the combustion chamber of WRE. Compared with the traditional spark ignition (SI) method, the THJI showed obvious accelerated ignition and combustion. However, despite the great improvements brought by the LI and THJI, they no longer belong to the SI method. Despite these great improvements of the optimized ignition on engine performance, the ignition environment of the SI-WRE is still worse than that of the reciprocating piston engine, which may be greatly related to the ignition chamber.
Compared with the traditional reciprocating piston engine, the ignition condition of the SI-WRE is complex and harsh: the combustible mixture in the combustion chamber is pressed into the semi-closed ignition chamber through the narrow spark plug channel, and ignited in it, and the flame then transmits back to the combustion chamber through that channel again (Thompson et al., Citation2003). Such a process is unfavorable for ignition and suffers many adverse effects brought by the ignition chamber, such as throttling, blow-by, and exhaust gas residue. Moreover, these adverse effects will be aggravated during the miniaturization of the SI-WRE due to the increasing volume proportion of the ignition chamber (in which the spark plug of a fixed size is installed). Given that the ignition chamber of the small SI-WRE is closely related to the ignition environment, thus affecting the ignition and combustion greatly, determining the parameters of the ignition chamber, including ignition chamber volume () and spark plug channel diameter (
), is of great importance and necessity for designing a specific size of small SI-WRE. However, there is no comprehensive and systematic research on the specific ignition chamber structure of the small SI-WRE. There is also no research on the relationship between the specific ignition chamber structure and the ignition environment of the small SI-WRE.
Focusing on the ignition of the small SI-WRE, this paper studied the effects of the specific ignition chamber structure on the ignition environment, thus on the combustion, power, and efficiency of the small SI-WRE, starting with two key parameters of the ignition chamber, and
. Several small SI-WREs with different combinations of
and
were modeled, simulated, and compared. To avoid the interference of the specific shape of the ignition chamber in the research, the geometric similarity was observed in modeling multiple ignition chambers (Han et al., Citation2019; Wu et al., Citation2019). The computational fluid dynamics (CFD) simulations were carried out by Fluent 16.0 software, in which the User-Defined Functions (UDF) were used to generate accurate grid motion during SI-WRE simulation. The ‘renormalization group’ (RNG) k-ε turbulence model and the eddy-dissipation concept (EDC) combustion model, which are widely recognized and used in small SI-WREs, were verified and adopted. In view of the sensitivity of the simulation results to the small structure of the ignition chamber, local mesh refinement, surface and boundary layer refinement, and mesh independent test were employed. From the aspects of power, efficiency, and stability, the suitable pairs of
and
in a 50 cc SI-WRE were found. This paper provides a theoretical basis for the structural design of the ignition chamber and a new approach for improving the efficiency of small SI-WREs. We hope all these efforts could contribute to the energy and power industry in the world.
2. Methodology
2.1. Geometric model and grid realization
A self-developed 50 cc small SI-WRE shown on the left of Figure was used as the simulation basis of this paper. It uses as fuel and a single spark plug for ignition. Its main technical specifications are listed in Table . The structural schematic of the simulated small SI-WRE established by Solidworks is shown on the right of Figure . At the moment shown in Figure , the working chamber 2 is located at the top dead center, which is also the starting location of the calculation in this paper. The ignition chamber with a
of 1.5 cc and a
of 2 mm is located on the short axis, attached to the cylinder surface, and internally equipped with an ‘L’ shaped spark plug. This central arrangement of the ignition chamber is especially suitable for small high-speed rotary engines (Norbye, Citation1971).
Figure 1. Schematic diagram of the simulated engine.
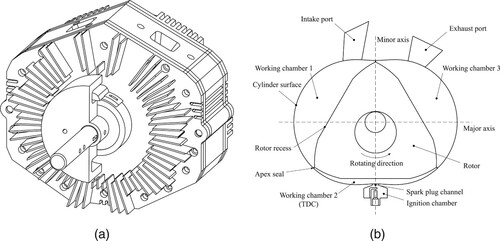
Table 1. Engine technical specifications.
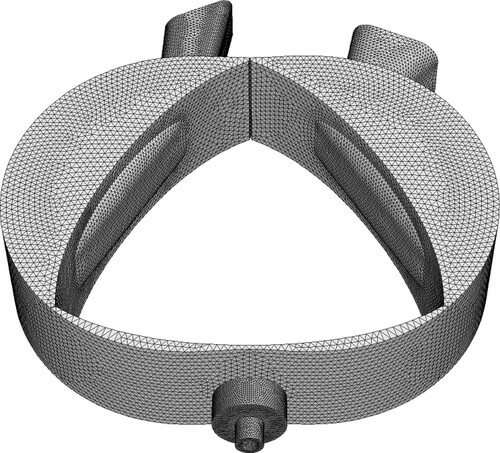
As shown in Figure , the meshing model of the computational domain, including intake and exhaust part, working chamber part, and ignition chamber part, was generated by Hypermesh software. The global grid size was chosen as 1.5 mm after verifying grid size independence (see Section 2.4). Since the high quality of the grid for combustion simulation in small structures was required (Kim & Kim, Citation2019), different degrees of grid refinement according to the complexity and fineness of different structures were carried out in grid division. Special treatments were applied to the intake port, the ignition chamber, the spark plug channel, and the spark plug. In the intake port and the ignition chamber, the surface grid size of 0.5 mm and the volume grid size of 0.5–1 mm were used. For the spark plug channel and the spark plug, a surface grid size of 0.2 mm was used. Besides, two layers of boundary layer refinement with the same size were applied, and the volume grid size in the vicinity was controlled within the range of 0.2–0.5 mm. In addition, the spark region (between the cathode and anode of the spark plug) was locally refined to ensure high enough computational accuracy for early flame formation and propagation.
Dynamic mesh was adopted in Fluent 16.0 to imitate the complex planetary kinematic of the SI-WRE. The rotation and revolution rules of the rotor and the cylinder were defined in a c-program, and imported into the UDF of Fluent. For this complex motion, other than using rotating and deforming mesh systems, two methods of generating dynamic meshes were comprehensively considered: ‘smoothing’ and ‘remeshing’. During grid motion, smoothing method is used for small-scale boundary deformation to remain the unchanged element connections and numbers; remeshing method is used for the boundary moving to subdivide mesh in the region with large mesh distortion. Both methods are based on tetrahedral mesh types. Although structured hexahedral meshes perform much better in steady unidirectional flow than unstructured tetrahedral meshes (Ghalandari et al., Citation2019), the computational accuracy of the two mesh types is almost the same in the simulation of extreme complex flow. Moreover, the tetrahedron type has the advantages of short time consumption and high flexibility in meshing a complex structure such as a SI-WRE. Comprehensively considering the time of mesh division, calculation amount, accuracy of the model, and the requirements of dynamic mesh, the tetrahedral mesh type was used to calculate the complex flow in the SI-WRE.
Figure 2. Meshing model of computational domain.
2.2. Computational model and boundary conditions
Fluent 16.0 was used in this paper to solve conservation equations of mass and momentum using a finite volume approach. The continuity equation can be expressed as:
(1)
(1) then the momentum equation is:
(2)
(2) where p is the static pressure,
is the stress tensor, and
and
are the gravitational body force and surface forces, respectively.
The RNG k-ε turbulence model was chosen for the calculation because of its accuracy and forecasting capacity (Han & Reitz, Citation1995). Using a mathematical technique called ‘renormalization group’ methods, this model is derived from the instantaneous Navier–Stokes equations, and is especially suitable for calculating the flow state in the long and narrow combustion chamber of the small SI-WREs (Fan, Pan, Tang et al., Citation2015). Equations for k and ε are:
(3)
(3)
(4)
(4) where
represents the effective viscosity,
represents the generation of turbulence kinetic energy (TKE) due to the mean velocity gradients,
represents the generation of TKE due to buoyancy,
represents the contribution of the fluctuating dilatation in compressible turbulence to the overall dissipation rate. The quantities
and
are the inverse effective Prandtl numbers for k and ε, respectively.
and
are user-defined source terms.
and
are model constants. The inverse effective Prandtl numbers,
and
, are computed using the following formula derived analytically by the RNG theory:
(5)
(5) where
, in the high-Reynolds number limit
,
.
The combustion model was adopted as the EDC model due to its coupling property with the reaction mechanism (Fan, Pan, Pan et al., Citation2015), improving the calculation accuracy of the combustion process. Nevertheless, the detailed reaction mechanism is bound to seriously slow down the calculation speed. Therefore, a reduced reaction mechanism with 16 components and 41 reaction steps presented by Yang and Pope (Citation1998) was applied in this paper. This reduced reaction mechanism has been widely used in SI-WRE simulation for many years, and its performance has been verified in some research (Ran et al., Citation2015). In particular, Fan, Pan, Pan et al. (Citation2015) proved that the performance of this reduced mechanism, including combustion temperature, pressure, consumption rate and
generation rate, are similar to those of the 325-step GRI-Mech 3.0 mechanism. Differences lay in the length of ignition delay period, which can be easily remedied by modifying the spark timing in Fluent 16.0. Since the in-cylinder pressure and the
consumption rate are the primary concerns of this study with respect to combustion, the reduced mechanism is sufficient.
The setting of boundary conditions was mainly based on experience and test results of our self-developed prototype, as shown in Table . It is worth mentioning that the calculations were simplified as follows:
Both air and fuel were assumed to be ideal compressible gases.
The air and fuel were well mixed when entering the inlet port.
The ignition process was simplified as the energy release at the spark region.
No leakage between the apex seal and the cylinder surface.
The simplifications above may deviate the simulation from the actual situation, but they will not fundamentally change the similarity between the simulation results and the actual situation. Moreover, just comparing the simulation results could tell the differences resulting from various ignition chamber parameters. Therefore, such simplifications should be reasonable and acceptable. On the contrary, this paper did not simplify the three working chambers into one as usual despite their similarities, because the blow-by, which is one of the main research objects of this paper, will occur between two adjacent working chambers when the apex seal sweeps across the spark plug channel. Only if there are adjacent working chambers can they be studied. In addition, the starting position of the calculation is arranged as shown in Figure . In general, the simulation of the WRE needs only 3 cycles to be stable. However, in this study, the engine is bound to be unstable in some cases due to some poor choices of the ignition chamber parameters ( and
). In order to more clearly distinguish between stability and instability, all the cases in this paper have been calculated for 7 cycles.
Table 2. Summary of boundary conditions.
2.3. Theoretical basis and research approach
The gas flow near the ignition chamber is a rapidly varied flow of viscous fluid, which causes frictional loss and local loss around the spark plug channel. The frictional head loss () is defined by the Darcy formula (Equation (Equation6
(6)
(6) )):
(6)
(6) where
is affected by the length (l) and diameter (d) of the spark plug channel, the flow velocity (V ), and the resistance coefficient along the way (λ), among which the flow velocity accounts for the largest proportion.
The local head loss () is defined by Equation (Equation7
(7)
(7) ):
(7)
(7) where
depends on the flow velocity (V ) and the local resistance coefficient (ξ), which includes the effect of the shape of the ignition chamber, the roughness of the wall, and the Reynolds number. Among these factors, shape, especially the mutation of cross-sectional area, plays the most important role (Gao et al., Citation2018). To avoid too many factors other than the
and
causing interference to the research in this paper, similar shapes were guaranteed in modeling the structures of different ignition chambers according to Han et al. (Citation2019) and Wu et al. (Citation2019), both of whom proved that similar geometry will cause similar rapidly varied fluid flow. Rather than getting the simulation results under a certain combination of
and
, the effects of
and
on the ignition environment, thus on engine performance were intended to acquire in this paper. Considering the sensitivity of ignition environment and engine performance to
and
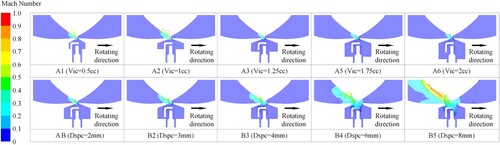
, enough samples are necessary for discovering regularity in case studies and optimizing the comprehensive performance of complex machines according to Abadi et al. (Citation2020) and Wang et al. (Citation2019). Therefore, as many as 10 ignition chambers along with the spark plug channels were designed to reveal their accurate relationships, as shown in Figure . These designs were numbered and illustrated in Table . To compare the influence of
and
on the ignition environment and engine performance respectively, two groups of calculation samples (group A and B) were divided.
Figure 3. Calculation cases of the ignition chamber structure.
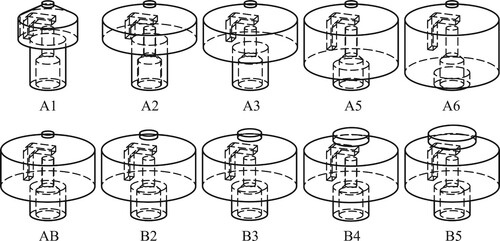
Table 3. Simulation examples arrangement.
2.4. Model validation
To verify the turbulence model, the engine in literature (Fan, Pan, Tang et al., Citation2015) was modeled and simulated using the software and calculation models selected in this paper. The engine geometry is shown on the left of Figure , and the engine model established according to the data provided in the literature is shown on the right. The obtained flow field distribution is in good agreement with the test results in the literature, as shown in Figure . However, the SI-WRE is a really complex system, and purely verifying the turbulence model was not enough to prove the reliability of the computational model selected in this paper. Therefore, a small SI-WRE test bench was built to test the simulated engine described in Figure and Table . The test bench included an electric dynamometer, the cylinder pressure test system, the cylinder temperature test system, as well as the 50 cc SI-WRE assembly. The core components of the test bench, such as the speed and torque sensor, cylinder pressure sensor, cylinder temperature sensors, and Hall sensor are presented in Figure . Technical parameters of some of those sensors are given in Table .
Figure 4. The same engine geometry built by Fan et al. (left) and this paper (right).
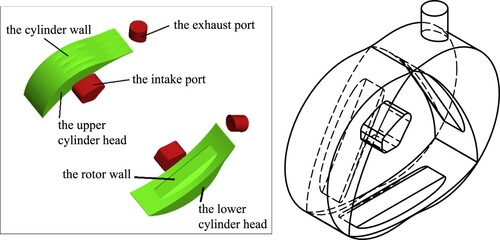
Figure 5. Comparison of experimental result from Fan, Pan, Liu et al. (Citation2015) and simulation result in this paper.
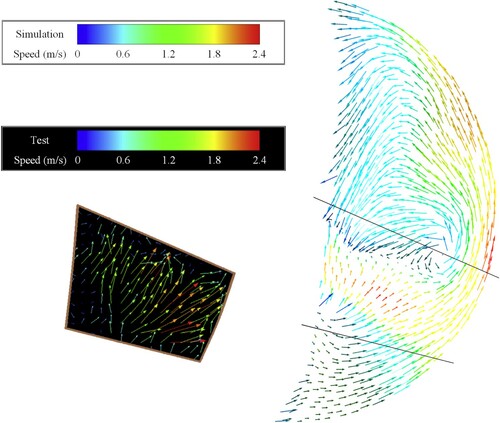
Figure 6. Test bench for 50 cc SI-WRE.
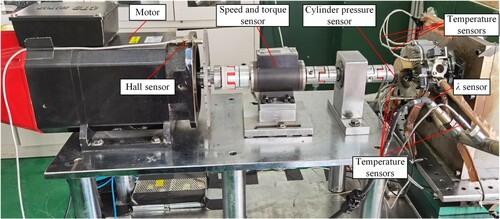
Table 4. Technical parameters of main sensors.
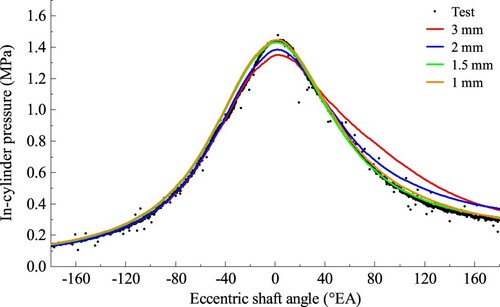
The experiment was conducted at room temperature and atmospheric pressure. The engine speed was controlled at 3000 rpm and ran at full load. The cylinder pressure of the 50 cc SI-WRE was collected and compared with four sets of simulation data under the same boundary conditions as the experiment, but with different grid sizes, as shown in Figure . The cylinder pressure curve obtained from the experiment could not track the complete cycle of a single cylinder due to the fixed installation position of the in-cylinder pressure sensor. When the apex seal at the top of the triangular rotor swept over the cylinder pressure sensor, the cylinder pressure measured by the sensor switched from the previous cylinder to the next cylinder. Four sets of simulation result curves demonstrated similar trends of climbing and dropping to the test curve. Among them, the simulation results with the grid size of 1 mm and 1.5 mm are the closest, and their results are the most consistent with the experiments, indicating that the grid size of 1.5 mm has sufficient calculation accuracy for relatively fast calculation. Meanwhile, according to Figure , it is proved that the selected models, calculation tools, assumptions, simplifications, and special treatments are reasonable.
Figure 7. Comparison of simulated and tested in-cylinder pressure of SI-WRE.
3. Results and discussions
The ignition chamber mainly affects ignition environment and engine performance in two aspects: and
. The effect of
is mainly reflected in ignition and combustion, while the effect of
is mainly reflected in flow. Nevertheless, they are not completely independent and have a combined influence on the engine performance.
3.1. Combined influence of ignition chamber on flow
Blow-by occurs when the apex seal sweeps across the spark plug channel, as shown in Figure . The Mach number reflects the flow velocity in Figure , whose colors distinguish the value, and arrows indicate the direction. The marked rotating direction indicates the counterclockwise working direction of the engine, with the trailing working chamber in compression stroke and the leading working chamber in power stroke. As seen from Figure , it can be easily found that the blow-by of all cases had the same direction: from the leading working chamber to the trailing working chamber. The variation of had little effect on the blow-by phenomenon with the constant
(case group A). In contrast, the blow-by phenomenon was sensitive to
with the constant
(case group B), and the larger the
, the more obvious the blow-by phenomenon. With the increase of
, the flow velocity became higher and higher. The Mach number in case B5 exceeded 1, which means the value of local flow velocity exceeded the local sound speed. In addition, the area influenced by the blow-by gradually went deep into the ignition chamber with the increase of
. In cases B4 and B5, the blow-by zone reached the head of the spark plug.
Figure 8. Velocity distribution during blow-by.
In the small SI-WRE, the in-cylinder maximum flow velocity is usually around 40 m/s to 60 m/s (Taskiran et al., Citation2019), far below the local sound speed. However, the flow speed of blow-by closed to it. Such high speed definitely resulted in severe throttling losses, including frictional head loss and local head loss (Equation (Equation6(6)
(6) ) and (Equation7
(7)
(7) )). Due to the different gas conditions in the two adjacent working chambers and the ignition chamber, it can be referred that the gas flow during blow-by changed the composition, energy, and mass within all three chambers, which may lead to unstable working conditions of the engine.
Despite the instantaneous impact of blow-by on flow, the ignition chamber had a continuous influence on the flow, as shown in Figures and . The pressure curves of the ignition chamber and the combustion chamber were recorded and presented together when the second working chamber connected with the ignition chamber of each case. When remained constant (Figure ), the separation of two pressure curves presented three remarkable characteristics: the pressure difference at the first blow-by decreases with the increase of
; a rocketing pressure appeared at spark timing with small
and disappeared until
exceeded 1.25 cc; the pressure change of the ignition chamber lags behind that of the combustion chamber, and the bigger the
, the longer the lag. The sub-figures in Figure show the pressure variation of the combustion chamber and the ignition chamber separately. After ignition, the pressure variation inside the combustion chamber decreased as the increased
, and similar tendency was fond in the ignition chamber. When
remained constant (Figure ), the pressure difference at the first blow-by remained constant at first, and sharply increased afterwards as
largen; the rocketing pressure disappeared; the lag mentioned above alleviated and even disappeared (
mm) with the increase of
. The sub-figures in Figure show the pressure variation of the combustion chamber and the ignition chamber separately. After ignition, the pressure variation inside the combustion chamber increased as the increased
when
mm, otherwise, similar pressure curves were fond in cases AB, B2, and B3 due to the limitation of the narrow spark plug channel. As for the pressure inside the ignition chamber, wider
resulted in a higher pressure.
Figure 9. Pressure comparison in combustion chamber and ignition chamber of case group A.
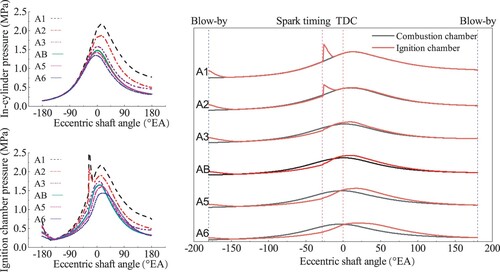
Figure 10. Pressure comparison in combustion chamber and ignition chamber of case group B.
Although blow-by was resulted from the spark plug channel, the combined influence of and
was observed during the first blow-by. The ignition chambers with the same
had exactly the same blow-by timing but they varied in pressure. Given that the pressure in the ignition chamber at the blow-by timing was inherited from the previous cycle, it can be explained that
influenced the in-cylinder pressure of combustion. Similarly,
also had something do with the in-cylinder pressure of combustion. Rocketing pressure is a manifestation of intense combustion in a specific space, and the similar phenomenon exists in other pre-chamber engines (Rajasegar et al., Citation2021). In this study, it appeared only at small
(
cc) despite the similar ignition, which may be because the ignition chamber had neither enough space to absorb the burst pressure nor enough outlet to release. In terms of the pressure lag between the ignition chamber and the combustion chamber, its root cause should be the small
(see Figure ).
also had a huge and negative effect on such lag when
was small enough (Figure ). As long as there is a pressure difference, there will be flow. As long as there is flow, there will be losses. As far as flow loss is concerned, small
produced huge flow loss at spark timing; large
produced continuous flow loss during the whole process of compression and expansion; large
produced instantaneous but severe flow loss at blow-by.
3.2. Combined influence of ignition chamber on ignition and combustion
distribution and flow state in the ignition chamber at spark timing is shown in Figure , taking the third working cycle as an example. The arrows refer to the flow directions, and the lengths of the arrows represent the flow rates. The concentration of
was relatively high where the fresh intake passed by, and extremely low (close to zero) in some regions. High-speed flow at the entrance resulted in a high concentration of
at the inlet of the ignition chamber and adjacent areas. For regions with extremely low
concentration, either the flow rate there is low with no fresh charge passed by (left blue regions in A1, A2, and B5), or there is a swirl of residual exhaust gas preventing fresh charge from entering (right regions in A1 and A2). For regions near the anode, the
concentration decreased to different degrees due to the shelter of the L-shaped cathode, which was related to various flow conditions of different ignition chambers. Particular attention has been paid to the spark region (the region located between the L-shaped cathode and the anode) because it is the starting point of engine combustion. It was found that a relatively high
concentration at the spark region could be formed only if there was a high concentration of airflow at the bottom of the ignition chamber, because most gas flowing through the spark region came from the bottom. Overall, the concentration there was above the flammable limit in all cases (Wang et al., Citation2021). However, the obvious gradients at the spark region of cases A1, A2, and B5 may cause unstable and dangerous states of the engine, because gradients here mean that there may be different concentration distributions at the spark region of different cycles. In order to explore the cyclic difference of
concentration in the ignition chamber, the
mass fractions in the 4rd-7th cycles are given in Figures and .
Figure 11. concentration distribution at spark timing.
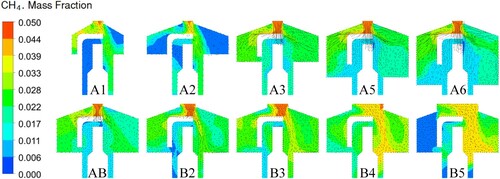
Figure 12. concentration in ignition chambers of case group A at spark timing.
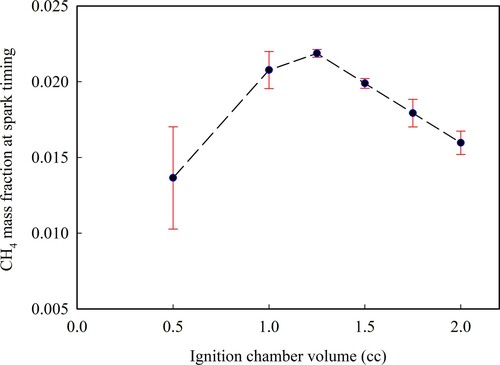
Figure 13. concentration in ignition chambers of case group B at spark timing.
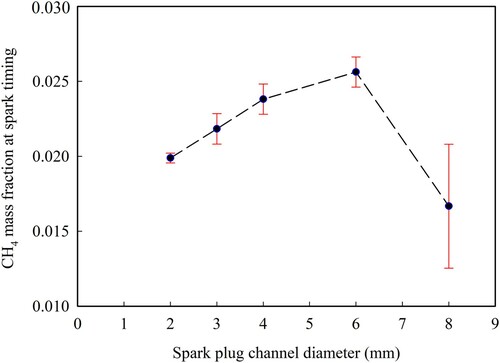
The polylines that connect the mean values were used to express tendency in Figures and . Error bars stand for the cyclic differences in the fourth to seventh cycles. The huge cyclic differences are found in cases A1, A2, and B5. On the contrary, for some cases, such as A3 and A4, the results of multiple cycles were close. mass fraction firstly increased and then decreased with the increase of
and
, and the cyclic stable peak values of
mass fraction appeared when
cc and
mm. These two conditions were the best for the ignition environment of the engine in terms of combustible gas concentration. However, other unstable
concentrations would cause unstable operation of the engine.
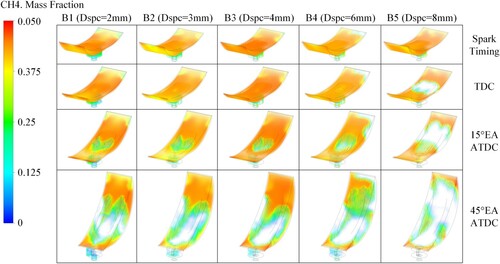
In order to study the combustion without the influence of the engine instability, cycles close to the mean value points were chose to show the flame development process, as shown in Figures and . The mass fraction of was selected to illustrate the flame position at several points of time, involving the spark timing, the TDC, 15
EA ATDC, and 45
EA ATDC. In case group A (Figure ), the smallest
possessed the fastest combustion. The combustion speed and completeness decreased with the increase of
. When
cc, the combustion speed was reduced and stabilized to a relatively low value. In case group B (Figure ), instead, the biggest
possessed the fastest combustion. The combustion speed and completeness increased with the increase of
. When
mm, the combustion speed reduced and stabilized to a relatively low value. The three cases with the fastest combustion speed were B5, A1 and A2 in turn, which indicated that small
and large
contributed to the fast combustion. Hua et al. (Citation2021) have done a similar research on THJI engine with different pre-chamber characteristics, and similar results have been obtained with regard to the ‘channel diameter’. In terms of the ‘chamber volume’, their results showed the superior performance with the smallest chamber volume, without suffering the instability. This difference is mainly because in this paper, the combustible gas in the ignition chamber was pressed in, while THJI injected the combustible gas in the pre-chamber, so there was no shortage of equivalence ratio.
Figure 14. Variation of flame position with .
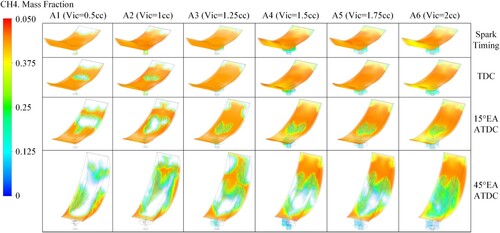
Figure 15. Variation of flame position with .
3.3. Combined influence of ignition chamber on engine performance
In this section, in order to explore the combined influence of and
on the calculated engine, its performance was evaluated by the indicator diagram (P–V diagram) and common performance indicators, including peak pressure in a single cycle (
), indicated mean effective pressure (IMEP,
), power per liter (
), and indicated thermal efficiency (
). They are defined by the following formulas:
(8)
(8)
(9)
(9)
(10)
(10) where
represents the cylinder cyclic indicate work in J,
represents the cylinder displacement in
,
represents the indicated power in kW,
is the mechanical efficiency, i represents the number of rotors in WRE, Q represents heat released per cycle of fuel in J,
represents fuel consumption per hour in kg/h, and
is the low calorific value of fuel in kJ/kg.
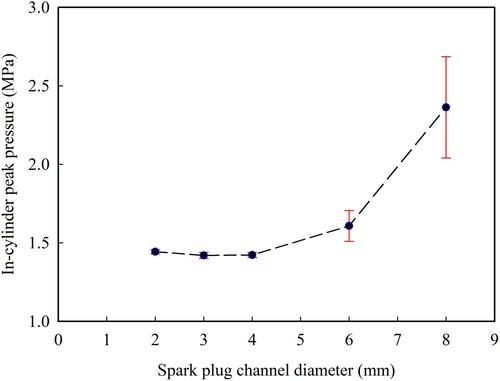
Figures and showed and predicted the change rule and trend of with
and
, respectively. The polylines that connect the mean values were used to express tendency, and error bars stand for the cyclic differences. On the whole,
increased with the decrease of
. When
approaches 0,
approaches the biggest value, around 2.7 MPa. With the increase of
,
increased slowly at first (
mm) and then increased sharply (
mm). Cyclic difference enlarged with
decreasing and
increasing. Stable working range for
was 1.5 –2 cc and for
was 2–4 mm.
Figure 16. Distribution of peak pressure in case group A.
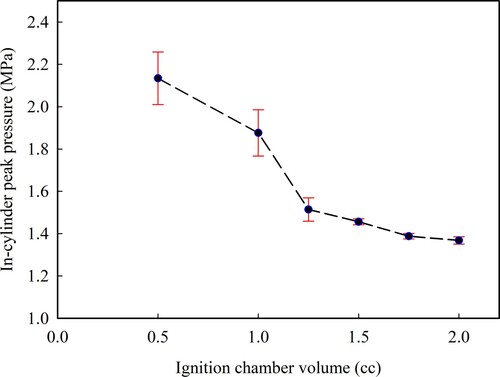
Figure 17. Distribution of peak pressure in case group B.
Due to the large cyclic difference, calculation results of cases close to the trend line in the diagram were listed in the P–V diagram, as shown in Figures and . It can be seen from case Group A that with the decrease of
, the area enclosed by the P–V curves enlarged, which means increased output work. When
increased to 1.5–2 cc, the change of the P–V diagram was not obvious, showing a sharp head with little output work. The compression curves of all the cases in Figure did not coincide, and the curves were separated till the later compression (
cc). The larger the
, the lower the pressure at the end of compression. It can be concluded that the increase of
, on the one hand, reduced the rise of cylinder pressure at the initial stage of combustion, which greatly reduced the engine's work capacity; on the other hand, it reduced the compression ratio, which led to relatively low power and thermal efficiency.
Figure 18. Indicator diagrams of case group A.
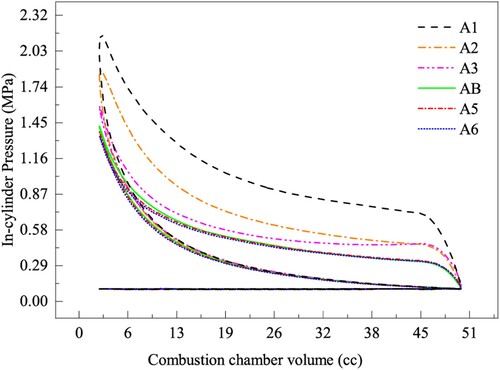
Figure 19. Indicator diagrams of case group B.
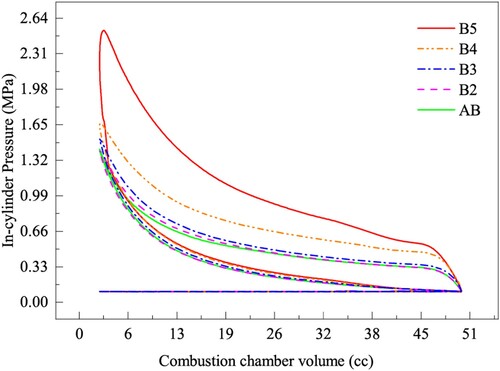
In terms of case group B, the area of P–V curves in Figure increased with the rising . The smallest
(case AB) resulted in the least output work, and the largest
(case B5) resulted in the greatest output work. Seen from the flame contours (Figure ), the flame inside the ignition chamber of case AB spread into the combustion chamber successfully, but with a long time consumed. Given the fact that the only difference between case B1 and case B5 is the
, it can be concluded that the flame inside the ignition chamber of case B1 was blocked by the narrow spark plug channel soon after ignition, and burned preferentially in the ignition chamber, so that it cannot diffuse into the combustion chamber in time, and missed the best timing for heating the combustion chamber, resulting in low output work.
In Figure , the compression curves separated at the initial stage of compression ( 38 cc). The larger the
, the higher the compression pressure. Curves AB, B2, and B3 were similar in shape and insensitive to the change of
. Meanwhile, the area increased obviously when
mm. The expansion curves fluctuated a little where
range between 38 cc and 45 cc. Unlike case group A, the separation of compression curves started from the early stage of the compression stroke in case group B when the blow-by occurred. High-pressure gas from the previous cycle flowed into the current cycle, causing pressure rise and negative compression work increase. For example, case B5 suffered approximately 13.58% more compression work than case AB. Again at the same position in the expansion curve, the current cycle leaked gas to the next cycle, resulting in the fluctuation.
Table summarized the indicators (,
, and η), which evaluated the engine performance. All the selected indicators excluded the engine scale to judge the engine performance. By comparison, among all the cases, only A1 and B5 can reach the normal performance level of rotary engines (Sierens et al., Citation1983). The others were very low in power and efficiency. As mentioned earlier, the small SI-WRE studied in this paper was independently developed by us, still immature with many unsolved problems. Although the simulation results show that the engine performance was generally low, we got clear goals of the ignition chamber design through the current work.
Table 5. Summary of the simulated engine performance.
For engine working stability seek, a match of middle-sized and
may be the best choice. In this paper, it was
cc and
mm. Despite the severe loss occurred around spark timing, the stability of such ignition chamber makes it more valuable in other ignition forms such as the turbulent hot-jet ignition (Taskiran, Citation2020). For power and efficiency seek, the minimum
or the maximum
were optimal. However, under such conditions, the operations of the engine were very unstable due to the difference in the fresh intake composition distribution inside the ignition chamber, which may be solved by many means, including adjusting the position of the spark region, changing the type of spark plug, and increasing spark energy. In fact, these two parameters have structural limitations, and it is impossible to reach the above limits in the presence of the ignition chamber. Coincidentally, the laser ignition method with direct ignition in the combustion chamber abandoned the ignition chamber (
), which was proved to be a great improvement on engine performance (Zambalov et al., Citation2017). Indirectly, it shows that the trends obtained in this study have high credibility.
4. Conclusions
This paper studied the effects of the main parameters of the ignition chamber ( and
) on the ignition environment and the engine performance from the aspects of flow, ignition, combustion, and performance indicators. Following conclusions were obtained:
As
increases, the throttling loss decreases, while the blow-by increases. Despite the small effects of the
The output work is strictly limited by the small
In this study, the combination of
Although this paper established relationships between the ignition chamber parameters and the engine performance in a small SI-WRE, the number of cases is still too small to form a ‘map’ for finding the most suitable
Disclosure statement
No potential conflict of interest was reported by the authors.
Additional information
Funding
References
- Abadi A. M. E., Sadi M., Farzaneh-Gord M., Ahmadi M. H., Kumar R., & Chau K. W. (2020). A numerical and experimental study on the energy efficiency of a regenerative heat and mass exchanger utilizing the counter-flow maisotsenko cycle. Engineering Applications of Computational Fluid Mechanics, 14(1), 1–12. https://doi.org/https://doi.org/10.1080/19942060.2019.1617193
- Amrouche F., Erickson P., Park J., & Varnhagen S. (2014). An experimental investigation of hydrogen-enriched gasoline in a Wankel rotary engine. International Journal of Hydrogen Energy, 39(16), 8525–8534. https://doi.org/https://doi.org/10.1016/j.ijhydene.2014.03.172
- Blank D. A. (2007, July). Methane/CNG combustion in a DI radical-ignition rotary engine with low-heat rejection. In JSAE/SAE International Fuels and Lubricants Meeting. SAE International.
- Boretti A. (2015). CAD/CFD/CAE modelling of wankel engines for UAV. In Sae 2015 Aerotech Congress and Exhibition. SAE International.
- Chen W., Pan J., Yang W., Liu Y., Fan B., Lu Y., & Otchere P. (2021). Stratified combustion characteristics analysis and assisted-ignition strategy optimization in a natural gas blended diesel Wankel engine. Fuel, 292(41), 120192. https://doi.org/https://doi.org/10.1016/j.fuel.2021.120192
- Erbil A. (2011). Social acceptance of the clean energy concept: Exploring the clean energy understanding of Istanbul residents. Renewable and Sustainable Energy Reviews, 15(9), 4498–4506. https://doi.org/https://doi.org/10.1016/j.rser.2011.07.101
- Fan B., Pan J., Liu Y., & Zhu Y. (2015). Effects of ignition parameters on combustion process of a rotary engine fueled with natural gas. Energy Conversion and Management, 103(2), 218–234. https://doi.org/https://doi.org/10.1016/j.enconman.2015.06.055
- Fan B., Pan J., Pan Z., Tang A., Zhu Y., & Xue H. (2015). Effects of pocket shape and ignition slot locations on the combustion processes of a rotary engine fueled with natural gas. Applied Thermal Engineering, 89(3), 11–27. https://doi.org/https://doi.org/10.1016/j.applthermaleng.2015.05.078
- Fan B., Pan J., Tang A., Pan Z., Zhu Y., & Xue H. (2015). Experimental and numerical investigation of the fluid flow in a side-ported rotary engine. Energy Conversion and Management, 95(1), 385–397. https://doi.org/https://doi.org/10.1016/j.enconman.2015.02.047
- Fujimoto Y., Tatsutomi Y., Ozeki H., & Tadokoro A. (1987). Present and prospective technologies of rotary engine. In Sae International Congress and Exposition. SAE International.
- Gao J., Ma C., Tian G., Xing S., & Jenner P. (2021). Numerical investigations of an opposed rotary piston expander for the purpose of the applications to a small-scale Rankine cycle. Applied Thermal Engineering, 182, 116157. https://doi.org/https://doi.org/10.1016/j.applthermaleng.2020.116157
- Gao X., Zhang H., Liu J., Sun B., & Tian Y. (2018). Numerical investigation of flow in a vertical pipe inlet/outlet with a horizontal anti-vortex plate: effect of diversion orifices height and divergence angle. Engineering Applications of Computational Fluid Mechanics, 12(1), 182–194. https://doi.org/https://doi.org/10.1080/19942060.2017.1387608
- Ghalandari M., Koohshahi E. M., Mohamadian F., Shamshirband S., & Chau K. W. (2019). Numerical simulation of nanofluid flow inside a root canal. Engineering Applications of Computational Fluid Mechanics, 13(1), 254–264. https://doi.org/https://doi.org/10.1080/19942060.2019.1578696
- Grasso F., Wey M. J., Bracco F. V., & Abraham J. (1987). Three-dimensional computations of flows in a stratified-charge rotary engine. In Sae International Congress and Exposition. SAE International.
- Hack R. L., Venaas M. R., McDonell V. G., & Kaneko T. M. (2016). Development of rotary engine based Micro-DG/CHP system. In Energy sustainability (Vol. 50220, p. V001T03A001). ASME.
- Han Y., Jia F., Meng X., Cao B., Zeng Y., & Xiao Y. (2019). Numerical analysis of similarities of particle flow behavior in stirred chambers. Powder Technology, 344(11), 286–301. https://doi.org/https://doi.org/10.1016/j.powtec.2018.12.049
- Han Z., & Reitz R. (1995). Turbulence modeling of internal combustion engines using RNG κ-ε models Turbulence modeling of internal combustion engines using RNG κ-ε models. Combustion Science and Technology, 106(4–6), 267–295. https://doi.org/https://doi.org/10.1080/00102209508907782
- Hemmati-Sarapardeh A., Hajirezaie S., Soltanian M. R., Mosavi A., Nabipour N., Shamshirband S., & Chau K. W. (2020). Modeling natural gas compressibility factor using a hybrid group method of data handling. Engineering Applications of Computational Fluid Mechanics, 14(1), 27–37. https://doi.org/https://doi.org/10.1080/19942060.2019.1679668
- Hua J., Zhou L., Gao Q., Feng Z., & Wei H. (2021). Influence of pre-chamber structure and injection parameters on engine performance and combustion characteristics in a turbulent jet ignition (TJI) engine. Fuel, 283(2), 119236. https://doi.org/https://doi.org/10.1016/j.fuel.2020.119236
- Kim D., & Kim J. (2019). Numerical method to simulate detonative combustion of hydrogen-air mixture in a containment. Engineering Applications of Computational Fluid Mechanics, 13(1), 938–953. https://doi.org/https://doi.org/10.1080/19942060.2019.1660219
- Li Z., Shih T. I. P., Schock H. J., & Willis E. A. (1991). A numerical study on the effects of apex seal leakage on wankel engine flow fields. In International Congress and Exposition. SAE International.
- Lin C., Wei H., Zhang R., Pan J., Zhou L., & Feng D. (2018). Effects of spark plug type and ignition energy on combustion performance in an optical SI engine fueled with methane. Applied Thermal Engineering, 148, 188–195. https://doi.org/https://doi.org/10.1016/j.applthermaleng.2018.11.052
- Meng H., Ji C., Wang S., Wang D., & Yang J. (2021). Optimizing the idle performance of an n-butanol fueled Wankel rotary engine by hydrogen addition. Fuel, 288(3), 119614. https://doi.org/https://doi.org/10.1016/j.fuel.2020.119614
- Menon S., & Cadou C. (2013). Scaling of miniature piston engine performance part 2: energy losses. Journal of Propulsion and Power, 29(4), 788–799. https://doi.org/https://doi.org/10.2514/1.B34639
- Norbye J. P. (1971). The Wankel engine: design, development, applications. Pa.Chilton.
- Otchere P., Pan J., Fan B., Chen W., Yao L., & Jianxing L. (2020). Numerical investigation of the effect of advance ignition timing on combustion process in direct injection rotary engine fueled with biodiesel. Environmental Progress & Sustainable Energy, 39(3), e13368. https://doi.org/https://doi.org/10.1002/ep.v39.3
- Rajasegar R., Niki Y., Garca-Oliver J. M., Li Z., & Musculus M. P. B. (2021). Fundamental insights on ignition and combustion of natural gas in an active fueled pre-chamber spark-ignition system. Combustion and Flame, 232, 111561. https://doi.org/https://doi.org/10.1016/j.combustflame.2021.111561
- Ran J., Li L., Du X., Wang R., Pan W., & Tang W. (2015). Numerical investigations on characteristics of methane catalytic combustion in micro-channels with a concave or convex wall cavity. Energy Conversion and Management, 97, 188–195. https://doi.org/https://doi.org/10.1016/j.enconman.2015.03.058
- Sakib N., Hossain J., Hossain E., & Bayindir R. (2017). Modelling and simulation of natural gas generator and EV charging station: a step to microgrid technology. International Journal of Renewable Energy Research, 7(1), 399–410. https://www.ijrer.org/ijrer/index.php/ijrer/article/view/5619/pdf
- Shi C., Ji C., Wang S., Yang J., Li X., & Ge Y. (2019). Numerical simulation on combustion process of a hydrogen direct-injection stratified gasoline Wankel engine by synchronous and asynchronous ignition modes. Energy Conversion and Management, 183(3), 14–25. https://doi.org/https://doi.org/10.1016/j.enconman.2018.12.081
- Shi C., Ji C., Wang S., Yang J., Ma Z., & Xu P. (2020). Assessment of spark-energy allocation and ignition environment on lean combustion in a twin-plug Wankel engine. Energy Conversion and Management, 209, 112597. https://doi.org/https://doi.org/10.1016/j.enconman.2020.112597
- Sierens R., Baert R., Winterbone D. E., & Baruah P. C. (1983, February). A comprehensive study of wankel engine performance. In Sae International Congress and Exposition. SAE International.
- Su T., Ji C., Wang S., Shi L., & Cong X. (2018). Effect of ignition timing on performance of a hydrogen-enriched n-butanol rotary engine at lean condition. Energy Conversion and Management, 161, 27–34. https://doi.org/https://doi.org/10.1016/j.enconman.2018.01.072
- Taskiran O. O. (2020). Improving burning speed by using hydrogen enrichment and turbulent jet ignition system in a rotary engine. International Journal of Hydrogen Energy, 46, 29649–29662. https://doi.org/https://doi.org/10.1016/j.ijhydene.2020.11.142
- Taskiran O. O., Calik A. T., & Akin Kutlar O. (2019). Comparison of flow field and combustion in single and double side ported rotary engine. Fuel, 254(17), 115651. https://doi.org/https://doi.org/10.1016/j.fuel.2019.115651
- Thompson G. J., Wowczuk Z. S., & Smith J. E. (2003). Rotary engines – a concept review. In Sae Powertrain and Fluid Systems Conference and Exhibition. SAE International.
- Wang T., Liang H., Luo Z., Su B., Liu L., Su Y., Wang X., Cheng F., & Deng J. (2021). Near flammability limits behavior of methane-air mixtures with influence of flammable gases and nitrogen: An experimental and numerical research. Fuel, 294(8), 120550. https://doi.org/https://doi.org/10.1016/j.fuel.2021.120550
- Wang Y., Zhang J., Jiang Z., Zhou C., & Liu W. (2019). Investigation on thermodynamic state and valve dynamics of reciprocating compressors with capacity regulation system and parameter optimization. Engineering Applications of Computational Fluid Mechanics, 13(1), 923–937. https://doi.org/https://doi.org/10.1080/19942060.2019.1656674
- Wu H., Xu Y., Wang J., Zhang T., & Wang H. (2019). Study on the similarity of wet gas pressure drop in long-throat Venturi. Flow Measurement and Instrumentation, 68, 101580. https://doi.org/https://doi.org/10.1016/j.flowmeasinst.2019.101580
- Yang B., & Pope S. B. (1998). An investigation of the accuracy of manifold methods and splitting schemes in the computational implementation of combustion chemistry. Combustion and Flame, 112(1), 16–32. https://doi.org/https://doi.org/10.1016/S0010-2180(97)81754-3
- Zambalov S. D., Yakovlev I. A., & Maznoy A. S. (2020). Effect of multiple fuel injection strategies on mixture formation and combustion in a hydrogen-fueled rotary range extender for battery electric vehicles. Energy Conversion and Management, 220, 113097. https://doi.org/https://doi.org/10.1016/j.enconman.2020.113097
- Zambalov S. D., Yakovlev I. A., & Skripnyak V. A. (2017). Numerical simulation of hydrogen combustion process in rotary engine with laser ignition system. International Journal of Hydrogen Energy, 42(27), 17251–17259. https://doi.org/https://doi.org/10.1016/j.ijhydene.2017.05.142