
 ?Mathematical formulae have been encoded as MathML and are displayed in this HTML version using MathJax in order to improve their display. Uncheck the box to turn MathJax off. This feature requires Javascript. Click on a formula to zoom.
ABSTRACT
A numerical study was carried out to investigate the thermal and flow fields of a two-dimensional vented cavity subjected to forced convection turbulent flow. The cavity with three distinct configurations of inlet and outlet ports having three different cases of top surfaces, i.e. flat, semi-elliptical and semi-circular was studied numerically for a range of Reynolds numbers. The objective of the study is to investigate the effect of the top curved wall surface on heat transfer in different configurations of inlet and outlet ports. The various results were presented for streamlines and thermal fields. The variations in the pressure-drop coefficient, local Nusselt number and average Nusselt number were also evaluated. The results show the significant dependence of heat exchange and pressure drop on Reynolds number, location of ports, and the height of the top curved wall surface. The rate of heat transfer was enhanced by increasing the height of the curved surface, but relatively high-pressure drop was observed in top curved surface cavity for the given Reynolds number. On the contrary, the semi-elliptical top surface cavity with inlet and outlet ports positioned on the same axis, displayed an improved performance in terms of maximum average Nusselt number and minimum pressure drop.
1. Introduction
Many researchers have turned their attention to the convective heat transfer process in complex cavities such as trapezoidal, semi-circular, and triangular in recent years. These cavities are being used in various engineering applications such as heat exchangers, electronic cooling devices, oil extraction, food processing, etc. Ababaei et al. (Citation2018) provided the numerical analysis of a right-angled trapezoidal cavity exposed to double-diffusive mixed convection with a partially heated bottom for entropy generation. Dogonchi et al. (Citation2019) performed a numerical investigation on the natural convection of Cu-water nanofluid in a triangular cavity with a semi-circular bottom wall subjected to a constant transverse magnetic field. Hadavand et al. (Citation2019) employed the finite element method to investigate the cooling performance of a semi-circular lid-driven cavity in a silicon chip. Gangawane and Oztop (Citation2020) numerically described the heat transfer, and flow characteristics in a semi-circular cavity subjugated to combined convection with its curved surface maintained at constant heat flux. Ma et al. (Citation2021) performed a numerical study on the heat transfer attributes of a twin-web turbine disk cavity system. They employed the RNG k-ε turbulence model after comparing numerical results obtained from various turbulence models with the experimental data.
However, these cavities have some limitations as they exhibit flow separation and reattachment when subjected to turbulent flow due to high flow velocity and complex physical geometry. However, the square cavity has acquired a considerable attention from many researchers for the analysis of laminar and turbulent flow because of its simple physical geometry (Banaeizadeh et al., Citation2013; Ganesh et al., Citation2020; Liu et al., Citation2017; Miroshnichenko & Sheremet, Citation2018a; Omranian et al., Citation2014; Ryu et al., Citation2007; Zamora, Citation2018a; Zamora & Kaiser, Citation2016).
Singh and Sharif (Citation2003) examined six dissimilar arrangements of inlet and outlet ports of a two-dimensional rectangular cavity with differentially heated sidewalls for maximum cooling effectiveness. A computational study on forced convection laminar flow inside a square cavity with different arrangements of entry and exit ports was conducted by Saeidi and Khodadadi (Citation2006). They concluded that the heat transfer rate and pressure-drop coefficient significantly depended on the location of the outlet port and Reynolds number. They found the maximum heat transfer in a cavity with an exit port located at the lowest position of the right wall. Chamkha et al. (Citation2011) conducted a study of the mixed convection heat transfer from a square cylinder located centrally inside the square cavity. They examined three different configurations of outlet ports to study the effect on heat transfer rate. Sourtiji et al. (Citation2011) employed the standard k-ε model to determine the ideal position of the exit port for maximum heat exchange, which was done by computing the pressure drop and average Nusselt number inside the square cavity subjected to force convection turbulent flow. It was concluded that a cavity with an exit port positioned at the bottom wall exhibits the maximum heat transfer. Huang et al. (Citation2019) inspected a rectangular cavity experimentally and numerically for turbulent mixed convection flow and temperature field. They opted for large-eddy simulations for the operationalization of numerical investigation. The turbulence quantities and mean flow were determined and validated with experimental results. Further, they concluded that the mean flow and turbulent quantities intensify significantly with buoyancy. Zamora (Citation2018b) employed the k-ω turbulence model in a vented square cavity to study the oscillating behavior of the flow for a range of Rayleigh numbers. The cavity walls were adiabatic, and the air occupied was heated by a square immersed body with uniform surface temperature. The study showed unstable flow patterns and non-oscillating behavior of the flow for high values of the Rayleigh number. Olazo-Gómez et al. (Citation2020) provided a numerical analysis of laminar and turbulent flow combined with solar radiation in a square cavity composed of horizontal adiabatic walls, left vertical isothermal wall, and right vertical glazed wall. They found that the convective heat transfer significantly depended on the aspect ratio (i.e. the height of the glazed wall), and the radiative heat transfer decreased for high values of solar irradiance.
It is evident from the works of literature that the influence of curved top surfaces on the flow and thermal fields is unexplored, especially in a vented cavity exposed to turbulent flow (Izadi et al., Citation2019; Miroshnichenko & Sheremet, Citation2018b). Such type of vented cavity might be used in power generation and aerospace industries. The curved surfaces, normally used in solar collector receivers, heat exchangers and electronic devices, have proven to be more effective in increasing heat transfer performance as they provide additional area and flow, thereby improving the bulk flow mixing (Chung et al., Citation2014; Flores et al., Citation2019; Korres & Tzivanidis, Citation2019).
In this regard, an attempt was made to investigate the effect of the top curved wall surface of the cavity on turbulent forced convection heat transfer for a range of Reynolds numbers varying from 10,000 to 80,000. To accomplish this purpose, three different configurations of inlet and outlet ports were chosen and analyzed numerically for maximum heat transfer with the help of the CFD tool. Each configuration of the cavity was examined for three different cases of the top surface, specifically, flat, semi-elliptical, and semi-circular, subjected to constant heat flux. ANSYS Fluent 6.3 software was chosen for the numerical simulation because of its extensive acceptance in academia and industry. The RNG k-ε turbulent model was employed for predicting turbulent kinetic energy and its dissipation rate (Fawaz et al., Citation2018; Ramezanizadeh et al., Citation2019; Ullah et al., Citation2020).
2. Problem formulation
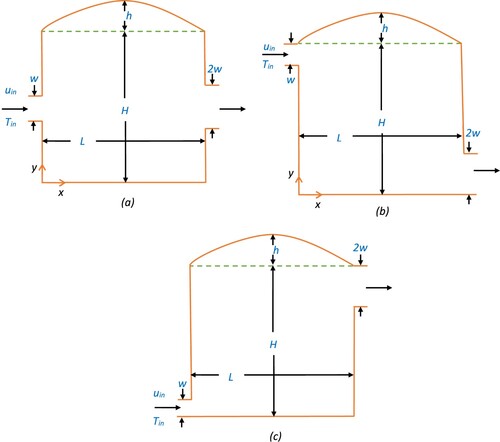
Figure shows an incompressible and steady flow in a two-dimensional cavity subjected to turbulent forced convection. The length and height of the cavity were designated to L and H, respectively. The top wall of the cavity was subjected to constant heat flux q, and the other walls were considered to be adiabatic. The flow enters from the inlet port with velocity uin, temperature Tin and Prandtl number Pr = 0.7282. The inlet port width, denoted by w, is half of the outlet port width. Both the ports were positioned to the side walls. Three dissimilar configurations of inlet and outlet ports were considered, i.e. top to bottom (TB), center to center (CC), and bottom to top (BT). Under each configuration, three different cases of top surface i.e. flat, semi-elliptical and semi-circular (h = 0, 0.25H and 0.5H) were studied. The flow was approximated as incompressible since the Mach number of the flow is low (Anderson, Citation2017).
Figure 1. Schematic diagram of a cavity (a) CC configuration (b) TB configuration (c) BT configuration.
The two-dimensional Reynolds-averaged Navier-Stokes (RANS) equations for steady state, incompressible flow are as follows:
Continuity equation
(1)
(1)
Momentum equation
(2)
(2)
Energy equation
(3)
(3)
The turbulent kinetic energy and its dissipation rate were evaluated from the transport equations and are given byk-equation
(4)
(4) ε-equation
(5)
(5)
The turbulent viscosity and turbulence production
are as follows.
(6)
(6)
The following dimensionless variables were used to obtain the dimensionless form of the governing equations
(7)
(7)
By suitably implementing the above dimensionless variables, the dimensionless governing equations are given by:
Continuity equation
(8)
(8) X-momentum equation
(9)
(9) Y-momentum equation
(10)
(10) Energy equation
(11)
(11)
The Reynolds number , Prandtl number
, turbulent viscosity
, and turbulent thermal diffusivity
are given by
(12)
(12)
-equation
(13)
(13)
-equation
(14)
(14)
is the dimensionless form of turbulence production and is given by,
(15)
(15)
The constants ,
,
,
,
and
were derived empirically (Anderson, Citation2017).
(16)
(16)
2.1. Boundary conditions
At the inlet port, the fluid velocity and temperature were and
, respectively. At the outlet port, the fully developed condition was considered. The physical boundary conditions for three different configurations in the non-dimensional form are given by
For TB configuration,
At inlet;
(17)
(17) At outlet;
(18)
(18)
For CC configuration,
At inlet;
(19)
(19) At outlet;
(20)
(20)
For BT configuration,
At inlet;
(21)
(21) At outlet;
(22)
(22)
The distribution of turbulent kinetic energy and dissipation rate at the inlet was obtained from turbulence intensity and characteristic length
by employing the following equations (Versteeg & Malalasekera, Citation2011).
(23)
(23)
The vertical and bottom walls were assumed to be adiabatic, and the upper wall was exposed to uniform heat flux. The boundary conditions for these walls in the non-dimensional form were expressed as
Vertical walls,
(24)
(24) Bottom wall,
(25)
(25)
Upper wall,
(26)
(26)
The standard wall function was considered to evaluate boundary values at the wall for turbulent kinetic energy and dissipation rate.
2.2. Numerical technique
2.2.1. Computational details and code validation
Furthermore, for solving the governing equations, a pressure-based implicit, steady-state, 2D model was considered. The QUICK scheme was used for discretization under simple pressure-velocity coupling. Besides, the pressure correction, momentum, and turbulent kinetic energy under relaxation factors were set to 0.15. A convergence criterion of 10−5 on residuals for both continuity and momentum, and of 10−6 for energy equations were considered.
2.2.2. Grid refinement test
Moreover, a grid-independent test was also carried out for determining the grid size in the present study. As depicted in Figure , five different equally spaced grid densities (110 × 110, 165 × 165, 220 × 220, 275 × 275, and 330 × 300) of the computational domain were considered.
Figure 2. Extreme value of the stream function for CC cavity with grid size for h = 0 and Re = 40,000.
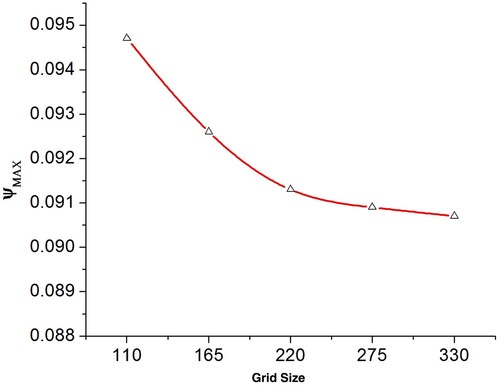
The extreme value of the stream function was taken as a sensitivity measure to evaluate the accuracy of the solution. It was obvious from the test that the accuracy of the solution can be attained with a higher grid size.
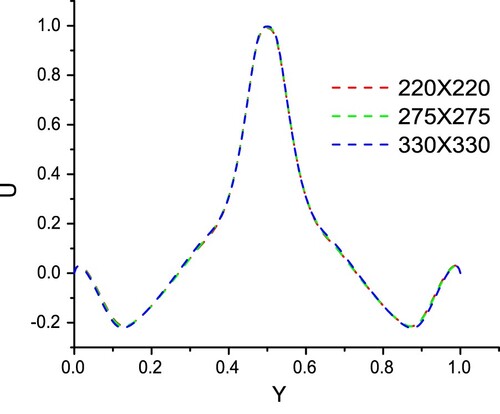
However, the variation in non-dimensional horizontal velocity along the vertical direction in the middle of the computational domain for h = 0 was also plotted as shown in Figure . In view of both the accuracy of the solution and computational time, the present calculation was carried out with a 220 × 220 grid size.
Figure 3. Non-dimensional horizontal velocity, U, at the center of CC cavity as a function of Y for h = 0 and Re = 40,000.
2.2.3. Code validation
Admittedly, the numerical code has been validated by comparing the present results with those of Saeidi and Khodadabi (Citation2006) for the laminar flow in a vented square cavity. The comparison was made in terms of the local Nusselt number distribution across the solid walls of the cavity at Re = 500 for two distinct locations of the outlet port; one at the center of the bottom wall (Figure (a)) while the other at the middle portion of the right wall (Figure (b)).
Figure 4. (a) Validation of present work at Re = 500 for an outlet port positioned at the center of bottom wall. (b) Validation of present work at Re = 500 for an outlet port positioned at the center of right wall.
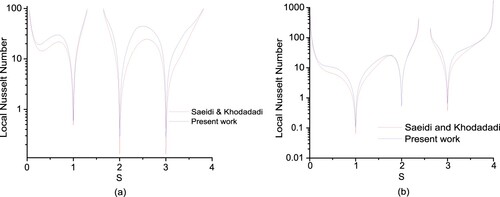
It is obvious from the figure that the present mathematical model and numerical methods are in good agreement. The slight difference in the local Nusselt number, mainly at the center of the wall, was observed due to the fact that the present code is developed for the turbulent flow.
3. Results and discussion
A total of 45 cases were studied for Re = 10,000, 20,000, 40,000, 60,000, and 80,000 to examine the flow pattern and thermal field inside the cavity. These cases include three different configurations of inlet and outlet ports with top wall surfaces either flat, semi-elliptical or semi-circular. In all cases, the inlet and outlet port widths were considered 5% and 10% of the cavity width respectively.
3.1. Flow fields in the cavity
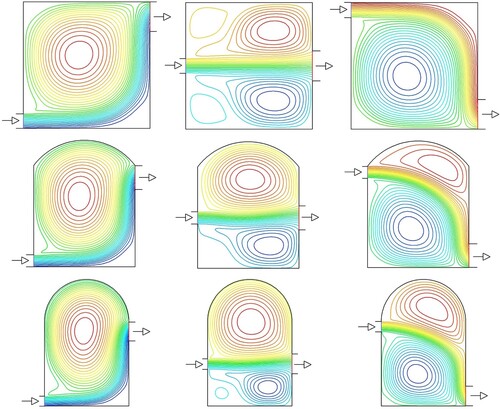
The effect of the top wall surface on the flow field for different configurations of the cavity at Re = 40,000 is illustrated in Figure . It is evident from the figure that the intensity of the CCW vortex above the through-flow increases as the depth of the curved surface increases. Thus, a little deviance can be visualized in the through-flow stream resulting in a high intensity of the CCW vortex. The curved surface provides additional area to heat transfer/fluid flow, thereby improving the bulk flow mixing.
Figure 5. Streamlines for h = 0, 0.25H and 0.5H (top to bottom row) at Re = 40,000 for BT, CC and TB cavity (left to right).
The streamlines for different cases i.e. h = 0, 0.25H and 0.5H with three different positions of inlet and outlet ports (BT, CC and TB) at Re = 20,000 and 60,000, are depicted in Figure (a–c). In all three cases of BT configuration, a single CW vortex occupies the whole cavity as seen in Figure (a). The impact of the induced flow can be easily visualized especially, in the curved surface cavities where a CW rotating cell, smaller in size, is created at a high Reynolds number.
Figure 6. (a) Streamlines for BT configuration at Re = 20,000 (left) and Re = 60,000 (right). (b) Streamlines for CC configuration at Re = 20,000 (left) and Re = 60,000 (right). (c) Streamlines for TB configuration at Re = 20,000 (left) and Re = 60,000 (right).
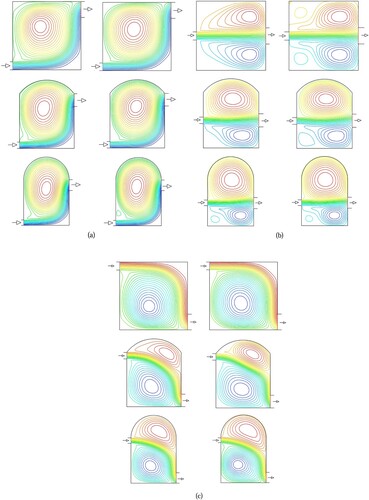
In the CC cavity with h = 0, the flow travels the shortest distance and the streamline is symmetrical as depicted in Figure (b). The incoming flow creates CW and CCW spinning cells below and above the through-flow stream, respectively. Both CW and CCW vortices occupy approximately 80% of the cavity. At a high Reynolds number, the intensity of CW and CCW spinning vortices weaken because of the induced flow. In addition to that, two smaller CW and CCW cells were raised and seen next to the top and bottom left corner of the cavity, respectively. In the semi-elliptical top wall surface cavity (h = 0.25H), approximately 80% of the lower cavity was occupied by the CW rotating vortex, whereas CCW rotating vortex engages the entire portion of the upper cavity. The effect of the curved surface is clearly evident as the rotating cells, both CW and CCW created above the through-flow, were united due to bulk mixing resulted from the enhanced area.
Similarly, in the semi-circular top wall surface cavity (h = 0.5H), the CCW rotating vortex occupies the entire portion of the upper cavity. In addition to CW rotating vortex, the lower part of the cavity also exhibits a CCW spinning vortex. The intensity of the CCW spinning vortex is augmented as the height of the top curved surface increases. This augmented vortex suppresses the through-flow, due to which a CCW vortex was formed next to the bottom left corner. At a high Reynolds number, the incoming flow suppresses this CCW spinning vortex at the bottom left corner.
For h = 0 in a TB cavity, a single CW rotating vortex occupies the area beneath the through-flow stream and the penetration of the induced flow increases with an increase in Reynolds number as illustrated in Figure (c). But the curved wall surface cavities exhibit two rotating cells CCW and CW, one on the upper part and another on the lower part of the cavity, respectively. In a semi-elliptical wall surface cavity (h = 0.25H), increasing Reynolds number leads to an augmentation of rotating cells strength above and below the incoming flow. But the cavity with a semi-circular wall surface (h = 0.50H) shows growth in the size of CW and CCW rotating cells with a rise in Reynolds number. Here, the CCW rotating cell in the upper part of the cavity occupies the maximum area at a high Reynolds number and pushes the through-flow down, which in turn suppresses the CW rotating cell present in the lower part of the cavity and thus increases its size.
3.2. Temperature fields in the cavity
The contours of dimensionless temperature () highlighted in Figure represent the effect of the top surface wall on the temperature field at Re = 40,000. The fluid enters the cavity with
equal to 0. The magnitude of
on the top wall surface varies due to the existence of a CCW rotating vortex above the through-flow stream as discussed in Figure . However, in all the cases, a high-temperature gradient occurs next to the upper portion of the left wall and, in some cases, near the left portion of the top wall. The interface between fresh incoming fluid and CCW rotating vortex displays an intense heat exchange adjacent to the inlet port while the core of the CCW vortex is normally isothermal. The effect of an increased height of the top surface wall can also be sensed in terms of the increased size of the core as well as the moderate temperature gradient near the upper portion of the outlet port.
Figure 7. Temperature fields for h = 0, 0.25H and 0.5H (top to bottom row) at Re = 40,000 for BT, CC and TB cavity (left to right).
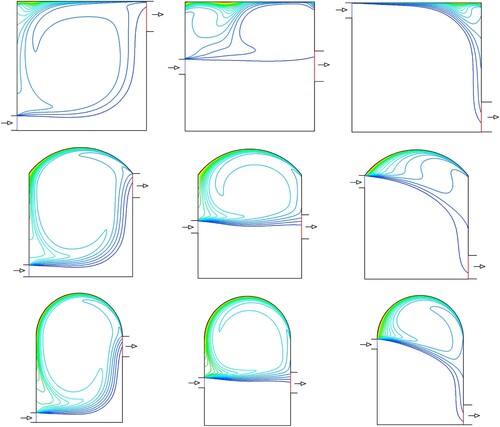
In the TB cavity, an intense temperature gradient can be seen near the right side of the upper wall for h = 0, but as the height increases, the through-flow suppresses the CCW rotating cell to the left, thereby creating a high-temperature gradient to the left side of the upper wall. Also, in BT and CC cavities, the area above the through-flow allows the temperature gradient to spread across the curved surface due to the increased size of the CCW rotating cell. An intense heat transfer was realized at the interface between the through-flow stream and CCW vortex in the semi-circular wall surface cavity (h = 0.05H). This is owing to an increase in the height of the curved wall surface that allows the rotating cell to propagate.
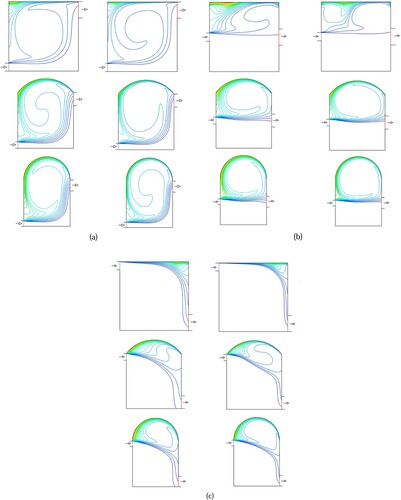
The impact of Reynolds number on the temperature field in all three scenarios i.e. TB, CC and BT is depicted in Figure (a–c). At high Reynolds number, the steeper temperature gradients in the through-flow stream were identified, especially in the curved wall surface cavity. The temperature gradient at the left part of the top wall surface was also enhanced as the Reynolds number is elevated. Consequently, the size of the CCW spinning vortex increases with Reynolds number, which results in high-temperature gradients near the wall.
Figure 8. (a) Temperature field for BT configuration cavity at Re = 20,000 (left) and Re = 60,000 (right). (b) Temperature field in CC cavity at Re = 20,000 (left) and Re = 60,000 (right). (c) Temperature field in TB cavity at Re = 20,000 (left) and Re = 60,000 (right).
3.3. Variation of local Nusselt number on the top wall of the cavity
The heat transfer rate was evaluated by carefully examining the variation of local Nusselt number across the upper wall surface for all three cases i.e. h = 0, 0.25H and 0.5H. The local Nusselt number not only depends on the flow field of the cavity but also the wall geometry. It is determined as
(27)
(27)
Figure (a–c) exhibits the local Nusselt number variations throughout the upper wall surface in all three scenarios (TB, CC and BT) at Re = 40,000. A TB cavity with h = 0 displays a decreasing trend in Nusselt number with its maximum value occurring at the entrance due to the direct contact between the entering fluid and the top wall surface as shown in Figure (a). A CCW vortex created above the through-flow stream enhances the heat transfer towards the right side of the wall surface in the curved surface cavities.
Figure 9. (a) Effect of curved surface on local Nusselt number in TB cavity at Re = 40,000. (b) Effect of curved surface on local Nusselt number in CC cavity at Re = 40,000. (c) Effect of curved surface on local Nusselt number in BT cavity at Re = 40,000.
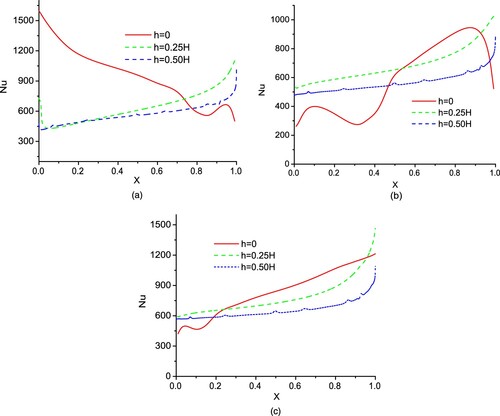
For a curved surface cavity with CC configuration, the peak value is attained at the right side of the wall surface (Figure (b)) due to the presence of a high-intensity CCW vortex as described in Figure . However, the cavity with h = 0.25H enhances the heat transfer rate. The size of the CCW vortex above the through-flow increases with height which magnifies the intensity of the vortex, thereby improving the convection rate. This is the reason for less temperature variation in the semi-circular top surface cavity.
For h = 0, the presence of CW and CCW rotating cells causes the Nusselt number to rise and fall, but its peak value is attained at the right side of the wall surface because of the existence of high-intensity CCW vortex as discussed in Figure .
Regardless of the shape of the top wall surface, the BT cavity always shows an increasing trend in Nusselt number, and its maximum value is reached at the right side of the wall surface as it is evident from Figure (c). This is owing to the fact that the fluid exiting the cavity is adjacent to the top wall surface and the CCW vortex created above the through-flow allows the convection to take place from right to left. Since the CCW vortex in the curved surface with h = 0.25H is smaller in size, it shows high heat exchange.
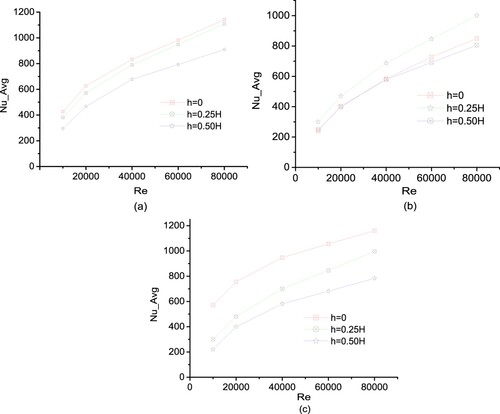
3.4. Variation of average Nusselt number on the top wall of the cavity
The average Nusselt number plays a vital role in estimating the total heat exchange rate in the cavity. The average Nusselt number is defined as
(28)
(28)
Its variation with Reynolds number on the top wall surface is plotted in Figure (a–c). When the Reynolds number increases, the average Nusselt number also increases for all three cases. The comparison also shows a high rate of heat transfer in BT and TB cavities having a flat top surface wall. This is due to the reduced size of the CCW rotating cell above the through-flow stream compared to those present in the curved surface cavities. The cavity with h = 0.25H exhibits heat transfer rate enrichment especially in the CC cavity.
Figure 10. (a) Average Nusselt Number variation with Reynolds number in BT cavity. (b) Average Nusselt Number variation with Reynolds number in CC cavity. (c) Average Nusselt Number variation with Reynolds number in TB cavity.
The overall Nusselt number together with the pressure drop coefficient is considered for selecting the cavity that shows a high rate of heat exchange. For design point of view, the minimum pressure drop coefficient along with the maximum average Nusselt number indicates the best performance of the system. Therefore, the variation in pressure coefficient in different configurations of the cavity is also presented in Figure (a–c) with Reynolds number. The average pressure at the entry and exit ports was evaluated using the pressure coefficient and is given by
(29)
(29)
Figure 11. (a) Variation of pressure drop coefficient with Reynolds number in BT cavity. (b) Variation of pressure drop coefficient with Reynolds number in CC cavity. (c) Variation of pressure drop coefficient with Reynolds number in TB cavity.
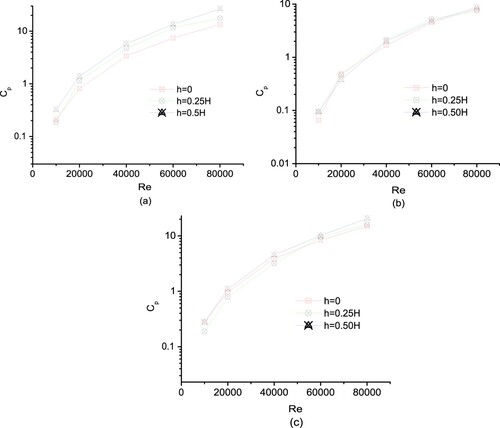
The pressure drop in all types of the cavity increases with mass flow rate (or Reynolds number), but its variation is not significant compared to the average Nusselt number. This is due to the fact that the flow field remains unchanged for all Reynolds numbers. In BT cavity, the semi-circular top wall surface exhibited relatively high pressure drop coefficient for the given Reynolds number. Similar pattern was found in TB cavity but the difference in pressure drop was not as much of BT cavity. On the other hand, an insignificant pressure drop in CC cavity at the same mass flow rate was observed which shows that it is independent of the shape of the top wall surface of the cavity.
4. Conclusion
In this study, the impact of a curved surface on fluid flow and heat transfer has been investigated. For this purpose, three scenarios of top surface wall, i.e. flat, semi-elliptical and semi-circular with three distinct arrangements of inlet and outlet ports were thoroughly examined. In conclusion, the following facts have been observed:
For h = 0 and CC cavity, the streamline was symmetrical and primary and secondary rotating cells occupied approximately 80% of the cavity area. As the depth of the top surface was increased, the strength of the secondary rotating cell increased and in turn, the through-flow slightly moved downward. With a high Reynolds number, the greater strength of primary and secondary cells was investigated. On the other hand, for BT and TB cavities with h = 0, the primary rotating cell dominated and occupied approximately 95% of the cavity area. A growing secondary CCW spinning vortex was recognized above the through-flow stream for h = 0.25H and 0.50H.
An increasing trend in local Nusselt numbers with its maximum value at the right side of the top wall surface was realized due to the presence of a CCW vortex above the through-flow in the CC cavity for all three cases. For equal Reynolds number, a cavity with h = 0.25H exhibited a high rate of heat exchange. In contrast, a decreasing trend in local Nusselt number was investigated for a TB cavity with h = 0. But for h = 0.25H and 0.50H, the maximum value was realized next to the right corner of the wall.
In the CC cavity, the maximum value of the average Nusselt number was achieved for h = 0.25H, but for other positions of inlet and outlet ports, the cavity with h = 0 exhibited the maximum average Nusselt number.
The high-temperature gradients were observed at the upper part of the left wall surface and the left part of the upper wall surface. It was also observed that as the height of the curved surface increases, the heat transfer also increases.
The effect of the top curved surface was detected in the CC cavity. For design point of view, the semi-elliptical top surface was found best suited as it showed maximum average Nusselt number and minimum pressure drop.
Since this study was limited to only three different configurations of inlet and outlet ports, researchers may further extend this work to enhance the thermal performance of the cavity by finding the suitable location of inlet and outlet ports. In addition, they may also consider other base fluids to investigate the effect on its thermal performance.
Nomenclature
| H | = | height of cavity |
| h | = | height of curved surface |
| L | = | length of cavity |
| W | = | width of port |
| p | = | pressure |
| T | = | temperature |
| k | = | thermal conductivity |
| = | generation of turbulent kinetic energy | |
| = | turbulence production rate | |
| I | = | turbulence intensity |
| k | = | turbulent kinetic energy |
| = | coefficient of pressure drop | |
| q | = | heat flux |
| = | dimensionless pressure | |
| Pr | = | Prandtl number |
| Nu | = | Nusselt number |
| Nut | = | local Nusselt number |
| Nuavg | = | total Nusselt number |
| Re | = | Reynolds number |
| u, v | = | components of velocity |
| = | dimensionless of velocity component ( | |
| x, y | = | Cartesian coordinates |
| X, Y | = | dimensionless of Cartesian coordinates (X =x/H, Y = y/H), |
| = | Reynolds stress tensor | |
| = | turbulent heat flux tensor | |
| ρ | = | density |
| α | = | thermal diffusivity |
| αt | = | turbulent thermal diffusivity |
| ϵ | = | turbulent dissipation rate |
| = | viscosity of fluid | |
| = | turbulent viscosity of fluid | |
| = | kinematic viscosity | |
| = | turbulent kinematic viscosity | |
| = | dimensionless temperature |
Subscripts
| Avg | = | average |
| in | = | inlet |
| out | = | outlet |
| max | = | maximum |
| n | = | nondimensional |
Abbreviation
| TB | = | top to bottom configuration |
| BT | = | bottom to top configuration |
| CC | = | center to center configuration |
Supplemental Material
Download PDF (30.2 KB)Supplemental Material
Download Zip (15.2 MB)Disclosure statement
No potential conflict of interest was reported by the author(s).
Related Research Data
References
- Ababaei, A., Abbaszadeh, M., Arefmanesh, A., & Chamkha, A. J. (2018). Numerical simulation of double-diffusive mixed convection and entropy generation in a lid-driven trapezoidal enclosure with a heat source. Numerical Heat Transfer, Part A: Applications, 73(10), 702–720. https://doi.org/10.1080/10407782.2018.1459139
- Anderson, J. D. (2017). Fundamentals of aerodynamics.McGraw-Hill.
- Banaeizadeh, A., Afshari, A., Schock, H., & Jaberi, F. (2013). Large-eddy simulations of turbulent flows in internal combustion engines. International Journal of Heat and Mass Transfer, 60, 781–796. https://doi.org/10.1016/j.ijheatmass-transfer.2012.12.065
- Chamkha, A. J., Hussain, S. A., & Abd-Amer, Q. R. (2011). Mixed convection heat transfer of air inside a square vented cavity with a heated horizontal square cylinder. Numerical Heat Transfer, Part A: Applications: An International Journal of Computation and Methodology, 59(1), 58–79. https://doi.org/10.1080/10407782.2011.541216
- Chung, H. S., Lee, G. H., Nine, M. J., Bae, K., & Jeong, H. M. (2014). Study on the thermal and flow characteristics on the periodically arranged semi-circular ribs in a rectangular channel. Experimental Heat Transfer, 27(1), 56–71. https://doi.org/10.1080/08916152.2012.719067
- Dogonchi, A. S., Ismael, M. A., Chamkha, A. J., & Ganji, D. D. (2019). Numerical analysis of natural convection of Cu–water nanofluid filling triangular cavity with semi-circular bottom wall. Journal of Thermal Analysis and Calorimetry, 135(4), 3485–3497. https://doi.org/10.1007/s10973-018-7520-4
- Fawaz, H. E., Badawy, M. T. S., Abd Rabbo, M. F., & Elfeky, A. (2018). Numerical investigation of fully developed periodic turbulent flow in a square channel fitted with 45° in-line V-baffle turbulators pointing upstream. Alexandria Engineering Journal, 57(2), 633–642. https://doi.org/10.1016/j.aej.2017.02.020
- Flores, F. P., Treviño, C., Rosas, I. Y., Solorio, F., & Suástegui, L. M. (2019). Transient mixed convection in a channel with two facing discretely heated semi-circular cavities: Buoyancy, inclination angle, and channel aspect ratio effects. Experimental Heat Transfer, 32(4), 337–363. https://doi.org/10.1080/08916152.2018.1517836
- Ganesh, N. V., Javed, S., Al-Mdallal, Q. M., Kalaivanan, R., & Chamkha, A. J. (2020). Numerical study of heat generating γ Al2O3–H2O nanofluid inside a square cavity with multiple obstacles of different shapes. Heliyon, 6(12), e05752. https://doi.org/10.1016/j.heliyon.2020.e05752
- Gangawane, K. M., & Oztop, H. F. (2020). Mixed convection in the semi-circular lid driven cavity with heated curved wall subjugated to constant heat flux for non-Newtonian power-law fluids. International Communications in Heat and Mass Transfer, 114, Article 104563. https://doi.org/10.1016/j.icheatmasstransfer.2020.104563
- Hadavand, K., Yousefzadeh, S., Akbari, O. A., Pourfattah, F., Nguyen, H. M., & Asadi, A. (2019). A numerical investigation on the effects of mixed convection of Ag-water nanofluid inside a semi-circular lid-driven cavity on the temperature of an electronic silicon chip. Applied Thermal Engineering, 162, Article 114298. https://doi.org/10.1016/j.appl-thermaleng.2019.114298
- Huang, Y. Y., Yang, G., & Wu, J. Y. (2019). Large eddy simulation and experimental study of turbulent mixed convection inside a cavity with large Rayleigh number: Effect of buoyancy. Building and Environment, 151, 268–279. https://doi.org/10.1016/j.buildenv.2019.01.041
- Izadi, S., Armaghani, T., Ghasemiasl, R., Chamkha, A. J., & Molana, M. (2019). A comprehensive review on mixed convection of nanofluids in various shapes of enclosures. Powder Technology, 343, 880–907. https://doi.org/10.1016/j.powtec.2018.11.006
- Korres, D. N., & Tzivanidis, C. (2019). Development of two new semi-empirical formulas for estimation of solar absorptance in circular cavity receivers. Thermal Science and Engineering Progress, 10, 147–153. https://doi.org/10.1016/j.tsep.2019.01.017
- Liu, J., Hussain, S., Wang, L., Xie, G., & Sundén, B. (2017). Heat transfer and turbulent flow characteristics over pocket cavity in the junction part of an outlet guide vane in a gas turbine. Applied Thermal Engineering, 124, 831–843. https://doi.org/10.1016/j.applthermaleng.2017.06.089
- Ma, A., Liu, F., Zhou, T., & Hu, R. (2021). Numerical investigation on heat transfer characteristics of twin-web turbine disk-cavity system. Applied Thermal Engineering, 184, Article 116268. https://doi.org/10.1016/j.applthermaleng.2020.116268
- Miroshnichenko, I. V., & Sheremet, M. A. (2018a). Turbulent natural convection combined with thermal surface radiation inside an inclined cavity having local heater. International Journal of Thermal Science, 124, 122–130. https://doi.org/10.1016/j.ijthermalsci.2017.09.023
- Miroshnichenko, I. V., & Sheremet, M. A. (2018b). Turbulent natural convection heat transfer in rectangular enclosures using experimental and numerical approaches: A review. Renewable and Sustainable Energy Reviews, 82, 40–59. https://doi.org/10.1016/j.rser.2017.09.005
- Olazo-Gómez, Y., Xamán, J., Gijón-Rivera, M., Noh-Pat, F., Simá, E., & Chávez, Y. (2020). Mathematical modelling of conjugate laminar and turbulent heat transfer in a cavity: Effect of a vertical glazed wall. International Journal of Thermal Sciences, 152, Article 106310. https://doi.org/10.1016/j.ijthermalsci.2020.106310
- Omranian, A., Craft, T. J., & Iacovides, H. (2014). The computation of buoyant flows in differentially heated inclined cavities. International Journal of Heat and Mass Transfer, 77, 1–16. https://doi.org/10.1016/j.ijheatmasstransfer.2014.04.068
- Ramezanizadeh, M., Nazari, M. A., Ahmadi, M. H., & Chau, K. W. (2019). Experimental and numerical analysis of a nanofluidic thermosyphon heat exchanger. Engineering Applications of Computational Fluid Mechanics, 13(1), 40–47. https://doi.org/10.1080/19942060.2018.1518272
- Ryu, D. N., Choi, D. H., & Patel, V. C. (2007). Analysis of turbulent flow in channels roughened by two-dimensional ribs and three-dimensional blocks. Part II: Heat transfer. International Journal of Heat and Fluid Flow, 28(5), 1112–1124. https://doi.org/10.1016/j.ijheatfluidflow.2006.11.007
- Saeidi, S. M., & Khodadadi, J. M. (2006). Forced convection in a square cavity with inlet and outlet ports. International Journal of Heat and Mass Transfer, 49(11–12), 1896–1906. https://doi.org/10.1016/j.ijheatmasstransfer.2005.10.033
- Singh, S., & Sharif, M. A. R. (2003). Mixed convective cooling of a rectangular cavity with inlet and exit openings on differentially heated side walls. Numerical Heat Transfer, Part A: Applications: An International Journal of Computation and Methodology, 44(3), 233–253. https://doi.org/10.1080/7161-00509
- Sourtiji, E., Hosseinizadeh, S. F., Gorji-Bandpy, M., & Khodadadi, J. M. (2011). Computational study of turbulent forced convection flow in a square cavity with ventilation ports. Numerical Heat Transfer, Part A: Applications: An International Journal of Computation and Methodology, 59(12), 954–969. https://doi.org/10.1080/10407782.2011.582406
- Ullah, A., Amanat, A., Imran, M., Gillani, S. S. J., Kilic, M., & Khan, M. (2020). Effect of turbulence modelling on hydrodynamics of a turbulent contact absorber. Chemical Engineering and Processing – Process Intensification, 156, Article 108101. https://doi.org/10.1016/j.cep.2020.108101
- Versteeg, H. K., & Malalasekera, W. (2011). An introduction to computational fluid dynamics: The finite volume method. Pearson Education.
- Zamora, B. (2018a). Heating intensity and radiative effects on turbulent buoyancy-driven airflow in open square cavities with a heated immersed body. International Journal of Thermal Sciences, 126, 218–237. https://doi.org/10.1016/j.ijther-malsci.2017.12.030
- Zamora, B. (2018b). Oscillating convective airflow in a vented cavity with a heated immersed body. Influence of the heating intensity. International Communications in Heat and Mass Transfer, 95, 9–18. https://doi.org/10.1016/j.icheatmasstransfer.2018.03.026
- Zamora, B., & Kaiser, A. S. (2016). Radiative effects on turbulent buoyancy-driven airflow in open square cavities. International Journal of Thermal Sciences, 100, 267–283. https://doi.org/10.1016/j.ijthermalsci.2015.10.002