
 ?Mathematical formulae have been encoded as MathML and are displayed in this HTML version using MathJax in order to improve their display. Uncheck the box to turn MathJax off. This feature requires Javascript. Click on a formula to zoom.
ABSTRACT
In-pipe water turbines have begun to gain interest for harvesting power on a small scale from pipe networks. However, few studies have addressed the feasibility of installing spherical lift-based helical-bladed turbines in a water supply network. Points such as the pressure drop and generated power remain unexplored. In this study, a three-dimensional numerical model, based on OpenFOAM, is used to investigate the performance of the spherical lift-based helical-bladed in-pipe water turbine. The study aims to evaluate how the geometric properties of this turbine affect its performance in terms of power and efficiency, and the hydraulics of pipe flow in terms of pressure drop. The study considers a turbine of diameter 600 mm, with the following geometric properties: number of helical blades 3, 4 and 5; blade chord length 10%, 15% and 20% of turbine diameter D; blade helicity 0°, 60° and 120°; and pitch angle −6°, −3°, 0° and 3°. These parameters are analyzed at tip speed ratios (TSRs) of 2, 3 and 4. The results show that the five-blade turbine yields a power of 1300 W, while the three-blade turbine yields only 870 W, at an optimum TSR of 3. A change in the chord length of 50% (from 0.10D to 0.15D) increases the turbine power by 88.4% and efficiency by 40% for the same TSR. A further change to 0.20D gives no significant improvement in efficiency or power output. An increase in the helical angle from 0° to 120° results in a 22.8% reduction in turbine power. The turbine achieves the maximum power output of 1350 W at zero pitch angle, with a corresponding efficiency of 27%. The maximum head loss observed is 1.6 m, which represents 2.7% of the total head in the pipe. Solidity has a more pronounced effect on head losses than helicity and pitch angle.
Introduction
Hydropower is the most abundant, cheap and predictable source of renewable energy. Therefore, it has registered a steady and fast growth driven by the demand for clean, reliable, steady and affordable power. Turbines are used to extract the potential energy of water flow and convert it into electrical energy. While various types of water turbines have been around for hundreds of years, more recently, interest has grown over in-pipe turbines for harnessing clean renewable energy from excess head in domestic water pipelines. Power output ranges from 0.1 kW to 100 kW can be achieved for one turbine, although more power can be produced using multiple installations. Their applications mainly fall between two types of pipelines system, namely, gravity-fed and pressurized pipelines. They can be installed in gravity-fed pipelines supplying water from elevated tanks or mountains; in such cases, the free potential energy is converted into electrical energy. However, other applications include the installation on domestic pressurized pipelines; e.g. at the locations of pressure relief valves in water mains, to power water metering and water monitoring/control stations that are isolated from the electrical grid. These in-pipe turbines have diameters in the range of 82–250 mm, flow velocity of 1.5–3 m/s, number of blades from six to 20 and power output of 88–480 W.
Pipe turbines are classified according to their axis of rotation, into vertical and horizontal axis turbines. Vertical axis turbines have the advantages of operating independent of incident flow direction and achieving higher efficiency at lower speed. Based on the driving force, vertical axis turbines are either drag or lift based. A few in-pipe turbines of drag type have been introduced and studied (e.g. Chen et al., Citation2013; Hasanzadeh et al., Citation2021; Jiyun et al., Citation2018; Ma et al., Citation2018; Samora et al., Citation2016). However, these studies showed that the power output (and hence power coefficient) of drag pipe turbines is relatively low, with significant corresponding pressure losses. For instance, a pressure head loss of 5 m was reported by Ma et al. (Citation2018) with a 250 mm turbine, yielding only 480 W, while for a smaller diameter of 100 mm, Hasanzadeh et al. (Citation2021) optimized a drag-based turbine to produce 200 W for the same pressure head loss of 5 m. Drag turbines generally require more blades to build sufficient flow resistance, and this has negative consequences on performance and results in more flow area blockage. On the other hand, lift-based turbines, developed in 1926 and known as the Darrieus wind turbine, have lower obstruction to flow than drag-based turbines, offering generally better starting capabilities and a higher power coefficient.
In 2011, a commercial lift-based in-pipe turbine (Schlabach et al., Citation2011) was introduced to the market for generation of power from gravity-fed large pipelines with diameters of 600 to 1500 mm, with power of 14 and 100 kW, respectively. Although a decade has passed since the development of the first commercial lift-based in-pipe turbine, very few studies exist in the literature that evaluated the performance of this type of turbine (e.g. Tahadjodi Langroudi et al., Citation2020; Purdue ECT Team, Citation2016; Yang et al., Citation2019). Tahadjodi Langroudi et al. (Citation2020) presented theoretical and numerical analyses for the effect of multiple design parameters on the power coefficient, pressure coefficient and cavitation probability as performance metrics. Yang et al. (Citation2019) investigated the start-up performance and pressure head loss of lift- and drag-based turbines inside a pipe of 200 mm via numerical and experimental analyses, and concluded that the pressure head loss is less than 3% of the total head. The Purdue ECT Team (Citation2016) studied the relationship between power output, diameter and head loss in lift-based pipe turbines. Several studies have studied lift-based turbines; however, little is known about how spherical helical lift-based turbines fit inside a pipe, in terms of quantifying the head loss caused by these turbines and disturbance to the flow, which is crucial from a hydraulics aspect. The power output is also an important aspect, to make sure that the turbines satisfy the main purpose of installation in off-grid locations in the water supply network. The aforementioned studies layout the foundation for a better understanding of the feasibility of spherical lift-based in-pipe turbine utilization; however, some turbine performance metrics remain unexplored, such as the extent of the turbine wake effect on the velocity profile in the pipeline; the interaction between turbine parts, such as the hubs and shaft, with the flow of water; and the pressure head loss and power associated with larger pipe diameters, and 600 mm in particular.
Therefore, this paper aims to add to the existing literature on lift-based in-pipe turbines, by (1) assessing the performance of a vertical-axis water pipe turbine to provide insight on the influence of various geometric design parameters on turbine performance (torque, power and efficiency) for a practical pipe diameter (600 mm) under confined flow in pipes; (2) evaluating how altering the operating conditions [tip speed ratio (TSR) and velocity] and geometric parameters affects the pressure drop inside the pipeline under steady rotation and stall conditions; and (3) determining the impact of the turbine shaft and hubs on the overall turbine performance, and the extent of the wake generated by the turbine. Relevant variables include geometric properties such as the shaft, hubs, number of blades, chord length, solidity, helicity and pitch angle. While most of the literature on pipe turbines analyzed small turbines with diameter ≤ 250 mm, this study investigates a larger diameter of 600 mm, which represents typical main pipelines with flow velocity greater than 2.0 m/s.
A three-dimensional (3D) numerical model, based on OpenFOAM, was utilized to investigate the performance of one of the available in-pipe water turbines, namely the lift-based helical-bladed turbine. Various geometric properties and operational parameters of the helical-bladed turbine are explained first, followed by a brief description of the numerical model used in the analysis of the turbine, and the built mesh and boundary conditions. The model was validated against experimental measurements for similar turbines available in the literature. Once the model had been validated, it was used to examine the effect of altering the turbine geometric properties and operational parameters on its performance in terms of turbine power, torque, efficiency and head losses.
Methodology
Vertical axis lift-based pipe turbine
Evolving from the Darrieus wind turbine, the Gorlov helical turbine (Gorlov, Citation1995) was developed by changing the blades from straight to helical in an attempt to decrease the encountered pulsatory torque issues and increase turbine efficiency. Further, the Gorlov helical wind turbine was utilized in pipelines by changing its shape from cylindrical to spherical (Schlabach et al., Citation2011).
Figure shows the Gorlov pipe turbine, which has a spherical shape to fit in a pipe. The turbine shaft or axis of rotation is always perpendicular to the flow, regardless of its direction; thus, it will always rotate in the same direction, with an angular velocity ω. The turbine blades helically sweep the sphere’s outer imaginary surface area and are connected to the bottom and top hubs. All blades have the same cross-section, with the shape of a hydrofoil; usually, a NACA 0020 hydrofoil is used for better hydrodynamic characteristics (Talukdar et al., Citation2018). The hydrofoil chord length, c, is about 15% of the turbine diameter, at zero blade curvature to pitch angle ratio, β.
Figure 1. (a) Gorlov pipe turbine components; (b) drag and lift forces on a single-blade hydrofoil.
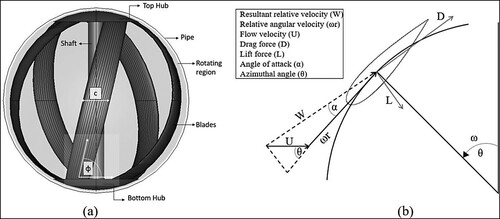
The Gorlov turbine concept is based on the movement of the hydrofoils in order to change the apparent direction of the flow or Azimuth angle θ, relative to the hydrofoil axis, and thus change the (apparent) “angle of attack” of the hydrofoil, α. This generates lift and drag forces on each of the turbine hydrofoils. With lift force prevailing, the resultant force on each hydrofoil propels the turbine in the clockwise direction, causing a torque from which the energy is generated. In the spherical turbine, blades have a helical angle, Φ, which has an important effect by distributing evenly the hydrofoil sections throughout turbine rotation cycle. Thus, there will be always a hydrofoil section at every possible angle of attack. In this way, the sum of the lift and drag forces on each blade does not change abruptly with rotation angle, generating a smoother torque curve, so there is much less vibration and noise than in the Darrieus design. It also minimizes stress in the pipe section where the turbine is installed and facilitates self-starting of the turbine. The Gorlov turbine can achieve efficiency of about 25–30%, where efficiency is defined as:
(1)
(1)
where T = torque,
= water density, g = acceleration due to gravity, Q = volumetric flow rate and
= head losses across the turbine.
Two parameters play an important role in the performance of the considered pipe turbine; namely, the tip speed ratio (TSR) and rotor solidity (σ). The solidity is defined as the ratio between the total blade area to the swept area, and can be expressed as:
(2)
(2)
and the TSR is defined as follows:
(3)
(3)
where N = number of rotor blades, c = hydrofoil chord length, U = approaching flow velocity, ω = angular velocity and D = pipe diameter. The recommended value of σ for vertical axis wind turbines is in the range of 0.2–0.6. For low TSR values, the turbine will tend to slow or stall, while for high TSR values, the turbine will rotate too quickly to extract power and will be stressed and may structurally fail. Thus, the optimal TSR value corresponds to the highest power output from the turbine, and it depends on the turbine rotor and blades and is specific for each turbine.
Model description
Computational fluid dynamics (CFD) models have shown to be effective tools not only for the preliminary design, geometric optimization and performance assessment applications of water turbines (Jiyun et al., Citation2018), but also for applications such as liquid sloshing in reservoir tanks (Ghalandari et al., Citation2019) and the computation of drag and lift coefficients (Salih et al., Citation2019). In this study, a 3D numerical model, based on OpenFOAM, has been utilized to evaluate how the geometric properties of a lift-based helical-bladed turbine affect its performance.
OpenFOAM (Citation2019) is open-source software that solves the 3D unsteady Reynolds-averaged Navier–Stokes (URANS) equations for incompressible flow. The shear stress transport (SST) k-ω turbulence model is chosen for numerical system closure, since it is capable of predicting flow separation and adverse pressure gradients and has been classified as one of the most reliable turbulence models for turbine numerical simulation, having good agreement with experimental data (Alemi et al., Citation2015; Gourdain, Citation2015; Roy & Saha, Citation2013).
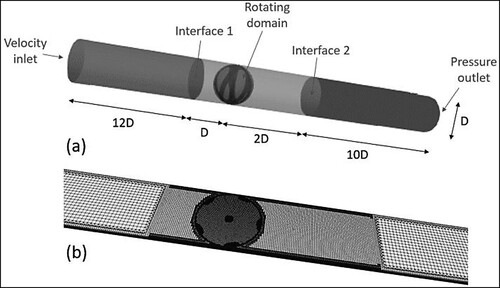
To alleviate the effects of boundary conditions on turbine simulation, inlet and outlet pipe lengths are set 12 and 10 times the pipe diameter, respectively. The pipe diameter is considered to be 600 mm, with 5 mm clearance between each turbine hub and pipe; thus, the turbine diameter is 590 mm. Turbine model geometry was first generated using SALOME (Citation2019) 3D computer-aided design software. Afterwards, the model is imported to OpenFOAM and split into multiple components, as shown in Figure (a) (inlet pipe, turbine and outlet pipe) containing patches for physical boundary conditions. The model mesh has a stationary domain (pipe) and a rotating domain (turbine) (Figure b). The turbine components, i.e. blades, hubs and shaft, are assigned different patches. They are included in the spherical rotating volume, with a free stream spherical interface boundary patch. A constant volumetric flow rate is assigned at the pipe inlet and a pressure head at the pipe outlet downstream of the interface.
Figure 2. (a) Domain components of the test case; (b) cross-section of the computational grid.
Results
A basic structured background 3D hex mesh was generated using blockMesh to represent the boundaries of the computational domain. Then, the snappyHexMesh utility was used to generate the final hexahedra and split-hexahedra mesh from the triangulated surface geometries. Because of the asymmetric nature of the turbine, the mesh was generated over the whole domain and solved in 3D. Transient simulation with adjustable time steps, with an average of 2−5 s per time step, was implemented using a sliding mesh technique. Initial runs with approximately 1.5, 2.1, 4, 5 and 5.7 million grids were carried out to study mesh dependence and optimize its size while probing the turbine’s output power, efficiency and head loss (Figure a). The results showed that the output turbine power started to stabilize with a maximum difference of 1% starting from the 4 million-grid mesh. Thus, the 4 million grid is utilized in this study, as it offers a good balance between computational time and numerical accuracy.
Figure 3. (a) Error percentage versus mesh size (6 million mesh is the reference); (b) torque variation for the second and third turbine revolutions.
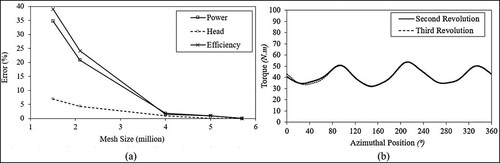
A detailed sensitivity analysis was performed for time step and convergence criteria (Rezaeiha et al., Citation2018). Analysis showed that an azimuthal increment angle of 0.0295° per time step would be sufficient for proper solution convergence, with a mean Courant number of 0.0025. The instantaneous torque output versus the azimuthal position during a complete turbine revolution for 15 revolutions of five turbine cases with various rotation speeds (from 134 to 268 rpm) was monitored. It was found that a minimum of three turbine revolutions was needed to reach a statistically steady-state solution. Figure (b) shows a sample of the torque produced from two consecutive turbine rotations; beyond the third revolution, the torque curves overlap. The computational time required for one the cases was about 12 h to reach the steady-state solution, which was used as the initial solution for the transient case. The transient case solution for three revolutions of the turbine took an average of 648 h (27 days) using an Intel Xeon Quad CPU E3-1271v3 @ 3.60 GHz. A total of 28 runs was simulated using two workstations for almost a year. Table summarizes the turbine parameters used in different simulations of various runs. The examined parameters are the flow velocity, TSR, number of blades, chord length, helicity and pitch angle.
Table 1. Parameters of various simulated turbine cases.
Model validation
The model was validated using the experimental data of Samora et al. (Citation2016), examining a horizontal-axis in-pipe drag turbine, and Yang et al. examining a vertical-axis in-pipe lift turbine. To compare the power and head predictions of the model against the experimental data, the geometry and flow conditions of the denoted experiments were simulated using OpenFOAM. Figure shows the predicted values of power and head from the model simulation compared to the measured values from the experiments under various volumetric flow rates. Average errors between the measured and predicted values of turbine power and head drop were 4% and 8%. Tahadjodi Langroudi et al. (Citation2020) reported a numerical model error of head drop from 6% to 8%. It is observed that the model tends to underestimate the head drop for high flow rates by up to 32% and overestimate the power for low flow rates by up to 15.7%. The approximation made in the geometry of the turbine prior to modeling contributed to these errors. However, the model was able to capture the trend in power and head drop. Thus, OpenFOAM and the proposed SST k-ω turbulence model were deemed appropriate to describe and solve the turbine numerical scheme.
Figure 4. OpenFOAM model results compared to experimentally measured turbine power and head loss versus volumetric flow rate. [Experimental results from Samora et al. (Citation2016) and Yang et al. (Citation2019).]
![Figure 4. OpenFOAM model results compared to experimentally measured turbine power and head loss versus volumetric flow rate. [Experimental results from Samora et al. (Citation2016) and Yang et al. (Citation2019).]](/cms/asset/e4627849-e558-4ea6-9e38-d8219212f66e/tcfm_a_2019129_f0004_oc.jpg)
Turbine torque
Lift and drag forces were calculated on a single blade in a turbine (N = 5, c = 58 mm, Φ = 60°, β = 0° and TSR = 2, 4) through a complete turbine revolution, as shown in Figure (a). Using the OpenFOAM results, the pressure forces on each blade in the x- and y- directions were used to calculate both tangential, FT, and normal, FN, forces on each blade, as follows:
(4)
(4)
(5)
(5)
Following the calculation of the tangential and normal forces on the blades, the lift and drag forces can be calculated using the following equations:
(6)
(6)
(7)
(7)
Figure 5. Turbine driving forces and output torque during a complete turbine revolution: (a) lift and drag forces on a single blade; (b) torque of each blade and overall turbine torque; (c) torque and angle of attack for a single blade; (d) torque fluctuations for various flow velocities. TSR = tip speed ratio.
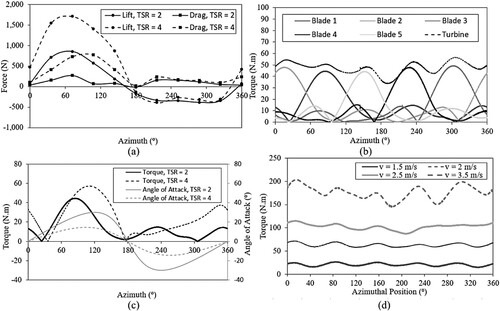
The above-mentioned forces were calculated for each blade at multiple sections along the blades’ helical route. The performance of the turbine blades is similar to that of a typical hydrofoil blade; the lift force on the blade is typically much higher than the drag force during a turbine revolution (Figure a). Lift and drag forces increase with the turbine revolution (increase in azimuth angle, θ), until a maximum value is reached at θ = 72°, corresponding to α = 22°. At the azimuth angle of 72°, flow separation starts to occur around the blade (Figure ), leading to a deterioration in its hydrodynamic performance, by reducing the lift force approaching a stall condition. At mid-turbine revolution, θ = 180°, lift force becomes zero and starts to change sign and thus direction, while drag force decreases to a minimum value, then maintains the same direction and sign. Thus, for this turbine, 22° is the critical angle of attack of the blade, where the highest turbine torque is typically achieved during a single revolution (Figure b). Changing the TSR from 2 to 4 causes the stall condition to occur earlier in the turbine revolution at a lower angle of attack, and the average blade torque output increases by 150% (Figure c). The impact of changing the TSR from 2 to 4 on lift and drag forces is more pronounced during the first half of turbine rotation (0° ≤ θ ≤ 180°) since it doubles both lift and drag forces; however, it diminishes during the second half of turbine rotation (180° ≤ θ ≤ 360°).
Figure 6. Pressure (Pa) and velocity (m/s) distribution around a single blade (at mid-height) at different azimuth positions; tip speed ratio (TSR) = 2.
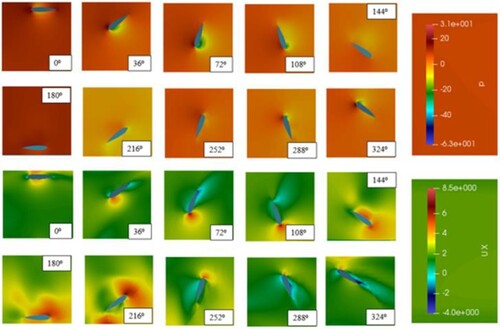
It is expected that higher flow velocities would enhance turbine performance significantly but also cause higher head losses. An increase in the flow velocity from 1.5 m/s to 3.5 m/s yielded a torque 4.5 times higher than the initial value (Figure d). In addition, the turbine power reached up to 3600 W from 400 W (nine times higher). However, higher flow velocity induced more head losses at the turbine, which were increased from 0.6 m (at U = 1.5 m/s) to 1.6 m (at U = 3.5 m/s), an increase of 167%. A pressure drop of 1.6 m represents 2.7% of the total pressure head in the simulated case; this observation agrees with the conclusion by Yang et al. (Citation2019) for a similar turbine with a smaller diameter of 200 mm, which induced head losses of less than 3% for the flow rates included in their study.
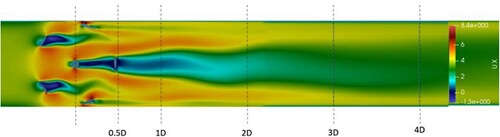
It is to be noted that an advantage of the turbine is that it does not obstruct flow in the pipeline in stall condition, nor does it induce high pressure losses. Figure shows the velocity distribution along the center section of the pipe for a stall turbine with high velocity U = 3.5 m/s. Despite the high flow velocity, the pipe velocity profile started to get rid of the blade wake effects and became fully developed at a distance equal to around four times the pipe diameter, with a head loss of 0.67 m.
Figure 7. Velocity distribution (m/s) inside and downstream of a static turbine (at pipe mid-section); flow velocity = 3.5 m/s. TSR = tip speed ratio.
Simulations showed that high flow velocity increases the turbine efficiency from 18% (at U = 1.5 m/s) to a maximum value of 28% (at U = 2.5 m/s). Not only does the efficiency not improve with the increase in flow velocity beyond 2.5 m/s, but also it decreases, owing to the increase in head losses at the turbine. As discussed, the increase in flow velocity through the turbine would yield a corresponding increase in torque and thus turbine power. However, this increase in power has to be considered with an associated increase in head losses through the turbine, and thus a decrease in the turbine efficiency; and a corresponding increase in the turbine torque fluctuations (Figure d), which would structurally affect the life and performance of the pipe and turbine. It was found that a flow velocity of 2 m/s would yield the highest efficiency for the turbine cases studied in this paper with relatively low torque fluctuations. Thus, in the following analysis, the flow velocity was set to 2 m/s and the TSR was varied by changing the turbine speed (rotations per minute, rpm). Preliminary runs were made for the turbine with TSR ranging from 0.2 to 6 to find the optimal TSR value, which corresponds to the maximum output power and efficiency. The simulations showed that the optimal TSR value was about 3; therefore, a range of TSR from 2 to 4 was deemed appropriate to carry out the next runs to identify the optimal number of blades and chord length.
Blade number
The effect of the number of turbine blades, N, on the turbine performance was also investigated. Turbines with three, four and five blades were examined. As demonstrated by Lucid Energy Technologies (Schlabach et al., Citation2011), turbine blades are fixed from the top and bottom to hubs, which cannot accommodate more than five helical blades from a design viewpoint; this geometric constraint makes it more feasible to control turbine solidity via chord length adjustment. Thus, the maximum number of possible blades was set to five. The increase in the number of turbine blades increases turbine solidity, as dictated by Equation Equation(2)(2)
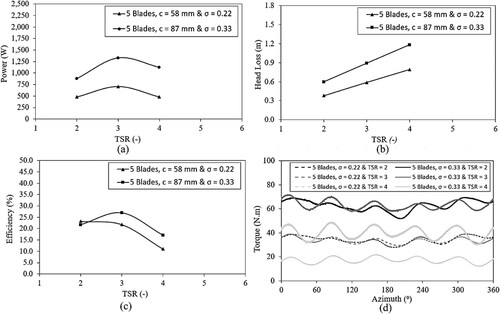
(2) and shown in Figure (a), which increases the capacity of the turbine to yield more power. The turbine with five blades yielded a power of 1300 W, while that with three blades yielded only 870 W, at optimum TSR. An increase in turbine solidity by 67% (from N = 3 to 5) increased the turbine power yield by 50% (from 870 W to 1300 W). Jiyun et al. (Citation2018) reported that for lift-based cross-flow turbines, increasing the number of blades would increase the turbine power.
Figure 8. Performance of three-, four- and five-bladed turbines versus tip speed ratio (TSR): (a) output power; (b) output torque during complete turbine revolution at TSR = 3; (c) efficiency; (d) head losses.
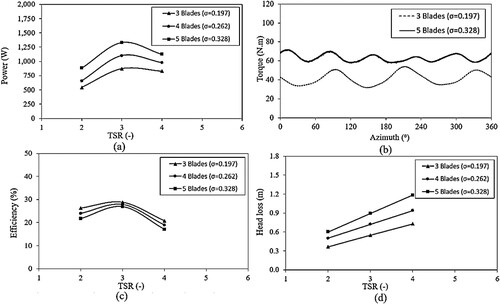
The increase in the number of turbine blades also increased turbine torque, from 45 N.m (for N = 3) to 65 N.m (for N = 5), and reduced the unwanted torque fluctuations by generating more (five) peaks during a complete revolution of the turbine, at θ = 16°, 88°, 160°, 232° and 304°, as shown in Figure (b). The simulation also showed that turbine power and efficiency increased with the increase in TSR, reaching a peak (at optimum TSR of 3), and then decreased. This trend has also been documented for lift-based turbines by other investigators (e.g. Jiyun et al., Citation2018). Maximum turbine efficiency (Figure c), at TSR = 3, was found to be almost the same for N = 3, 4 and 5, with an average value of 29%. Thus, the increase in the number of blades from three to five did not have much effect on the overall efficiency of the turbine, as the increase in torque was balanced by the corresponding increase in the head losses across the turbine (Figure d).
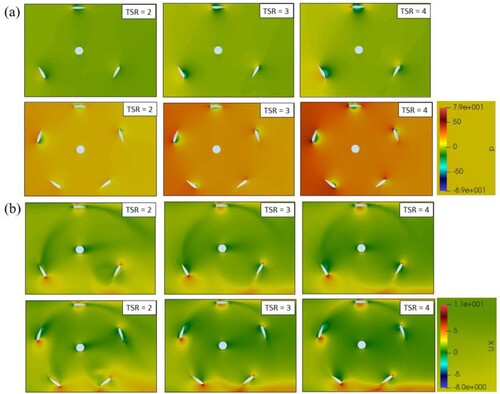
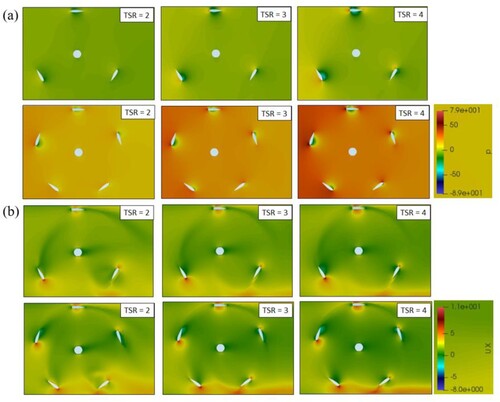
Figure shows the pressure and velocity distribution at the mid-section of the three- and five-blade turbines at various TSR values. It can be seen from the figure that for TSRs in the range of 2–4, the increase in the number of turbine blades from three to five decelerated the flow velocity inside the domain enclosed by the turbine. Thus, the pressure would increase and consequently the lift on blade would also increase, enhancing the turbine power.
Figure 9. Flow field in and around the turbine (at mid-height) for three- and five-bladed turbines at different tip speed ratios (TSRs): (a) pressure field (Pa); (b) velocity field (m/s).
Chord length
To investigate the effect of the chord length of the turbine blade on its performance, the chord length was changed from 58 mm (around 10% of turbine diameter) to 87 mm (around 15% of turbine diameter). The turbine solidity represents resistance to flow in pipelines by blocking a portion of the pipe cross-sectional area. In the case of high turbine solidity, in addition to the rotational speed of the turbine, the turbine can behave as an obstacle to water and thus would experience a high reduction in efficiency. Talukdar et al. (Citation2018) recommended that turbine solidity must be in the range of 0.2–0.35 for the best operational conditions. On the other hand, Li and Li (Citation2010) suggested that a narrower range of helical turbine solidity (0.15–0.20) would be better, to ensure that the turbine efficiency would not drop significantly for high flow conditions.
For a chord length of 58 mm, the turbine solidity was 22%, while it was 33% for a chord length of 87 mm. Nonetheless, Figure (a) shows that the turbine power was 700 W and 1300 W for blade chord lengths of 58 mm and 87 mm, respectively. Hence, the turbine power increased by 88.4% for a 50% bigger chord length (from 58 mm to 87 mm) at the optimal TSR value of 3. Other runs showed that a bigger chord length of 116 mm resulted in a slight increase in turbine power, with new power of only 1380 W. The pressure drop across the turbine varied linearly with TSR for simulated chord lengths, since rotating the turbine with higher speed increases the interaction/blockage of flow through the turbine, thus inducing more head loss (Figure b). High turbine solidity is expected to have the same impact on pressure drop as high TSR owing to the additional flow blockage. For a 50% increase in chord length (from 58 mm to 87 mm), the head losses varied by a similar percentage of around 54% (from 0.59 m to 0.89 m) at a TSR of 3. Examining the results of the turbine efficiency (Figure c), it can be seen that increasing the chord length (from 58 mm to 87 mm) improved the overall turbine efficiency (from 20% to 27%) at a TSR of 3. A further increase in chord length, to 116 mm, showed that the turbine efficiency would only reach 28%, which can be attributed to the high head loss encountered for a chord length of 116 mm. Moreover, a bigger chord length of 87 mm reduced torque fluctuations (Figure d).
Figure 10. Performance of five-bladed turbines with chord lengths of 58 and 87 mm versus tip speed ratio (TSR): (a) output power; (b) head losses; (c) efficiency; (d) output torque during complete turbine revolution at TSR = 2, 3 and 4.
Both the number of blades and the chord length are significant contributors to turbine solidity. However, practical limits restrict the number of helical blades to five and it is recommended that solidity should not exceed 0.35. In this study, a chord length of 20% of the turbine diameter yielded the highest efficiency and lowest power fluctuations. Previous results show that the effect of blade chord length is more pronounced in enhancing turbine performance than that associated with the number of blades. A change in solidity by 67% (by increasing the number of blades from three to five) led to higher turbine output power, by 52%, at TSR = 3, while a change in solidity by only 50% (by increasing the chord length from 58 mm to 87 mm) increased the power output by 88.4%.
Figure shows the pressure and velocity distribution at the mid-section of five-bladed turbines with chord lengths of 58 and 87 mm at different TSR values. It was observed that the increase in turbine solidity due to increasing chord length had an impact on both the velocity and pressure inside the turbine. Increasing the chord length induced a change in the flow field inside the turbine, especially around the blades, which was associated with changes in the pressure magnitude. This resulted in higher pressure variation across a single blade and higher lift force and power output.
Figure 11. Flow field in and around five-bladed turbines (at mid-height) for chord lengths of 58 and 87 mm at different tip speed ratios (TSRs): (a) pressure field (Pa); (b) velocity field (m/s).
Helicity
The helical shape of the turbine blades is the main contribution made by Gorlov for enhancing turbine performance compared to straight-bladed turbines. The helical angle, Φ, is changed from zero (straight blades) to 60° and 120°. Figure (a) shows that at a TSR of 3, all of the rotors experienced the highest power of 1443, 1328 and 1114 W for Φ = 0°, 60° and 120°, respectively. The turbine with straight blades, Φ = 0°, had the highest power output at TSR = 3, while blades with Φ = 60° and 120° had lower power output. Increasing the helical angle from 0° to 120° resulted in a 22.8% reduction in turbine power. However, when examining the performance of the rotors at any TSR, the rotor with straight blades has the lowest power compared to rotors with a helical blade shape. Thus, helical-bladed rotors have an advantage over straight-bladed ones by providing a steadier power over a range of TSR values, while straight-bladed rotors provide the highest power.
Figure 12. Performance of a five-bladed turbine with helicity of 0°, 60° and 120° versus tip speed ratio (TSR): (a) output power; (b) head losses; output torque during complete turbine revolution at (c) TSR = 2 and (d) TSR = 4.
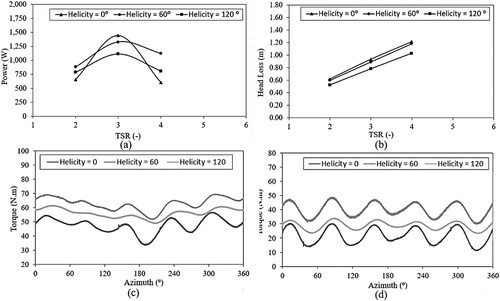
Adjusting the helicity from 60° to 120° resulted in a reduction in the power, by 10.7%, 16% and 28%, at TSRs of 2, 3 and 4, respectively. This means that increasing the helicity beyond a certain value (60° in this study) would result in a reduction in the power produced by the turbine. The torque curve tended to be stable, with minimum variation until it reached the least fluctuation at Φ = 120° (Figure c and d). This is typical behavior for NACA hydrofoil blades, which achieve their hydrodynamic maximum when flow is perpendicular to the blade section (in straight-bladed turbine). In helical-bladed turbines, the flow over the blades is deformed in a span-wise direction, reducing blade section efficiency and thus total turbine efficiency. Marsh et al. (Citation2015) investigated the effect of helicity from 0° to 120° at a stream velocity of 1.5 m/s and TSR in the range of 1.5–3.5, and observed similar results, with the straight-bladed rotor having the highest power output, while increasing the blade overlap reduced the power output.
Figure (b) shows the head loss across the rotor of the turbine for Φ = 0°, 60° and 120° at TSRs of 2, 3 and 4. When the helicity was reduced from 60° to 0°, the head loss increased by 3.4%, 4.9% and 2.7% at TSRs of 2, 3 and 4, respectively. On the other hand, when helicity was adjusted from 60° to 120°, the head loss was reduced almost by 12% for all TSR values. Thus, a high helical angle reduced the head loss across the turbine. In general, the effect of blade helicity on head losses was less pronounced than the effects on power output and overall efficiency.
Pitch angle
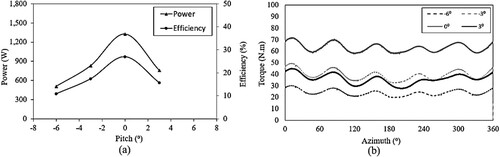
The effect of blade curvature, or blade pitch angle β, on the turbine performance was further studied by examining the effect of β on turbine output power, torque and efficiency. Pitch angles of 0°, 3°, −3° and −6° were considered in the analysis. The maximum power (1350 W) and efficiency (27%) were achieved by the turbine when β was 0°. At other pitch angles, the power and efficiency significantly decreased, as shown in Figure (a). For pitch angles of ± 3°, turbine power and efficiency decreased by 38%; this is attributed to the early stall effect on the blade. On the other hand, the variation in blade pitch angle was found to have a negligible effect on the head losses across the turbine; a variation of head losses of 2% was observed at β = −6° compared to β = 0°. The highest torque was produced by the turbine at zero pitch angle, as shown in Figure (b). While both negative and positive pitch angles produced lower torque values, negative pitch angles had higher torque than positive pitch angles. However, the pitch angle variation did not have a noticeable effect on changing the torque fluctuations.
Figure 13. Performance of a five-bladed turbine with various pitch angles: (a) output power and efficiency; (b) output torque during complete turbine revolution at tip speed ratio (TSR) = 3.
Hubs and shaft
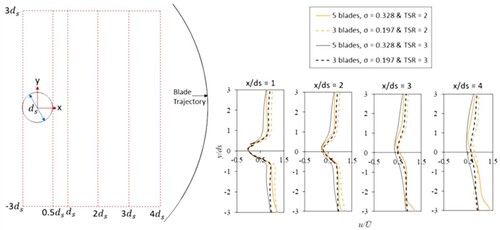
The hubs and shaft are essential parts of the turbine for fixation of the helical blades and connection with the generator. Although they do not contribute to the generation of lift force, they may have an adverse impact on the hydrodynamic performance of the turbine. The shaft diameter, ds, is taken as 52 mm in this study, which is 10% of the turbine diameter. Examination of the two-dimensional velocity field around the shaft in Figure at two sections showed that the effect of the shaft on flow velocity was minimal on the flow field inside the turbine. Where the flow met the shaft, the streamlines split and passed from both sides, leading to the creation of a wake region behind the shaft. In the shaft wake region, the flow velocity was zero, with eddies and turbulence. This wake region did not have any pronounced effect on the blades downstream of the turbine at 180° ≤ θ ≤ 360°, except in the sections near the lower and upper hubs. Near the hubs, the wake generated by the shaft would result in a reduction in the lift force in these blade sections. However, this had minimal or no effect on the total power generated by the turbine. Figure shows how the flow separation around the shaft resulted in a zero-flow region that extended to around 3.5ds from the shaft. After this distance, the flow restored its velocity before interacting with the downstream blades again. Figure shows also that the minor shaft effect on flow velocity inside the turbine was independent of the number of blades or solidity of the turbine.
Figure 14. Velocity flow field (m/s) in and around the turbine: (a) near hub; (b) middle section, for a five-blade turbine at different tip speed ratios (TSRs) and azimuth angles.
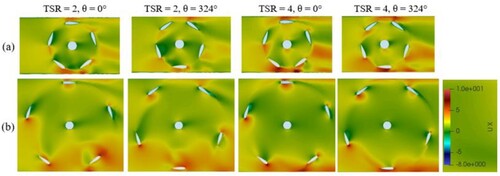
Figure 15. Normalized flow velocity at various sections downstream of the turbine shaft at the indicated locations.
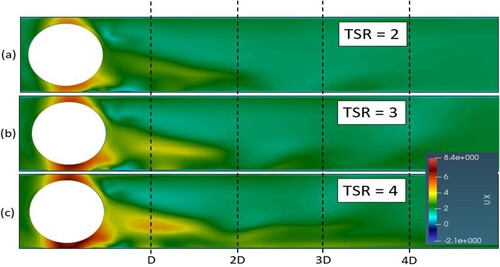
The top and bottom hubs (with diameter of 250 mm) were expected to have more pronounced effects on the turbine performance compared to the shaft owing to the increase in the drag force (Figure ). Average drag forces of 43 and 74.7 N were experienced by the turbine along various positions during one complete revolution, with variation up to 25.7% (difference between maximum and minimum), at TSRs of 2 and 4, respectively. The top and bottom hubs were expected to experience similar drag forces owing to the symmetric nature of the hubs. Minor variations were observed between the drag force on the lower and top hubs, up to 22.3% (Figure ), at some azimuth positions. This was attributed to the effect of the blades on the velocity profile near the hubs and their helical shape. At a high TSR value of 4, the average drag force experienced by the hub was more than that at a TSR value of 2. This was attributed to the increase in velocity around the hub at a high TSR, which would increase the drag, which is proportional to the second power (square) of velocity. To illustrate this argument, the velocity distribution around the hub is plotted in Figure at TSRs of 2, 3 and 4. The extent of disturbance in the velocity of flow around the hub was higher in the case of a TSR of 4 than for TSRs of 3 and 2. The velocity profile recovery occurred more rapidly in the case of a TSR of 2.
Figure 16. Drag force at different azimuth positions on the shaft, top hub and bottom hub at tip speed ratios (TSRs) of 2 and 4.
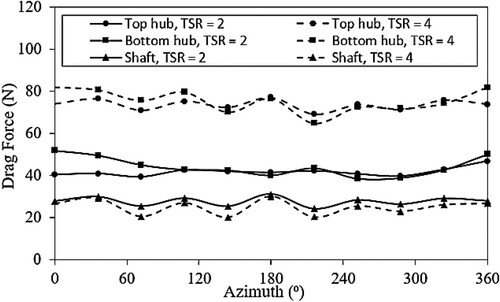
Figure 17. Velocity field (m/s) downstream of the top hub at different tip speed ratios (TSRs): (a) TSR = 2; (b) TSR = 3; (c) TSR = 4.
Conclusions
This research explored the potential of in-pipe turbines to be installed in main pipelines. A 3D numerical model, based on OpenFOAM, was utilized to investigate the performance of one of the available in-pipe water turbines, namely the lift-based helical-bladed turbine. The performance of the turbine was assessed by examining the effects of its geometric properties, such as the number of blades, chord length, helicity and pitch angle, at different TSRs on the turbine’s power, torque, torque fluctuation, efficiency and head losses. The main findings are as follows.
Owing to the spherical shape of the turbine, geometric constraints made it complicated to use more than five blades; however, adjusting the solidity via the chord length was more feasible from a design viewpoint. A five-bladed turbine produced more power (1300 W) than a three-bladed (870 W) turbine, by 50%, while all turbines (three-, four- and five-bladed) had the same efficiency (29%) at a TSR of 3. Chord length adjustment from 10% to 15% and 20% of turbine diameters resulted in power increases of 88.4% and 97.1%, respectively (with respect to 10% diameter chord length) at a TSR of 3.
Adjusting turbine helicity from 0° to 60° and 120° reduced the power by 8% and 22%, respectively (compared to 0°). Introducing a pitch angle of 3° to the blades reduced the overall efficiency by 38% regardless of the direction.
The shaft and hub generated drag force; however, the impact of the drag forces on turbine performance was minimal. Turbine stall created a wake that extended to four times the turbine diameter, beyond which the velocity profile was back to normal at a velocity of 3.5 m/s.
The pressure drop is one of the most important metrics of in-pipe turbine performance. For all simulated cases, the head drop did not exceed 1.6 m, which is equivalent to 2.7% of the total head defined inside the pipe. Head drop varied linearly with TSR and was proportional to change in solidity. On the other hand, helicity and pitch angle had minimal effects on head loss. Thus, installing in-pipe turbines would have a minimal impact on flow in a water supply network.
In conclusion, this paper presented an initial characterization of the turbine performance for limited TSRs and flow velocities. Future research will consider a wider range of TSRs and flow velocities for detailed turbine performance curves. Moreover, this study suggests a distance of four times the turbine diameter between installed turbines in series. The behavior of multiple turbines installed in series inside the pipe with different diameters will be further studied with respect to cavitation, excessive pressure drop and any possible deterioration in turbine performance.
Acknowledgments
The writers are indebted to Eng. Lobus Pirkl from CFD support, s.r.o. for his help in setting the numerical model simulations. Research has been funded by the University of Abu Dhabi, office of research.
Disclosure statement
No potential conflict of interest was reported by the authors.
Correction Statement
This article has been republished with minor changes. These changes do not impact the academic content of the article.
References
- Alemi, H., Nourbakhsh, S. A., Raisee, M., & Najafi, A. F. (2015). Effects of volute curvature on performance of a low specific-speed centrifugal pump at design and off-design conditions. Journal of Turbomachinery, 137(4), 041009. https://doi.org/10.1115/1.4028766
- Chen, J., Yang, H. X., Liu, C. P., Lau, C. H., & Lo, M. (2013). A novel vertical axis water turbine for power generation from water pipelines. Energy, 54, 184–193. https://doi.org/10.1016/j.energy.2013.01.064
- Ghalandari, M., Bornassi, S., Shamshirband, S., Mosavi, A., & Chau, K. W. (2019). Investigation of submerged structures’ flexibility on sloshing frequency using a boundary element method and finite element analysis. Engineering Applications of Computational Fluid Mechanics, 13(1), 519–528. https://doi.org/10.1080/19942060.2019.1619197
- Gorlov, A. M. (1995). The helical turbine: A new idea for low-head hydro. Hydro Review, 14(5). https://www.osti.gov/biblio/232050
- Gourdain, N. (2015). Prediction of the unsteady turbulent flow in an axial compressor stage. Part 1: Comparison of unsteady RANS and LES with experiments. Computers & Fluids, 106, 119–129. https://doi.org/10.1016/j.compfluid.2014.09.052
- Hasanzadeh, N., Payambarpour, S. A., Najafi, A. F., & Magagnato, F. (2021). Investigation of in-pipe drag-based turbine for distributed hydropower harvesting: Modeling and optimization. Journal of Cleaner Production, 298, 126710. https://doi.org/10.1016/j.jclepro.2021.126710
- Jiyun, D., Hongxing, Y., Zhicheng, S., & Xiaodong, G. (2018). Development of an inline vertical cross-flow turbine for hydropower harvesting in urban water supply pipes. Renewable Energy, 127, 386–397. https://doi.org/10.1016/j.renene.2018.04.070
- Li, S., & Li, Y. (2010, March 28–31). Numerical study on the performance effect of solidity on the straight-bladed vertical axis wind turbine. 2010 Asia-Pacific Power and Energy Engineering Conference. Presented at the 2010 Asia-Pacific Power and Energy Engineering conference (pp. 1–4). https://doi.org/10.1109/APPEEC.2010.5449269.
- Ma, T., Yang, H., Guo, X., Lou, C., Shen, Z., Chen, J., & Du, J. (2018). Development of inline hydroelectric generation system from municipal water pipelines. Energy, 144, 535–548. https://doi.org/10.1016/j.energy.2017.11.113
- Marsh, P., Ranmuthugala, D., Penesis, I., & Thomas, G. (2015). Numerical investigation of the influence of blade helicity on the performance characteristics of vertical axis tidal turbines. Renewable Energy, 81, 926–935. https://doi.org/10.1016/j.renene.2015.03.083
- OpenFOAM. (2019). www.openfoam.com.
- Purdue ECT Team. (2016). LUCIDPIPETM POWER SYSTEM. ECT Fact Sheets. https://doi.org/10.5703/1288284316353.
- Rezaeiha, A., Montazeri, H., & Blocken, B. (2018). Towards optimal aerodynamic design of vertical axis wind turbines: Impact of solidity and number of blades. Energy, 165, 1129–1148. https://doi.org/10.1016/j.energy.2018.09.192
- Roy, S., & Saha, U. K. (2013). Review on the numerical investigations into the design and development of savonius wind rotors. Renewable and Sustainable Energy Reviews, 24, 73–83. https://doi.org/10.1016/j.rser.2013.03.060
- Salih, S. Q., Aldlemy, M. S., Rasani, M. R., Ariffin, A. K., Ya, T. M. Y. S. T., Al-Ansari, N., Yaseen, Z. M., & Chau, K.-W. (2019). Thin and sharp edges bodies-fluid interaction simulation using cut-cell immersed boundary method. Engineering Applications of Computational Fluid Mechanics, 13, 860–877. https://doi.org/10.1080/19942060.2019.1652209.
- SALOME. (2019). www.salome-platform.org.
- Samora, I., Hasmatuchi, V., Münch-Alligné, C., Franca, M. J., Schleiss, A. J., & Ramos, H. M. (2016). Experimental characterization of a five blade tubular propeller turbine for pipe inline installation. Renewable Energy, 95, 356–366. https://doi.org/10.1016/j.renene.2016.04.023
- Schlabach, R. A., Cosby, M. R., Kurth, E., Palley, I., & Smith, G. (2011). In-pipe hydro-electric power system and turbine. US7959411B2.
- Tahadjodi Langroudi, A., Zare Afifi, F., Heyrani Nobari, A., & Najafi, A. F. (2020). Modeling and numerical investigation on multi-objective design improvement of a novel cross-flow lift-based turbine for in-pipe hydro energy harvesting applications. Energy Conversion and Management, 203, 112233. https://doi.org/10.1016/j.enconman.2019.112233
- Talukdar, P. K., Kulkarni, V., & Saha, U. K. (2018). Field-testing of model helical-bladed hydrokinetic turbines for small-scale power generation. Renewable Energy, 127, 158–167. https://doi.org/10.1016/j.renene.2018.04.052
- Yang, W., Hou, Y., Jia, H., Liu, B., & Xiao, R. (2019). Lift-type and drag-type hydro turbine with vertical axis for power generation from water pipelines. Energy, 188(C), 116070. https://doi.org/10.1016/j.energy.2019.116070