
 ?Mathematical formulae have been encoded as MathML and are displayed in this HTML version using MathJax in order to improve their display. Uncheck the box to turn MathJax off. This feature requires Javascript. Click on a formula to zoom.
ABSTRACT
The aerodynamic performances of aircraft change due to the ground effect for flights near the ground. The air cushion generated near the ground will change the development of the aircraft wake vortex. Researchers have compared several different ground boundary conditions with two-dimensional airfoils, while three-dimensional cases have not been studied specifically. In this study, the effects of stationary and moving wall boundary conditions on the aircraft aerodynamic characteristics and wake development were numerically investigated in three dimensions. The results showed that the stationary wall overestimated the viscous effect of the ground, resulting in a reduction of the wingtip vortex (WTV) vorticity magnitude. The difference appeared at (wingspan of the aircraft) where the secondary vortex was induced by the wingtip and horizontal tail vortex (HTV).
Introduction
Aircraft play an important role in transportation. Thus, improving the efficiency of take off and landing at airports under safe conditions has become a key issue in civil aviation. What influences the airport efficiency most is the wake flow generated by aircraft wings. There are many factors that affect wake vortex decay mechanisms, such as atmospheric turbulence, the airport ground, crosswinds, and the mutual induction of vortex systems. A following aircraft may suffer from tilt, roll, stall, sharp pitch, and other dangerous situations that affect flight safety under the influence of downwash when entering the wake region of a leading aircraft. Although the current take off and approaching interval standard (ICAO, Citation2016) avoids wake vortex hazards, the airport capacity under certain circumstances is severely limited.
The wake decay near the ground will have adverse effects on the flight safety for the following aircraft. Meanwhile, excessive vortex spacing will waste airport runway resources (Perry et al., Citation1997) (Hallock & Holzäpfel, Citation2018). The influence of the wake vortex may last for several minutes according to the existing civil aviation security standards.
Research status on wake vortex evolution
The simulation of the wake vortex flow field is a significant basis of analysis for airport safety intervals. Crow (Citation1970) made numerous observations and proposed the Crow instability based on the formation and dissipation characteristics of the wake vortices. Crow and Bate (Citation1976) concluded that the turbulent atmosphere would excite the mutual induction instability that shorten the typical lifespan of a Boeing 747 wake.
Sarpkaya (Citation2000) created a new model for vortex decay in the far field. In addition, he also described the vortex dissipation through a further experimental study based on the eddy dissipation rate instead of the turbulent kinetic energy. Proctor and Switzer (Citation2000) discovered the dissipation behaviors of wakes using the large eddy simulation method (Ghias et al., Citation2004; Han et al., Citation2000), which is an accurate, complex, and inefficient method. Gerz et al. (Citation2002) discussed the problem of commercial aircraft wake vortices. Several methodological aspects of data evaluation and interpretation have been recommended, along with vortex encounter models and wake–vortex safety assessment. Yu et al. (Citation2020) studied the influence of powered nacelles in maintaining the separation vortex. Ghalandari et al. (Citation2019) studied the flutter behavior of a typical wing. The wingtip would suffer from unstable flow conditions during the flight. However, the flutter would cause small movements of the wing relative the scale of the entire airplane. Therefore, we chose to study a model without considering flutter behaviors in our present research.
Outfield observations, wind tunnel experiments, simplified vortex models of the wake flow, and numerical simulations are the primary research methods for the evolution of vortices. Although airport measurements provide first-hand data, the complex atmospheric environment and measuring equipment with a finite resolution limit the observation accuracy. Due to the existence of the wind tunnel wall and the limitation of the length of the effective test section, wind tunnel experiments cannot meet the research requirements of long-distance wake vortex development. There is also a significant gap between wind tunnel tests and actual airport approach. However, when obtaining the details of the flow field, the accuracy of the simplified vortex model is worse than that of a real case or numerical simulations. Among the above-mentioned research methods, numerical simulations have the advantages of both accuracy and efficiency, and they are also widely adopted for fluid mechanism studies. Therefore, numerical simulations were chosen as our research method.
Research status on wing in ground effect
Careful consideration of the boundary conditions between the solid and the air is needed. For example, Salih et al. (Citation2019) studied the interactions between thin and sharp edge bodies and a fluid, which is a typical fluid–solid interaction. For our research, the height effect and the influence of the flight altitude and the wall boundary conditions are two main factors that impact the aerodynamic performance and vortex evolution of an aircraft.
Generally, the ground effect becomes nonnegligible when it is 1.5b from the ground. While the aircraft is approaching the ground, the flow forms a high-pressure air cushion between the wing and the ground, producing high lift. Originally, the existence of wingtip downwash would reduce the effective aircraft angle of attack. However, the ground prevents the downwash of the wingtip wake vortex and increases the aircraft effective angle of attack, which becomes larger than that of a high-altitude flight situation (Proctor et al., Citation2000) (Holzäpfel & Steen, Citation2007). The wake vortex will rebound when it touches the ground due to the solid boundary, and it will produce a secondary vortex that may couple with the primary vortices (Zheng & Ash, Citation1996). In addition, three-dimensional effects can lead to acceleration of the vortex dissipation compared to the two-dimensional case (Harris & Williamson, Citation2012). Zhigang and Wei (Citation2010) studied the aerodynamic performance and the flow field characteristics of a complex wing in ground effectcraft, with or without a power augmented ram engine in a cruising state. Keqin and Hideo (Citation1989) used the vortex lattice method to study the ground effect caused by the wake vortex of the lifting surface near the ground and the instability at a certain height from the ground. Qu et al. (Citation2014) studied the aerodynamics of the airfoil under the dynamic ground effect (DGE) and found that the lift under the DGE was larger than that under the static ground effect (SGE) due to the compression work effect. Lee (Citation2018) found that a tail area of about one fourth that of the main wing could satisfy the stability conditions when it was under the ground effect. Moreover, the tail should be located at a position higher than a nondimensional height based on the chord lengthto ensure controllability. Wei et al. (Citation2018) discovered the influence of artificial interference plate lines for the wake of an approaching aircraft. They also found that the plates effectively weakened the turbulent kinetic energy of the wake and significantly improved the dissipation rate of the wake strength. Moreover, Vechtel et al. (Citation2020) investigated the hazard perception of pilots during wake encounters with the ground plate lines using a flight simulator. Boschetti et al. (Citation2020) developed a general longitudinal aerodynamic model with a nondimensional height whose derivatives were a function of the height above ground, the angle of attack, and the flight path of the wing and/or flight vehicle.
In the work that conducted with the ground effect, researchers always had two main focuses: the ground influence on the aerodynamics of the aircraft and the flow development effected by the solid wall. These factors are the main points we will focus on our study.
Firooz and Gadami (Citation2006) studied a two-dimensional NACA4412 wing with fixed and moving ground conditions using the realizable k turbulence model and Spalart–Allmaras model. Hu and Ma studied an airfoil in ground proximity by moving the wavy ground surface, which caused significant fluctuations in the aerodynamics. Yang et al. (Citation2010) simulated the ground settings in a wind tunnel test section and showed the important features of the ground separation bubble upwind of the airfoil.
The aerodynamic features of compound wings were achieved for both fixed and moving ground conditions by Jamei et al. (Citation2018). Jamei et al. (Citation2014) also found that the coefficient of the lift-to-drag ratio for the compound wing is affected by the ground’s viscous effects. The boundary conditions are a significant factor for ground effect research. The model of the ground must be considered in detail for our study.
As for the stationary and moving wall, some studies have focused on configurations such as airfoils, compound wings, and wing-in-ground-effect craft. Nevertheless, unlike previous studies, we simulated a classical civil airplane and studied the vortex evolution with different wall conditions and different aircraft heights.
Contents of paper
In this paper, the A320 model is the study object. The variations of the aircraft aerodynamic characteristics and the evolution of the wake vortex as the airplane altitude or wall boundary conditions change are examined. The A320 is a typical medium jet aircraft (De Bruin, Citation2003) that is widely used for civil aviation. The commercial package we used for the fluid dynamics analysis was CFD++. Aerodynamic forces and wake development of the aircraft were studied in the quasi-steady state, along with the influence of the ground modeling, aircraft, and altitude. The second-order implicit time integration scheme was selected. In addition, the influence of the ground physical model on the calculation results is emphatically discussed. Different ground boundary conditions, moving or fixed relative to the aircraft, are discussed. The moving ground was consistent with a real scenario, and it could create remarkable features in the long wake flow field. Some vortex evolution behaviors in the near ground phase were determined.
Methodology
Considering the overall computational volume, the Reynolds-averaged Navier–Stokes (RANS) method rather than the direct numerical simulation or large eddy simulation was adopted in our study. The SST (shear stress transport) model (Menter, Citation1994) (Menter et al., Citation2003) is called the universal model of the RANS method, and it combines the features of the k-ϵ and k-ω models in flow field and eliminates some weaknesses of these models at the same time. Meanwhile, the SST model can well simulate the main shear stress due to turbulence and a few larger separated flows. Thus, the SST model was selected due to its broad applicability and low computational resource requirements.
Numerical demonstration
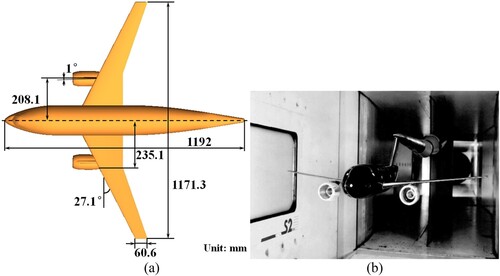
The DLR-F6 wing–body–nacelle–pylon configuration is a typical model of dual engine wide body aircraft models. It is also the standard model for drag predictions. From 1993 to 1996, aerodynamic tests were conducted with a scaled model in the ONERA S2MA pressurized wind tunnel in France. The plane size and installation mode of the test model are shown in Figure (a) and (b), where and
(Sclafani et al., Citation2007). The model reference area was S = 0.1453 m2, and the average aerodynamic chord length was c = 0.1412 m.
Figure 1. DLR-F6 test model plane size and installation method. (a) Plan view size. (b) Model and wind tunnel installation.
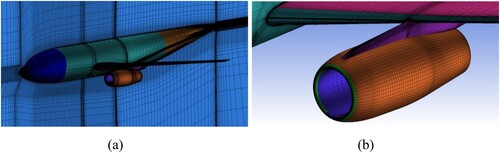
The simulation model and conditions were consistent with the experimental model and test conditions described above. Since the influence of crosswinds was not considered, a half model was adopted, and the symmetry boundary conditions was applied to save the computing resources. The mesh was an O-H structured grid with a total of about eight million grid elements. The grid is shown in Figure , in which Figure (a) is the symmetry plane grid, and Figure (b) is the grid around the nacelle.
Figure 2. DLR-F6 simulation grid. (a) Plane grid with the symmetry. (b) Grid around the nacelle.
The comparison between the calculation and experimental results is shown in Figure , including the lift, drag, and moment coefficients. The differences between the numerical and experimental data are shown in the Table . The standard deviations of the drag coefficients between 0.3 and 0.9 drag counts (1 drag count = 10−4) were measured in the experiment. is the angle of attack in degrees (°),
is the lift coefficient,
is the drag coefficient, and
is the moment coefficient. The comparison and analysis of the calculation and test results showed that the three coefficients of the simulation mentioned above were in good agreement with those of the experimental test results. This showed that the simulation method adopted in this paper could help determine the flow around the complex wing–body–nacelle–pylon configuration accurately.
Figure 3. Comparison of DLR-F6 calculation and test results. (a) Lift coefficient. (b) Drag coefficient. (c) Moment coefficient.
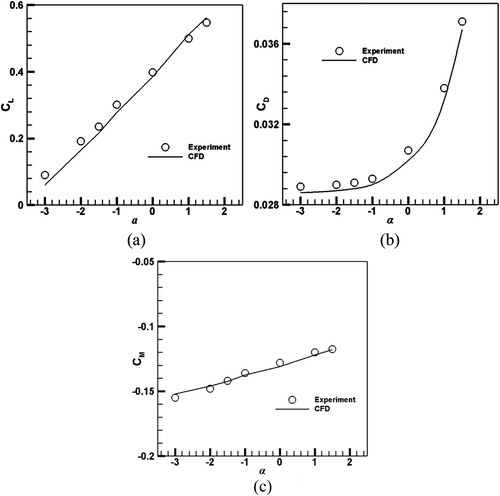
Table 1. Aerodynamic coefficient differences between experiments and simulations.
Model aircraft and boundary conditions of fluid field
A320 model
The aircraft model for the wake vortex study was a simplified aircraft A320, classified as a medium-sized aircraft according to the ‘China civil aviation air traffic management rules.' The aircraft was 37.57 m long and had a height of 11.76 m. The wingspan was 34.1 m, the sweep angle was 25°, and the fuselage was 3.95 m wide. The reference point O (0,0,0) was at the nose of the aircraft.
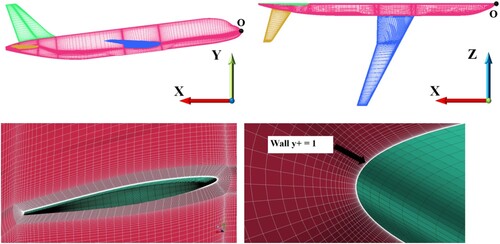
Simple structured grids of the O-H type were used to simulate the aircraft approaching state, as shown in Figure . According to the airport data, the landing speed of an A320 was about 63 m/s. The convective discrete momentum equation of the second-order upwind scheme was chosen, and the SST k-ω turbulent model was chosen as the turbulence model. All of the grids generated for the simulations satisfied y+ = 1 near the walls.
Figure 4. O-H grid with side, top boundary layers around the configuration, and boundary layer y+.
Boundary conditions
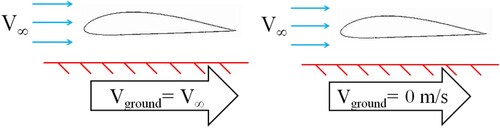
In the actual approaching phase, the relative speed between the ground and the air is 0 m/s under windless conditions. In numerical simulations, the ground is usually set as a stationary wall, which is suitable for the case when the aircraft is far from the ground and ground effects can be ignored. The ground will not prominently influence the flow around the aircraft unless they are very close. For the situation near the ground, the relative speed between the ground and the flow field must be considered. Therefore, a comparison between different ground surface conditions was conducted.
As shown in Figure , the ground boundary condition that was fixed relative to the aircraft was defined as the stationary ground (left), while the ground that had the same velocity as the flow field inlet was defined as the moving ground (right).
Figure 5. Boundary conditions for stationary ground (left) and moving ground (right).
Mesh independence demonstration
To select an applicable grid, we tested three sets of grids with eight million (abbreviated as 8M), 20 million (abbreviation as 20M), and 32 million (abbreviation as 32M) grid elements. The height of the aircraft (H) was 5 m from the ground surface in all three cases. As shown in Table , the differences between the aerodynamic performance results of these grids were small. However, the vorticity and core positions of the wake vortex were not exactly the same in these cases.
Table 2. Lift and drag coefficients of three grids.
The vorticities of the three contour graphs were almost the same for the different grids in the initial phase (Figure ). One evident difference is the vortex sheet of the horizontal tail vortex near the symmetry plane. The 8M grid could not adequately capture the vortex sheet. Moreover, the horizontal tail vortex had already dissipated at x = 7.46b due to the relatively low resolution in the 8M grid case (Figure ).
Figure 6. Vorticity contour profile x = 0.72b under the moving ground conditions (H = 5 m).
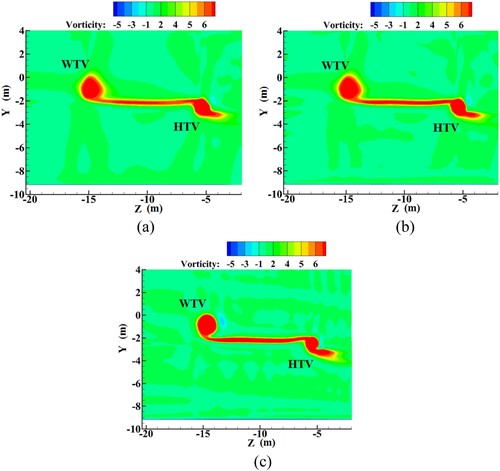
Figure 7. Vorticity contour profile x = 7.46b under the moving ground conditions with H = 5 m. (a) eight million grid elements. (b) 20 million grid elements. (c) 32 million grid elements.
The vortex core positions of most concern are displayed in Figure . The terms ‘wing' and ‘tail' in the graph legend refer to the wingtip vortex and the horizontal tail vortex, respectively. There were significant differences between the calculation results when utilizing the 8M grid and the other two grids. x, y, z, and b refer to the flow direction, vertical direction, horizontal direction, and wingspan, respectively.
Figure 8. Vortex core positions along the moving wall (H = 5 m). (a) vortex core vertical positions. (b) vortex core horizontal positions.
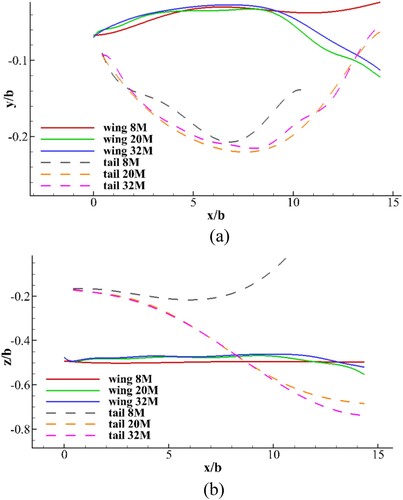
Initially, the wingtip vortex vertical trajectories of the three cases were very close. However, huge differences emerged between the coarse grid (8M) and the dense grids (20M and 32M) at a distance of 8b from the wingtip of the plane, despite their similarity in the horizontal positions. As for the data of the horizontal tail vortex positions, the result of the 20M and 43M cases were almost the same. Nevertheless, the 8M grid resulted in a completely different horizontal tail vortex trajectory, and the tail vortex quickly dissipated due to the lower resolution.
Therefore, it was concluded that the 8M grid was too coarse to resolve the aircraft wake vortex. As for the 20M and 32M grids, the distributions of the vorticity magnitude were quite similar. Both grids captured the wingtip vortex and horizontal tail vortex accurately. The initial phase of the secondary vortex induced from the ground was more evident for the case of the 20M and 32M grids than for the case of the 8M grid. However, the 32M grid required much more calculation resources, while the calculation accuracy improvement was limited. Thus, we selected the 20M grid for further study.
Based on the former results, another set of grids for H = 60 m with same minimum scale as the H = 5 m case was created. The total number of grid elements for the H = 60 m grid was 45 million.
Influence of ground boundary conditions on aerodynamic performance of aircraft
The wake vortex field formed during aircraft landing was simulated. The effects of various parameters on the aerodynamic performance and trailing vortex were compared. We tested several time steps and found that the vortex core trajectories fluctuated once the Courant–Friedrichs–Lewy (CFL) number was larger than 1. Therefore, the time step was set as 4.6 ×10⁻⁶ s to ensure the CFL number was smaller than 1.
Aerodynamic characteristics of far-ground aircraft
The lift and drag coefficients differences between the two cases with stationary and moving wall boundary conditions at a height of 60 m were only 0.5%, which were very small (). As shown in Figure , the contour images of the wing’s lower surface were similar. The influence of the ground on the surface flow field of the aircraft was considered to be very weak at this altitude.
Figure 9. Contour of aircraft with lower surface pressure for two boundary conditions (H = 60 m, unit Pa).
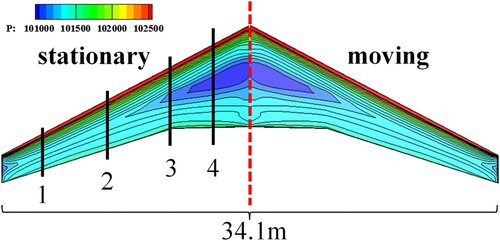
Table 3. Lift and drag coefficients for cases with stationary and moving ground (H = 60 m).
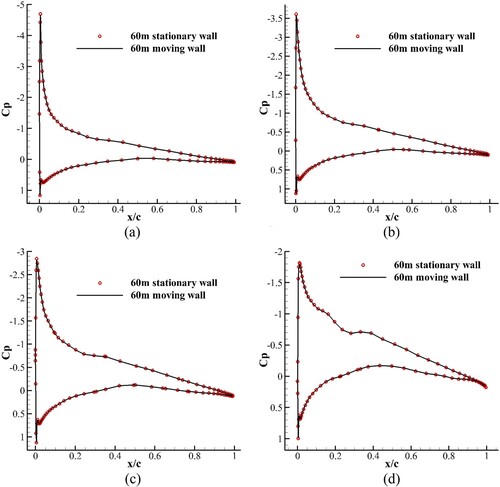
At different spanwise positions of the wing, the pressure coefficients shown in Figure were almost the same for the two cases with different kinds of ground conditions. As for the windward area of the compared cases, the atmospheric environment and other factors that affected the pressure drag and frictional drag remained basically unchanged. The settings of the wall conditions had little influence on the drag coefficient.
Figure 10. Pressure coefficient for different wingspan profiles and boundary conditions (H = 60 m). (a) Profile 1 (82.2% away from the wing root) (b) Profile 2 (59.2% away from the wing root). (c) Profile 3 (39.5% away from the wing root) (d) Profile 4 (19.7% away from the wing root).
Aerodynamic characteristics of near ground aircraft
The effect of the two wall conditions on the lift coefficient was not evident at the altitude of 5 m. According to Table , the lift coefficient decreased only by about 2% when the boundary condition changed from a stationary wall to a moving wall, and thus, it basically remained unchanged. The difference between the lower surface pressure contour and the pressure coefficients of the wing profiles at different distances from the wing root are shown in Figures and , respectively. The pressures on the lower surfaces were similar. The wing was not significantly affected by the ground model, except for the peak pressure at the leading edge of the wing. Between the two cases, the drag coefficient increased by about 15% for the peak pressure variation of the windward surface. Moreover, the pressure coefficient showed a greater difference near the wingtip (Figure (a)).
Figure 11. Contour of aircraft with lower surface pressure for different boundary conditions (H = 5 m, unit Pa). (a) Profile 1 (82.2% away from the wing root) (b) Profile 2 (59.2% away from the wing root). (c) Profile 3 (39.5% away from the wing root) (d) Profile 4 (19.7% away from the wing root).
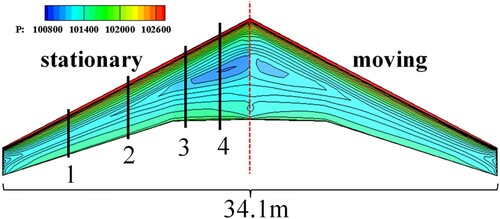
Figure 12. Pressure coefficient of different wingspan profiles for different boundary conditions (H = 5 m).
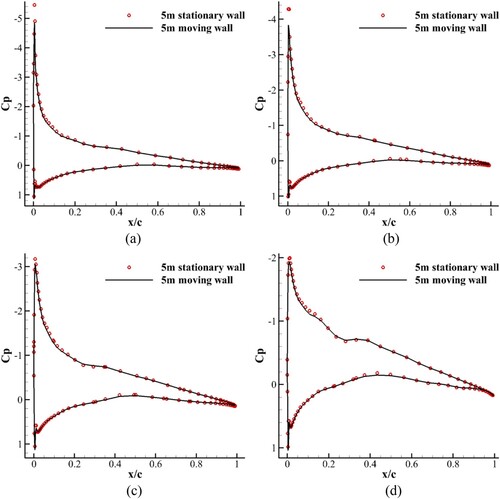
Table 4. Lift and drag coefficients of cases for stationary and moving ground (H = 5 m)
The lift coefficient of the moving wall case was smaller than that of the stationary wall case, which indicated that the stationary wall case overestimated the impact of the ground. The retardation effect of the moving wall was significantly smaller than that of the stationary wall. Therefore, the cushion effect generated by the ground effect was weakened, and it reduced the pressure between the lower surface of the aircraft and the ground, which in turn decreased the lift coefficient of the aircraft. The retardation effect of the ground reduced the airflow pressure on the windward side of the aircraft. The drag force experienced by the aircraft decreased significantly. The simulation with the moving wall was similar to the real airplane approach process.
The difference in the lift coefficient between cases 2 and 4 is shown in Table . As shown in Figure , the pressure distribution at the wingtips in the two cases for different heights were similar, while the wing root contour exhibited a significant difference. Figure demonstrates that the suction peak at a height of 5 m was larger, leading to the highest lift for the aircraft of the four coefficient pressure profile groups and the two altitudes. Moreover, the surface pressures of the upper and lower surfaces were higher at an altitude of 5 m. The closer it was to the wing root, the more evident the pressure difference was. This was the source of the lift variations of the aircraft. Furthermore, the difference in the drag between the two heights was small.
Figure 13. Contour of aircraft with lower surface pressure for moving boundary conditions (H = 5 m and H = 60 m, unit Pa).
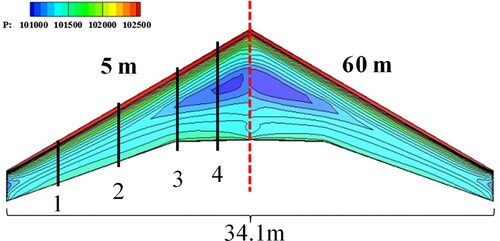
Figure 14. Pressure coefficients for different wingspan profiles with moving boundary conditions (H = 5 m and H = 60 m).
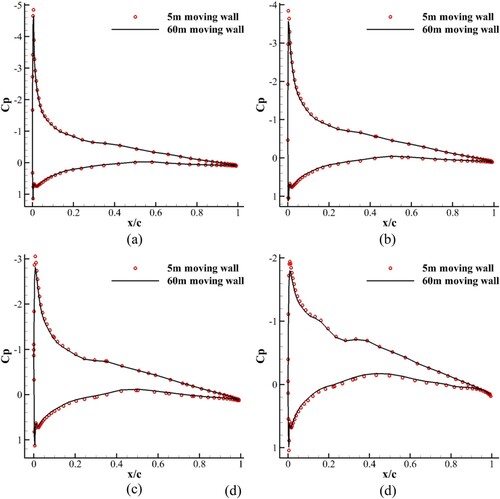
Table 5. Lift and drag coefficients of moving boundary conditions (H = 5 m and H = 60 m).
Influence of ground boundary conditions on aircraft wake vortex evolution
Wake vortex evolution of far ground aircraft
Considering the transformation of the coordinate system between the flow distance and the flow time, the wake flows in different flow field profiles were essentially equivalent to the ages of the wake vortex after generation from the aircraft. The position of maximum axial vorticity was defined as the vortex core. The vorticity vector is defined as follows:
(1)
(1)
(2)
(2)
(3)
(3) where
,
, and
are the magnitudes of the velocity components. The vorticity is
for the different profiles discussed in this paper.
Figure shows the trajectories of the wingtip vortex and the horizontal tail vortex in the vertical direction (left) and horizontal direction (right). The terms ‘moving' and ‘stationary' in the legend refer to the boundary condition type, and ‘wing’ and ‘tail' refer to the wingtip vortex and the horizontal tail vortex, respectively. This notation will be used in subsequent plots. The rotating wingtip vortex and the horizontal tail vortex were induced in the same direction to concurrently sink. The wingtip vortex (WTV) received more energy and vorticity than the horizontal tail vortex (HTV). Therefore, the downwash induced by the former vortex was more significant, and the sinking distance of the tail vortex was longer. In the horizontal direction, as shown in Figure , the two vortices gradually approached each other.
Figure 15. Vortex core vertical (left) and horizontal positions (right) of the stationary wall and the moving wall (H = 60 m).
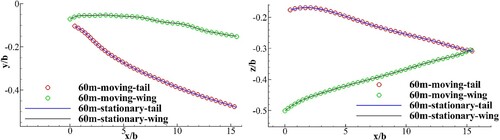
As shown in Figure , since the plane was not close enough to the ground, the development of the wake vortex was not significantly affected by the ground model. The wake structures for the different cases were similar at different positions along the flow direction.
Figure 16. Vorticity profiles of different positions along flow direction for different boundary conditions (H = 60 m, unit s−1). (a) stationary ground 60 m (left series) (b) moving ground 60 m (right series).
When the wake was far from the ground, the wingtip vortex and the horizontal tail vortex mutually affected each other, while the energy of the tail vortex dissipated very quickly. At the same time, the two vortices interacted with each other and gradually approached each other in the horizontal direction. When the plane was far from the ground, the ground seemed to have virtually no impact on the flow field around the aircraft. Therefore, the difference between the two wall models had little effect on the aircraft aerodynamic force and the near-field wake vortex.
Wake vortex evolution of near ground aircraft
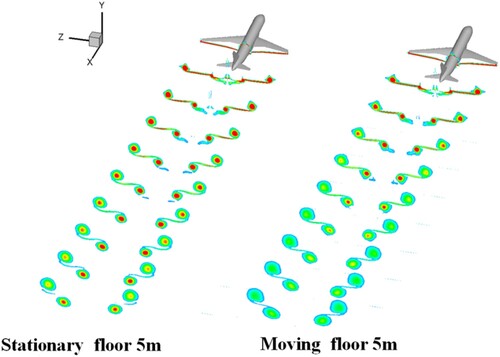
Figure shows the streamwise wake vortex development. The wingtip vortex and horizontal tail vortex generated vortex sheets behind the wing. In the initial phase, the influence of the two ground models on the wake flow development was very small, and the wake structures of the two models were almost identical. At the same time, the influence range of the wake gradually increased in the rolling-up phase. Then, the wingtip vortex and horizontal tail vortex rotated and gradually approached each other due to the influence of mutual induction. It should be noted that the wake vortex in the stationary ground case was stronger, corresponding to the larger lift coefficient shown in Table .
Figure 17. Vorticity profiles for two different boundary conditions.
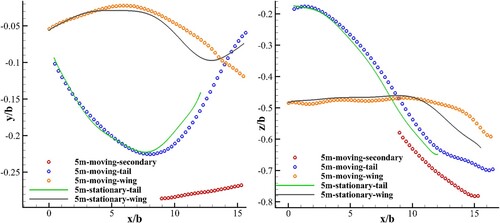
In the initial rolling-up phase, the two vortices rotating homodromously were induced by each other’s velocity fields, which caused the wingtip vortex to rise and the horizontal tail vortex to drop. Figure shows the core trajectories of different vortices. The abbreviations in the graph legend have been explained previously. The term ‘secondary' refers to the secondary vortex induced by the primary vortex. Before x/b = 7, the vortex core trajectories were very similar between the two simulations with different boundary conditions. The disparity appeared when the horizontal tail vortex began to induce the secondary vortex from the ground. The wingtip vortex was more energetic than the horizontal tail vortex, and the rising distance of the wingtip vortex was much smaller than the dropping distance of the tail vortex. When the horizontal tail vortex dropped to a certain height, it rebounded due to the impact of the ground. At the same time, the two vortices approached each other closely due to the induction by the wingtip vortex in the horizontal direction. Moreover, the results of the vertical positions exhibited a different tendency after x/b = 12.
Figure 18. Vortex core’s vertical (left) and horizontal (right) positions of the stationary and the moving walls (H = 5 m).
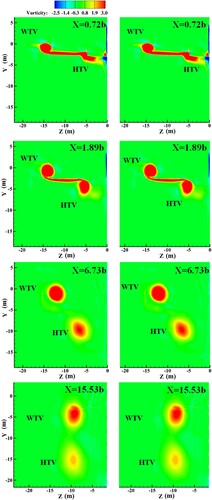
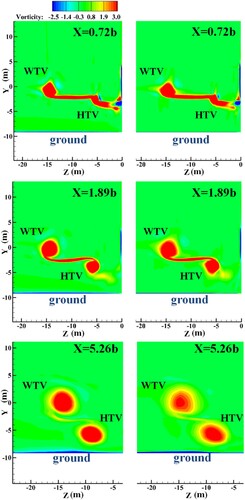
When the wake vortex descended to the ground, it induced the boundary shear layer near the ground, the shear layer separated from the ground and became a secondary vortex (Figure , x = 5.26b). Since the two vortices moved to the same position in the horizontal direction, the horizontal tail vortex caused the wingtip vortex to move in the lower right rather than the upper right direction (Figure , x = 5.26b, x = 11.86b). The vertical distance of the wingtip vortex rapidly decreased in the following phase (Figure ). Moreover, since the velocity field around horizontal tail vortex induced by the wingtip vortex changed to point to the upper left, the position of the horizontal tail vortex in the vertical direction bounced back quickly. The merging of the wing and tail vortex began early for the stationary case.
Figure 19. Vorticity profiles of different positions along flow direction for different boundary conditions (H = 5 m, unit s−1). (a) Stationary ground 5 m (left series) (b) Moving ground 5 m (right series).
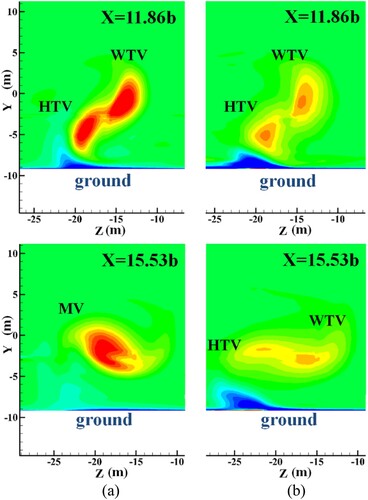
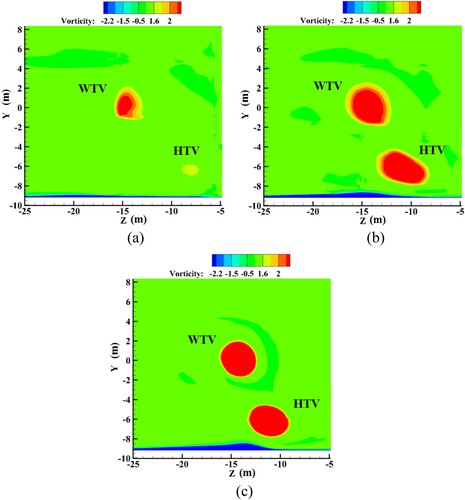
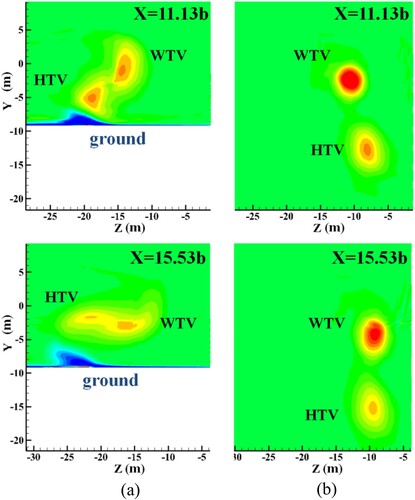
The secondary vortex could be generated strongly with moving boundary conditions (Figure , x = 11.86b, right) induced by the horizontal tail vortex. However, it could be smaller for the stationary boundary condition due to the strong retardation effect of the ground (Figure , x = 11.86b, left). It then slowly rose vertically and gradually moved away horizontally due to the horizontal tail vortex. For the lower influence by the secondary vortex under the stationary boundary condition, the vorticities of the WTV and HTV were stronger than those in the case with moving boundary conditions. As a result, the vortices merged earlier, as shown in Figure (x = 15.53b).
Moving ground condition for two different heights
Figure demonstrates the vorticity diagram of the moving ground with different flight heights of 5 and 60 m. The initial vortex evolution processes in the two cases were very similar (Figure , x = 0.72b).
Figure 20. Vorticity profiles of different positions along flow direction for moving boundary conditions (H = 5 m and H = 60 m, unit s−1). (a) Moving ground 5 m (left series) (b) Moving ground 60 m (right series).

For the H = 60 m case, the horizontal tail wake vortex that developed was barely influenced by the ground. Both the horizontal positions of the horizontal tail vortex and the wingtip vortex were closer to the symmetry plane than those in the H = 5 m case.
For the wake vortex system near the ground, the horizontal tail vortex was squeezed by the wingtip vortex and the ground, resulting in a shorter distance between the two vortices. Therefore, the horizontal tail vortex was strongly affected by the adjacent wingtip vortex and moved closer to the latter in the horizontal positions. The combination time of the two vortices was much longer for the wake vortex system with a height of 60 m because of the long distance from the ground. The ground dominantly accelerated the fusion process between the two vortices.
Conclusion
In this paper, the aerodynamic performances and wake development processes of aircraft at different altitudes were obtained by numerical simulations, different wall boundary conditions were tested, and several conclusions were drawn:
The influence of the wall boundary conditions on the aircraft aerodynamic force was very weak when the aircraft was far from the ground. However, with the decrease in the height, the difference in the aerodynamic force between the two conditions gradually became evident. Due to the reduction in the retardation effect on the air flow, the ground effect provided by the moving wall was smaller than that provided by the stationary wall. The influence of the resistance was more significant.
In the initial development phase, the wake was not significantly affected by the ground conditions. For the non-near-ground case, the horizontal tail vortex was sustained for a longer distance than that of the near ground case.
The interaction of the horizontal tail vortex and wingtip vortex increased the normal distance between them and reduced the spanwise distance.
In the case of a moving wall, the dissipation of the wake development was less than that of the stationary wall. Therefore, the vorticity generated by the moving wall was stronger, and the rotation speed was faster.
The secondary vortex vorticity near the ground was difficult to maintain due to the strong dissipation of the vorticity near the ground under the stationary wall conditions, while the secondary vortex under the moving wall conditions could maintain its own core vorticity.
Due to the limitations of the simulation, the flow fields in this paper were not sufficient for studying complete vortex evolution. To explore the differences between the two boundary conditions, it is necessary to extend the computational domain to obtain further information about the wake vortex in future work.
Disclosure statement
No potential conflict of interest was reported by the authors.
Additional information
Funding
References
- Boschetti, P. J., Cárdenas, E. M., González, P. J., & Merkl, A. (2020). Nonlinear aerodynamic model for wings in dynamic ground effect. Journal of Aircraft, 57(6), 1234–1241. https://doi.org/10.2514/1.C035853
- Crow, S. C. (1970). Stability theory for a pair of trailing vortices. AIAA Journal, 8(12), 2172–2179. https://doi.org/10.2514/3.6083
- Crow, S. C., & Bate Jr, E. R. (1976). Lifespan of trailing vortices in a turbulent atmosphere. Journal of Aircraft, 13(7), 476–482. https://doi.org/10.2514/3.44537
- De Bruin, A. C. (2003). S-wake assessment of wake vortex safety.
- Firooz, A., & Gadami, M. (2006, May). Turbulence flow for NACA 4412 in unbounded flow and ground effect with different turbulence models and two ground conditions: Fixed and moving ground conditions. In G. Lube & G. Rapin (Eds.), Conference on boundary and interior layers (Vol. 98, pp. 164–161). University of Gottingen.
- Gerz, T., Holzäpfel, F., & Darracq, D. (2002). Commercial aircraft wake vortices. Progress in Aerospace Sciences, 38(3), 181–208. https://doi.org/10.1016/S0376-0421(02)00004-0
- Ghalandari, M., Shamshirband, S., Mosavi, A., & Chau, K. W. (2019). Flutter speed estimation using presented differential quadrature method formulation. Engineering Applications of Computational Fluid Mechanics, 13(1), 804–810. https://doi.org/10.1080/19942060.2019.1627676
- Ghias, R., Mittal, R., Dong, H., & Lund, T. (2004, June 28-July 1). Large-eddy simulation of the tip flow of a rotor in hover. 34th AIAA fluid dynamics conference and exhibit, Portland, OR.
- Hallock, J. N., & Holzäpfel, F. (2018). A review of recent wake vortex research for increasing airport capacity. Progress in Aerospace Sciences, 98, 27–36. https://doi.org/10.1016/j.paerosci.2018.03.003
- Han, J., Lin, Y. L., Schowalter, D. G., Arya, S. P., & Proctor, F. H. (2000). Within homogeneous turbulence: Crow instability large eddy simulation of aircraft wake vortices. AIAA Journal, 38(2), 292–300. https://doi.org/10.2514/2.956
- Harris, D. M., & Williamson, C. H. K. (2012). Instability of secondary vortices generated by a vortex pair in ground effect. Journal of Fluid Mechanics, 700, 148–186. https://doi.org/10.1017/jfm.2012.108
- Holzäpfel, F., & Steen, M. (2007). Aircraft wake-vortex evolution in ground proximity: Analysis and parameterization. AIAA Journal, 45(1), 218–227. https://doi.org/10.2514/1.23917
- ICAO, D. (2016). Draft 2016-2030 Global Air Navigation Plan. Doc 9750-AN/963, Fifth Edition, 2016. Montreal, Canada.
- Jamei, S., Maimun, A., & Azwadi, N. (2018). Ground boundary layers effect on aerodynamic coefficients of a compound wing with respect to design parameters. Ocean Engineering, 164, 228–237. https://doi.org/10.1016/j.oceaneng.2018.06.061
- Jamei, S., Maimun, A., Azwadi, N., Tofa, M. M., Mansor, S., & Priyanto, A. (2014). Ground viscous effect on 3d flow structure of a compound wing-in-ground effect. International Journal of Automotive and Mechanical Engineering, 9, 1550. https://doi.org/10.15282/ijame.9.2013.6.0128
- Keqin, Z., & Hideo, T. (1989). Effect of ground on wake roll-up behind a lifting surface. Acta Aerodynamica Sinica, 7, 383–393.
- Lee, J. (2018). Computational analysis of static height stability and aerodynamics of vehicles with a fuselage, wing and tail in ground effect. Ocean Engineering, 168, 12–22. https://doi.org/10.1016/j.oceaneng.2018.08.051
- Menter, F. R. (1994). Two-equation eddy-viscosity turbulence models for engineering applications. AIAA Journal, 32(8), 1598–1605. https://doi.org/10.2514/3.12149
- Menter, F. R., Kuntz, M., & Langtry, R. (2003). Ten years of industrial experience with the SST turbulence model. Turbulence, Heat and Mass Transfer, 4(1), 625–632.
- Perry, R., Hinton, D., Stuever, R., Perry, R., Hinton, D., & Stuever, R. (1997, January 6–9). Nasa wake vortex research for aircraft spacing, 35th aerospace sciences meeting and exhibit, Reno, NV.
- Proctor, F., Hamilton, D., & Han, J. (2000, January 10–13). Wake vortex transport and decay in ground effect-vortex linking with the ground. 38th aerospace sciences meeting and exhibit, Reno, NV.
- Proctor, F. H., & Switzer, G. F. (2000, September). Numerical simulation of aircraft trailing vortices. In B. K. Buck (Ed.), Ninth conference on aviation, Range and Aerospace Meteorology (Vol. 470, pp. 44–51). American Meteorology Society.
- Qu, Q., Jia, X., Wang, W., Liu, P., & Agarwal, R. K. (2014). Numerical study of the aerodynamics of a NACA 4412 airfoil in dynamic ground effect. Aerospace Science and Technology, 38, 56–63. https://doi.org/10.1016/j.ast.2014.07.016
- Salih, S. Q., Aldlemy, M. S., Rasani, M. R., Ariffin, A. K., Ya, T. M. Y. S. T., Al-Ansari, N., Yaseen, Z. M., & Chau, K. W. (2019). Thin and sharp edges bodies-fluid interaction simulation using cut-cell immersed boundary method. Engineering Applications of Computational Fluid Mechanics, 13(1), 860–877. https://doi.org/10.1080/19942060.2019.1652209
- Sarpkaya, T. (2000). New model for vortex decay in the atmosphere. Journal of Aircraft, 37(1), 53–61. https://doi.org/10.2514/2.2561
- Sclafani, A., Vassberg, J., Harrison, N., DeHaan, M., Rumsey, C., Rivers, S., & Morrison, J. (2007, January). Drag prediction for the DLR-F6 wing/body and DPW wing using CFL3D and OVERFLOW on an overset mesh. In 45th AIAA aerospace sciences meeting and exhibit (p. 257).
- Vechtel, D., Stephan, A., & Holzäpfel, F. (2020). How plate lines influence the hazard perception of pilots during wake encounters. Journal of Aircraft, 57(2), 360–367. https://doi.org/10.2514/1.C035689
- Wei, Z., Li, Z., Zhuang, N., & Wen, R. (2018). Evolution mechanism of aircraft wake vortex in ground proximity with the intervention of plate-line. Journal of Wuhan University of Science and Technology, 41, 153–160.
- Yang, Z. G., Yang, W., & Jia, Q. (2010). Ground viscous effect on 2D flow of wing in ground proximity. Engineering Applications of Computational Fluid Mechanics, 4(4), 521–531. https://doi.org/10.1080/19942060.2010.11015338
- Yu, G., Li, D., & Zhang, Z. (2020). Numerical simulation for the differences between FTN/WPN engine models aerodynamic influence on BWB300 airframe. Engineering Applications of Computational Fluid Mechanics, 14(1), 566–579. https://doi.org/10.1080/19942060.2020.1733093
- Zheng, Z. C., & Ash, R. L. (1996). Study of aircraft wake vortex behavior near the ground. AIAA Journal, 34(3), 580–589. https://doi.org/10.2514/3.13107
- Zhigang, Y., & Wei, Y. (2010). Complex flow for wing-in-ground effect craft with power augmented ram engine in cruise. Chinese Journal of Aeronautics, 23(1), 1–8. https://doi.org/10.1016/S1000-9361(09)60180-1