
 ?Mathematical formulae have been encoded as MathML and are displayed in this HTML version using MathJax in order to improve their display. Uncheck the box to turn MathJax off. This feature requires Javascript. Click on a formula to zoom.
ABSTRACT
The initial space settings of suitable environments for plants strongly affect the mutual feedback evolution of the river landscape and terrestrial plants. Thus, based on the morphological characteristics of newly-defined systematic out-branching channels in nature, this study performs an effective simulation of the flow of a designed moderately curved bend with a single short branch. The practice-based channel curvatures and branch on–off conditions are controlled in ANSYS FLUENT. The results show that: (1) the core zone of the depth-averaged primary velocity excess is approximately inversely equivalent to the channel migration potential; (2) the existence of the branch can strongly promote the formation of a new core vorticity zone and the conflicting development of the inner-negative and outer-positive vorticity zone after the bifurcation site at the cross-sections; (3) the free-flowing branch can greatly diminish the downstream helical flow strength; overall, the variation tendency of the ratio of helical flow strength to discharge squared is immune to the small range of change in stable inflow; and (4) the downstream channel is a strongly erosive region with the branch outlet closed, judging by the shear stress distribution; otherwise, it is a deposition region. The findings lay the groundwork for harmonious optimization of branch and plant configurations in river-bend systems.
1. Introduction
According to their morphological characteristics and flow resistance, rivers are categorized into three main patterns: stable state of a single-thread channel, quasi-stable state of an anabranching channel, and unstable state of a braided channel (Eaton et al., Citation2010; Song & Bai, Citation2015; Xin et al., Citation2018). The common features of rivers are that the external edges of the river floodplain are smooth and simple, while the internal channel environments are complex and distributed in multiple threads. Crucially, bank resistance is one of the dominant factors in the transformation of a river pattern: (1) if the constituent materials consist largely of non-cohesive soil, a single-thread pattern is prone to degenerate into a multi-thread pattern (Song et al., Citation2016); (2) if more cohesive materials are added, the situation changes inversely, local bank collapses take longer to occur and develop towards the downstream channel, and hence interfere with the flow in the form of a slump block buffer; in particular, during the process, the meandering morphology is well maintained (Dulal & Shimizu, Citation2010); and (3) riparian vegetation has been proven to be highly effective in enhancing channel stability (Allen et al., Citation2016; Bertoldi et al., Citation2015; Gibling & Davies, Citation2012; Kobayashi & Mori, Citation2017). Against the background of the global mission to achieve carbon neutrality by 2050, the stable state of a vegetated channel is a particularly important channel morphology.
However, the roles of vegetation have always been understood in many traditionally mechanical ways within river dynamics, on the basis of pure flow velocity distribution studies in bends (Abad & Garcia, Citation2009; Esfahani & Keshavarzi, Citation2011), such as the problem of flow around cylinders (Chang et al., Citation2017; Kim et al., Citation2015; C. W. Li & Zhang, Citation2010; Liu et al., Citation2016; Tanaka & Yagisawa, Citation2010), the effects of vegetation on velocity distribution, bed topography and pollutant transportation (Azarisamani et al., Citation2020; Farzadkhoo et al., Citation2018; Ghisalberti & Nepf, Citation2006; Yan, Duan, Wai, et al., Citation2022), and the dynamic response of riparian vegetation to meteorological and hydrological conditions (Camporeale & Ridolfi, Citation2007; Gibling & Davies, Citation2012; Palmquist et al., Citation2018), but few studies have investigated the feedback effects of vegetation in the deeply biological modes, and therefore the ecological management of rivers remains underdeveloped. Taking the management of the Lower Yellow River as an example: the ecological safety of the floodplain of the world’s muddiest river has been gaining prominence in view of sustainable development in China, but for years the Lower Yellow River has basically been controlled through the negative feedback loop of ‘embankment, breach and diversion, embankment’. Most of the spatial layout of the ecological space here is anthropogenically graded and partitioned (Zhang, Citation2018; Zhang & Zhang, Citation2020), and is fatally crude owing to a lack of evolutionary support. Leading research on the coevolution of vegetation and delta channel networks by Piliouras and Kim (Citation2019) has demonstrated that the early patterns of vegetation establishment strongly affect later plant and channel development during the mutual feedback evolution of these two factors. The initial space settings that suit colonization by vegetation along the fluvial systems are fundamentally important.
A diverse array of organizational forms may exist in the interaction process of fluvial styles and plant evolution (Piliouras & Kim, Citation2019). The tendency of channels to stabilize in a meandering pattern with the growth of bank resistance raises some pertinent questions: in high-resistance situations, what would happen next when a bank-collapse ‘mutation’ occurs? Is there a possibility of innovative changes occurring in the evolution of river system under environmental pressure, as in biological evolution?
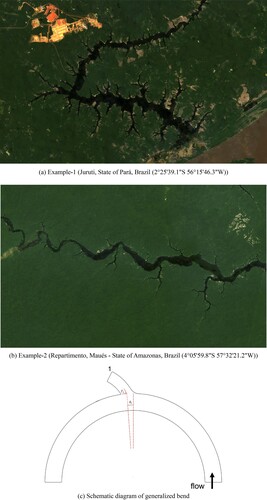
The hot and humid climate in tropical areas of the world results in very high coverage by land vegetation, and the bank resistances for river flow in these regions exceed those in the temperate mid-latitudes. Therefore, we chose to perform careful observation of tropical locations. (a) and (b) illustrates examples of novel channels in the Amazon Basin, which can be described as systematic out-branching phenomena in a high-resistance river, and which, to a certain extent, resemble innovatory biological evolution in pressure situations (Song et al., Citation2022). It is apparent that the stable and unobstructed main channel systematically interacts with the active, open and abducent branches. The overall presentation is a kind of ‘self-adapting outward development’ mode, and the river morphology and riparian vegetation are in a perfectly symbiotic state.
Figure 1. Typical river pattern with systematically outward branching characteristics. (a) Example 1: Juruti, State of Pará, Brazil (2°25′39.1″S 56°15′46.3″W); (b) example 2: Repartimento, Maués, State of Amazonas, Brazil (4°05′59.8″S 57°32′21.2″W); (c) schematic diagram of generalized bend. (Satellite images are from Google Earth.)
No previous studies have aimed to analyze the flow structures in a state of harmony between the main channel and secondary channels based on real data statistics in such systematic out-branching channel systems, to create the fundamental conditions for the integration of vegetation. The only related research has been on anabranching structures (Frias et al., Citation2015; Iwasaki et al., Citation2016; Yan, Duan, Liu, et al., Citation2022; Yang, Citation2020), but has been limited to locally specific areas. In this paper, we investigate the flow in a moderately curved bend with a single short branch, through the comparison of flow characteristics and shear stresses of four large groups of designed bend channels by controlling the practice-based geometric parameters and the branch on/off states. In terms of effectiveness, a high-order anisotropic turbulent model, the renormalization group (RNG) k-ε model, is chosen for this study.
2. Model description
2.1. Bend flow geometries and dimensions
We have collected large amounts of image data of systematic out-branching rivers at different latitudes in global terms, and conducted a statistical analysis of the typical geometric characteristics (Song et al., Citation2022). (c) shows the generalized bend diagram. Here, the bank collapse that initiated the branching development is assumed to be located at the apex, an indicator (θ1) is defined to represent the angle between the bank collapse position and the branching development center in the main-stream view, and another indicator (T1) is defined to represent the angle between the branching development direction and the tangential direction at the position of the branching development center along the bend. Thus, besides the classical width–depth–curvature information of the main channel and the short branch, we now have two more parameters (θ1, T1) to describe the river bend system.
Based on the statistical median of the parameters and combined with the physical model equipment in our laboratory (), we designed the simulation set-ups by mainly controlling the R/B parameter and the branching state, as listed in . For validation, our group (Bai et al., Citation2014) has experimentally investigated the 180° flow structures in this bend under the conditions of run B-1 in (with R/B = 3), and adequately evaluated the accuracy and efficiency of the RNG k-ε model in flow simulation of this moderately curved bend, which provides the fundamental basis for this study.
Figure 2. Experimental facility set-up in our previous research (Bai et al., Citation2014). (a) Experimental flume in reality; (b) schematic view of the channel bend.
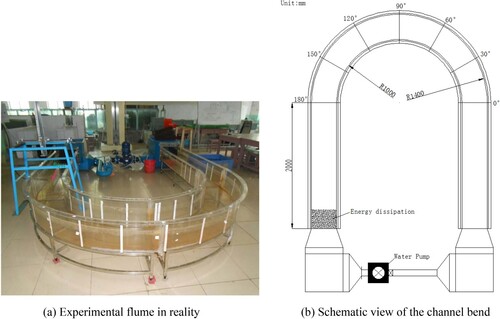
Table 1. Hydraulic parameters of the four groups of simulation runs. Subrun-1: without branch; subrun-2: with no-freeflowing branch; subrun-3: with free-flowing branch.
Traditionally, the bend would be classified as a sharp bend when R/B is less than 3, and as a mild bend otherwise, according to the literature (da Silva et al., Citation2006; Han et al., Citation2011; Keshavarzi et al., Citation2016; Van Balen et al., Citation2009), including our past research (Bai et al., Citation2014). However, after summarizing some information on the relationship between R/B and the migration rate of channels (e.g. Blanckaert, Citation2011), we now think that the critical value of R/B should not be a single and fixed value of 3, and the traditional dichotomy between the sharp and mild bend types is too absolute. So, in this study, we approximate the range of R/B from 2 to 4, around the traditionally critical value of 3, as the moderate bend type interval; then a smaller R/B corresponds to the new sharp bend type and a larger R/B corresponds to the new mild bend type. In addition, the bends in this study can be classified as outgoing bends because of the angle of attack of the flow to the banks (90°) being larger than 70°, according to researchers including da Silva et al. (Citation2006) and Hamidifar et al. (Citation2019).
2.2. Numerical method
In ANSYS FLUENT, the well-known RNG k-ε model, which is developed using RNG methods to account for the effects of smaller scales of motion by incorporating a random forcing function in the Navier–Stokes equations, was applied to conduct the simulations. Since this model can provide effective predictions for secondary fluid motion in the moderately curved bend (Bai et al., Citation2014; Han et al., Citation2011), this study can be called an ‘effective simulation’ study. The main governing equations of this model are as follows. (More detail can be found in many previous publications).
Continuity equation:
(1)
(1)
Momentum equation:
(2)
(2)
k-ε equation:
(3)
(3)
(4)
(4)
where
is the velocity averaged over time, x is the spatial geometric scale, ρ is the density of the fluid,
is the pressure,
is the kinematic viscosity,
is the velocity fluctuation over the averaging time, k and ε are the turbulent kinetic energy and the dissipation rate, respectively, and
is the eddy viscosity and is obtained from the following equation:
(5)
(5)
where the parameters
,
,
,
and
are constant and are given the standard values of 0.09, 1.44, 1.92, 1.3 and 1.0, respectively, in this study.
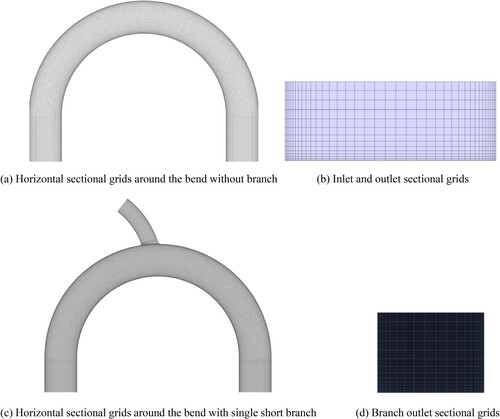
With regard to the mesh, a mixture of structured and non-uniform grids was constructed in the calculation domain (). The grid contained 400,358 hexahedral cells in total; 15 nodes along the vertical direction, 40 nodes along the transverse direction and 706 nodes along the streamwise direction in the main channel; and 20 nodes along the transverse direction and 50 nodes along the streamwise direction in the branch channel. The y+ value of the first node above the wall was basically no more than 20, and the application of scalable wall functions (ANSYS, Citation2020) could reduce unbounded errors from too small y+ values (less than 15) in the calculation of wall shear stress, by forcing the use of the log law in conjunction with the standard wall functions approach (Launder & Spalding, Citation1974). A finite volume method was used to discretize the governing equations.
Figure 3. Horizontal (left) and cross-sectional (right) view of the grids used in the simulations. (a) Horizontal sectional grids around the bend without branch; (b) inlet and outlet sectional grids; (c) horizontal sectional grids around the bend with single short branch; (d) branch outlet sectional grids.
For the rather small Froude number (Fr) conditions here, variations in the water level did not exceed 5% of the water depth in the experiments presented in our past research (Bai et al., Citation2014), and therefore we treated the free surface as a plain of symmetry (Stoesser et al., Citation2010) instead of applying a volume of fluid approach (Wang et al., Citation2020). The velocity inlet and outflow conditions were adopted in the inflow and outflow boundaries, respectively. The semi-implicit method for pressure-linked equations – consistent (SIMPLEC) was adopted for the pressure–velocity coupling at each iteration to ensure convergence and stability. The PRESTO! scheme in FLUENT (ANSYS, Citation2020) was used for the pressure interpolation. The second-order upwind scheme was chosen to discretize the momentum equations and the turbulent equations.
3. Results and analysis
3.1. Primary flow
3.1.1. Depth-averaged distribution of time-averaged primary velocities
presents plan views of the approximate depth-averaged distributions of time-averaged primary velocity (normalized with the average velocity of inflow) for different simulations at slice of Z/H = 0.6 (where Z is the vertical distance from the bed and H is the mean water depth). In subruns-1, as in previous studies (Bai et al., Citation2014; Kashyap et al., Citation2012; Stoesser et al., Citation2010; Van Balen et al., Citation2010), the distribution of primary velocities is skewed toward the inner bank in the upstream part of the bend, and then gradually shifts toward the outer bank in the downstream half of the bend. During the transition, there exists a core zone of velocity excess (precisely, where the normalized primary velocity exceeds 1.1 herein) driven by secondary flow in the center–outer region of the channel, and a zone of flow separation (normalized primary velocity ranges between 1.0 and 1.1) at the inner bank, which together promote the meander migration (Blanckaert, Citation2011; Blanckaert & de Vriend, Citation2003, Citation2010). The increase in curvature ratio (R/B) results in an obvious outer-deviation tendency of the velocity-excess core zone in the comparison among the four groups; of special note is that this zone disappears in the last quarter of the bend, where R/B = 3, in which the traditional definition of the meander migration rate is generally identified as being the highest (Kashyap et al., Citation2012; Ottevanger et al., Citation2011). In other words, the weak situation of the velocity-excess core zone and the strong situation of the river-bank migration rate (Blanckaert, Citation2011) are approximately equivalent.
Figure 4. Contours of the time-averaged primary velocity (U) normalized with the average velocity of inflow (Uave) for different simulations at the slice of Z/H = 0.6; Z = vertical distance relative to the bed. (a) Runs A-(1, 2, 3) with R/B = 2.5; (b) runs B-(1, 2, 3) with R/B = 3; (c) runs C-(1, 2, 3) with R/B = 3.5; (d) runs D-(1, 2, 3) with R/B = 4. The unit of normalized velocity is 1.
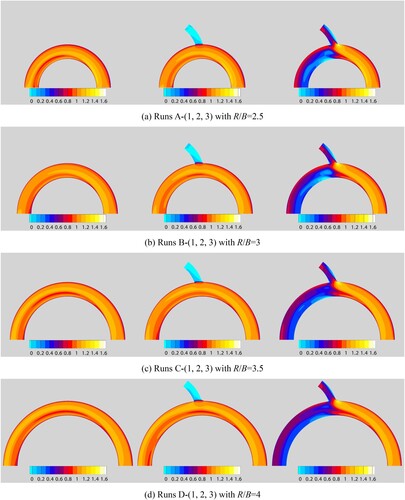
In subruns-2, the existence of the no-free-flowing branch significantly affects the corresponding velocity-excess core zone transversely. This zone is diminished owing to flow bifurcation: on the one hand, the downstream part adjusts accordingly and is enlarged, and this change increases significantly along with increases in R/B; on the other hand, almost all runs lose the velocity-excess core zone in the last quarter of the bend, and the magnitude of the loss situation decreases progressively as R/B increases, which indicates the aggravating effect of the no-free-flowing branch on meander migration in the situation of mid–low R/B (around 3). Meanwhile, in the branch, the positive velocity zone is closely linked to the inner bank maintains relatively weak development.
In subruns-3, the free-flowing branch gains more momentum from the main stream; the velocity-excess core zone is destroyed and is replaced by multi-level linkage of the small zones of velocity excess in the outer region of the upstream channel around the apex and the large zones of velocity scarcity (where normalized primary velocity is less than 0.5) in the center–inner region of the downstream channel; in particular, the flow separation zone becomes a recirculation zone near the inner bank just downstream of the bifurcation site. With the increase in R/B, the velocity-excess core zone stays similar, while the velocity-scarcity zones gradually recede. In the branch, the positive-velocity zone reaches half of the magnitude of average velocity of the inflow and escalates its presence in the center–inner space of the branch.
3.1.2. Cross-sectional distribution of time-averaged primary velocities
Figures and show sectional views of the time-averaged primary flow along the bend in the selected typical runs B and D, respectively. Special attention is paid to the areas around the apex (sections 80°, 85°, 90°, 95° and 100°) and in the downstream bend (110°, 120°, 135°, 150° and 180°).
Figure 5. Contours of the normalized time-averaged primary flow (U/Uave) at different sections along the bend in runs B, with R/B = 3 (left: subrun-1; middle: subrun-2; right: subrun-3). (a) Section 80°; (b) section 85°; (c) section 90°; (d) section 95°; (e) section 100°; (f) section 110°; (g) section 120°; (h) section 135°; (i) section 150°; (j) section 180°. Y = radial distance relative to the inner bank around the bend circle; Z = vertical distance relative to the bed. The unit of normalized velocity is 1.
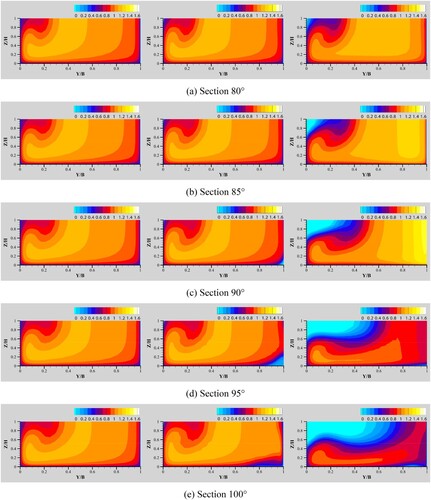
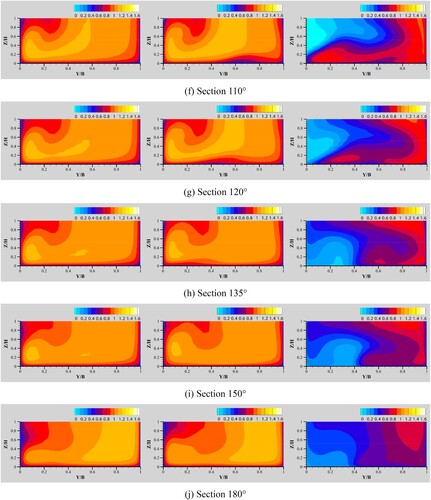
Figure 6. Contours of the normalized time-averaged primary flow (U/Uave) at different sections along the bend in runs D with R/B = 4 (left: subrun-1; middle: subrun-2; right: subrun-3). (a) Section 80°; (b) section 85°; (c) section 90°; (d) section 95°; (e) section 100°; (f) section 110°; (g) section 120°; (h) section 135°; (i) section 150°; (j) section 180°. Y = radial distance relative to the inner bank around the bend circle; Z = vertical distance relative to the bed. The unit of normalized velocity is 1.
In the comparison between subrun-2 and subrun-1, similarly for runs B and D, the velocity-excess core zones obviously shrink at sections 90°–95°, then begin to expand from section 100°, and finally regain their balance in the last quarter of the bend after breaking through the influences of the flow bifurcation. The shrinkage and expansion of the core zone around the apex in runs D are more significant than those of runs B, yet while the expansion of the former is just sustained around section 100°, the latter develops to section 120° and then almost disappears at sections 135°–150°. This demonstrates the moderate impact of the no-free-flowing branch on primary flow around the bifurcation site, and the positive significance of reduction and negative significance of reinforcement on the downstream local meander migration rate (i.e. before and after section 135°), in the situation where R/B = 3.
In subrun-3, similarly for runs B and runs D, after freeing up the flow of the branch, the velocity-excess core zone peaks at section 85°, and here, the backflow takes effect from the surface near the inner bank. As the primary flow divides significantly, the influence of the recirculation zone extends to the overall center–inner regions above the depth-averaged slice of Z/H = 0.6 at section 100°. When struggling to enter the recovery stage of primary flow after section 100°, as in subrun-2, the high-flow zone moves outwards and gradually concentrates above the slice of Z/H = 0.6 near the outer bank; meanwhile, the low-flow zone narrows inward and drops near the bed at sections 135°–150°. Especially noteworthy is that the cross-sectional average velocity has been reduced to half of the upstream value downstream of the bifurcation site (precisely, 0.09 m/s), so the core criterion of velocity excess is greater than 0.55 here for the normalized primary velocity, while the downstream velocity-excess core zones are remarkably expanded in this loose condition. Combining with the counteractive backflow near the inner bank, the overall bend migration is almost stagnating in nature. In addition, because run D incorporates a much larger velocity-excess core zone than run B under the subrun-1 conditions, here, the recirculation of the former case resulting from the same degree of flow bifurcation brought by the same branch is less significant than in the latter case.
3.2. Secondary flow
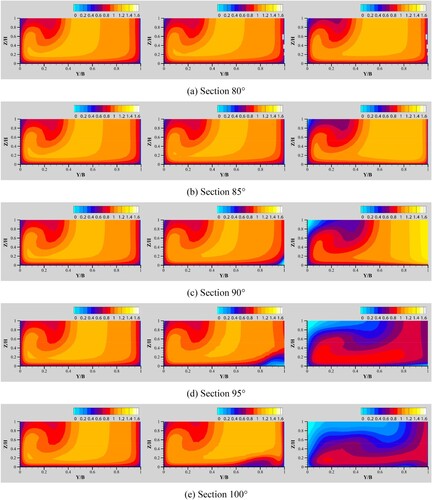
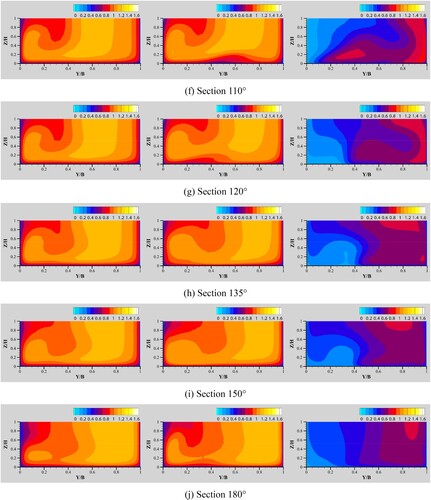
Figures and compare sectional views of the time-averaged secondary velocity and streamwise vorticity (ωs) along the bend under different branching conditions in runs B and D, respectively.
Figure 7. Velocity vectors of normalized time-averaged secondary flow (V/Uave) and contours of the time-averaged streamwise vorticity (ωs) at different sections along the bend in runs B with R/B = 3 (left: subrun-1; middle: subrun-2; right: subrun-3). (a) Section 80°; (b) section 85°; (c) section 90°; (d) section 95°; (e) section 100°; (f) section 110°; (g) section 120°; (h) section 135°; (i) section 150°; (j) section 180°. Y = radial distance relative to the inner bank around the bend circle; Z = vertical distance relative to the bed. The unit of normalized velocity is 1; the unit of vorticity is 1/s.
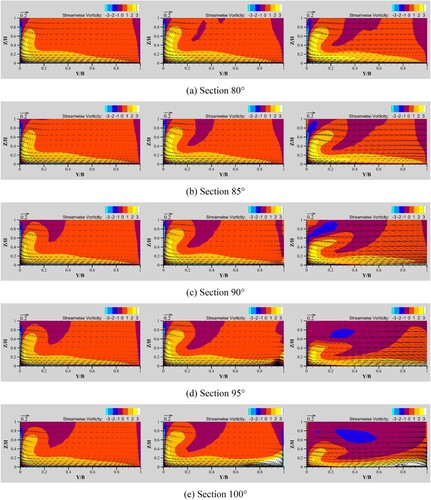
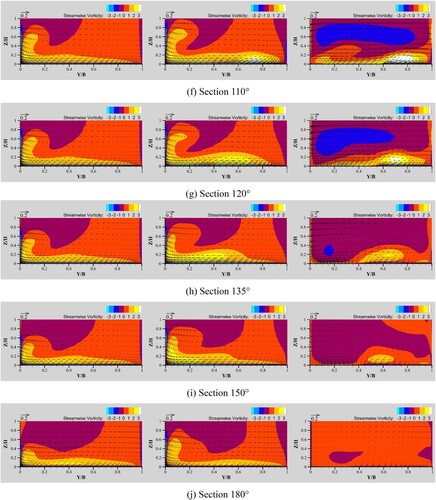
Figure 8. Velocity vectors of the normalized time-averaged secondary flow (V/Uave) and contours of the time-averaged streamwise vorticity (ωs) at different sections along the bend in runs D with R/B = 4 (left: subrun-1; middle: subrun-2; right: subrun-3). (a) Section 80°; (b) section 85°; (c) section 90°; (d) section 95°; (e) section 100°; (f) section 110°; (g) section 120°; (h) section 135°; (i) section 150°; (j) section 180°. Y = radial distance relative to the inner bank around the bend circle; Z = vertical distance relative to the bed. The unit of normalized velocity is 1; the unit of vorticity is 1/s.
3.2.1. No-free-flowing branch impacts
In runs B-2, relative to subruns-1, the existence of the no-free-flowing branch promotes a larger core vorticity zone [ωs ≥ 3 (1/s)] near the inner bank, and larger slightly negative vorticity zones [−1 ≤ ωs ≤ 0 (1/s)] around the center–inner regions (0.2 ≤ Y/B ≤ 0.5) and the outer bank, above the slice of Z/H = 0.4 before the apex (sections 80°–85°).
After the apex, at the point where the velocity-excess core zones are shrinking, as described previously (sections 90°–95°), similarly for subruns-2 and subruns-1, the core and slightly negative vorticity zones in the inner–center areas of the section steadily become offset from each other (the former decreases and the latter increases). The negative vorticity zone near the outer bank shrinks accordingly as the radial velocity increases in subruns-2 owing to flow bifurcation.
With the weakening of the influences of flow bifurcation, both of the characteristic vorticity zones on the left side and the negative vorticity zone on the right side gradually achieve stability (sections 100°–120°); simultaneously, a new core vorticity zone takes form below the slice of Z/H = 0.4 near the outer bank (section 95°), and continuously moves left (sections 100°–120°), then merges with the left core vorticity zone (section 135°), and finally almost disappears owing to the neutralization of the development of another new, slightly negative, vorticity zone from the inner bank near the surface (sections 135°–180°).
Overall, in runs D, the typically remarkable processes are similar to those of runs B, but the three characteristic vorticity zones (as described above) are weaker than in both runs B and the subrun-1 case. This demonstrates the relatively weaker influences of the branch here again.
3.2.2. Free-flowing branch impacts
The free-flowing branch releases the radial flow around the apex and intensifies the backflow at the inner bank. Therefore, a sustained development and growth of the negative vorticity zone can be found above the slice of Z/H = 0.6 near the inner bank in subruns-3, relative to subruns-2. When entering the high-impact area of flow bifurcation (after section 90°), the inner and central zones of negative vorticity have merged into one, occupying the whole region above the slice of Z/H = 0.4, and squeezed the core vorticity zone (near the inner bank) into a tiny fraction. Then, as the new core vorticity zone evolves from right to left (sections 100°–135°), the negative vorticity zone becomes weak once again. The interaction between the two contributes to the return-to-zero of vorticity at the end of the bend (section 180°). Moreover, the relationship between the impacts of the left-negative vorticity and the subsequent right-positive vorticity seems to be a conflicting one; both are less pronounced in runs D than in runs B.
In terms of the secondary velocity itself, the normalized values in subruns-2 are the same as in subruns-1, and are approximately 0.05–0.1, yet such values in subruns-3 can maintain values of about 0.2 before the end of the bend.
3.3. Helical flow strength
3.3.1. Characteristics and impacts of branching conditions
The time-averaged helical flow strength (I) along the bend can be investigated by means of the integral for helicity (ψ) at a specific section (Bai et al., Citation2014; Berger & Field, Citation1984), where ψ is defined by the dot product of the streamwise vorticity and the streamwise velocity vector (U) (Equation Equation6(6)
(6) ). Then, the ratio of I to the square of Q is adopted to measure the relative strength of the helical flow in selected sections along the bend under the different stable inflow drives in this study.
(6)
(6)
The cross-section and horizontal section situations in the four sets of runs are shown in . It can be observed from (a) that:
With no branch, overall, the helical flow strength decreases as R/B increases (in particular, the process of change in R/B from 2.5 to 3). Simultaneously, the peak location of θ retreats from about 75° to 60°. This is consistent with the traditional understanding that the helical flow will not disappear immediately near the bend exit (Bai et al., Citation2014; Q. Li et al., Citation2013); all case values herein maintain their intensity in the downstream bend.
With the no-free-flowing branch, relative to subruns-1, the helical flow strength shows variable levels of weakening around the apex and intensification after the apex. All of the curves manifest as two peaks at about θ = 65° and 98°, and a continuous trough at about θ = 90°–95°. It is noteworthy that the values of run B-2 completely exceed those of subrun-1.
With the free-flowing branch, the helical flow strength of all cases peaks at θ = 65°, sharply drops at θ = 95°, and then returns to the previously parabolic trajectory at θ = 100°. This indicates that the free-flowing branch impacts could apparently diminish the downstream helical flow strength. As R/B increases, the strength value of the four cases gradually decreases. Notably, only in run B-3 do the strength values of the upstream branch within the range of θ = 20°–80° rise beyond the values in subrun-1.
Figure 9. Relative strength of the time-averaged helical flow (I/Q2) for the four group of simulation cases with R/B = 2.5, 3, 3.5 and 4, respectively, in selected cross-sections and horizontal sections along the bend. (a) Cross-section; (b) horizontal section.
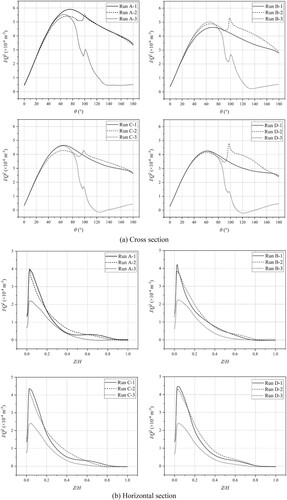
In addition, it can be seen from (b) that the horizontal helical flow strength of all cases peaks at Z/H = 0.03. In subruns-1, the peak value obviously increases with increasing R/B. When adding a no-free-flowing branch, the strength values of the middle floor (Z/H = 0.2–0.6) expand and those of the upper–lower floor shrink in runs A, C and D, while those of run B just only increase at the middle–lower floor (Z/H = 0.1–0.3) under the impacts of this branch. When unfreezing (or, releasing) the flow of the branch, the strength curves differ very little among the four cases; the strength values become much smaller than in subruns-1 and subruns-2 overall, and are reduced by almost half around the peak location (Z/H = 0.03).
In brief, the free-flowing branch can diminish substantially the downstream cross-sectional helical flow and the horizontal-sectional helical flow near the bed. In the situation where R/B = 3, both branching conditions result in stronger cross-sectional helical flow in the upstream bend; in particular, the no-free-flowing branch increases the overall helical flow level along the bend.
3.3.2. Impacts of discharge conditions
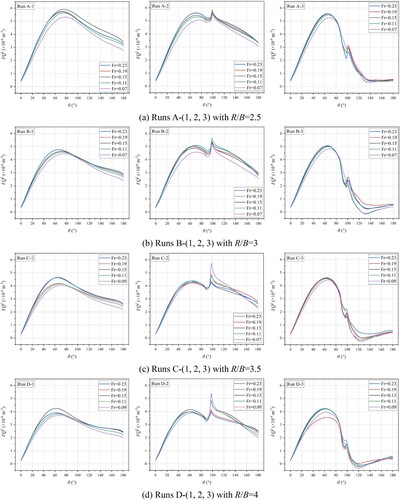
The branch has a remarkable impact on the cross-sectional strength of the helical flow along the bend. To investigate the comprehensive response of such impacts on different stable inflows, we conducted several additional calculation cases under other different discharge conditions around the center of Fr = 0.15 (where Fr refers to the Froude number upstream of the bifurcation site, as calculated using the water depth and average velocity of inflow), as shown in . Clearly, the variational tendencies of the ratio of helical flow strength to discharge squared (I/Q2) are stable; the focused special information on the branching impacts (Section 3.3.1) is immune to the small range of change in stable inflow. However, the response mode of the curve itself to the variation in discharge also has uncertainty. Compared with the center baselines, in subruns-1, almost all of the curve values decrease as the Fr moves away from 0.15, but in run B, the larger Fr naturally leads to the rising of the curve. In subruns-2 and subruns-3, conclusive relationships are difficult to find under the branching disturbances.
Figure 10. Relative strength of the time-averaged helical flow (I/Q2) for the different cases in selected cross-sections along the bend under different discharge conditions. (a) Runs A-(1, 2, 3) with R/B = 2.5; (b) runs B-(1, 2, 3) with R/B = 3; (c) runs C-(1, 2, 3) with R/B = 3.5; (d) runs D-(1, 2, 3) with R/B = 4.
3.4. Shear stress
The bed and side-wall shear stresses at the bend are computed using the wall laws (Bai et al., Citation2014; Olsen, Citation2007):
(7)
(7)
(8)
(8)
where U+ is the shear velocity, y is the distance from the wall, and ks is the wall roughness.
presents the distributions of the normalized time-averaged wall shear stresses in the bends of runs B. At the inner bank, there exists a diagonal slash between θ = 0° and θ = 40°, which divides the main stress partition around the critical section, θ = 40°. In subrun-1, the major bed shear stresses continuously concentrate near the inner bank within the range of θ = 40°–180°, and the outer bank stresses increase gradually and evenly along the bend at the same time.
Figure 11. Distributions of the time-averaged bed and side-wall stresses (τ) by normalization with the density times the average velocity of inflow squared (ρUave2) along the bend for the three different subcases in runs B with R/B = 3 (left: bed; middle: outer bank; right: inner bank). (a) Subrun-1; (b) subrun-2; (c) subrun-3. The unit of normalized τ is 10−3.
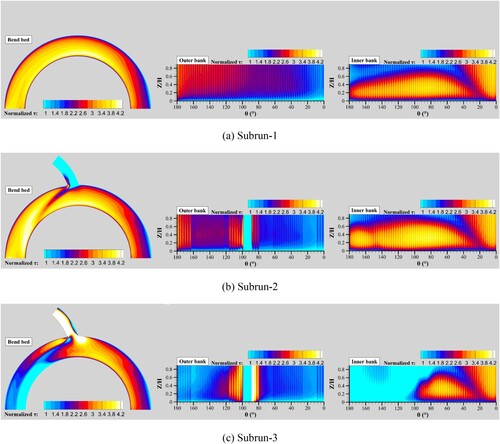
When spliting out a branch at the outer bank, in subrun-2, the outer bank stresses turn to concentrate around the bifurcation position in the range θ = 80°–120°, the sphere of influence of which reaches to about 160° downstream (see the middle subfigure). The region of major bed shear stresses is segmented into an apex zone near the inner bank and a downstream inner–center zone (see the left subfigure). As a result of this effect, a mild division of inner bank stresses appears at about θ = 150° (see the right subfigure). These phenomena correspond to the cross-sectional primary velocity analysis and the relevant judgments of the positive significance of reduction and negative significance of reinforcement on the meander migration rate before and after section θ = 135° (see Section 3.1.2).
After liberating the flow of the branch, in subrun-3, the outer bank stresses become highly centralized around the bifurcation site; in particular, the ultra-strong influence of which has greatly diminished the downstream bed shear stresses and contributed an ultralow stress belt in the inner–center zone of the last quarter of the bend. Simultaneously, the inner bank loses almost all shear stresses after the bifurcation location of θ = 100°. The downstream bend is changed to a strong sediment–deposition region.
4. Discussion
The systematic out-branching river pattern brings a new perspective to observations on river morphology. To explore the interactive relationships of the main stream and closely connected branches, we established a channel bend model with single short branch based on geometric parameters from real-world statistics. The analysis of the presence of the branch and its impacts on mobility are very important in order to understand the forward evolution of the river system and improve the ecological activity of river environments in the future.
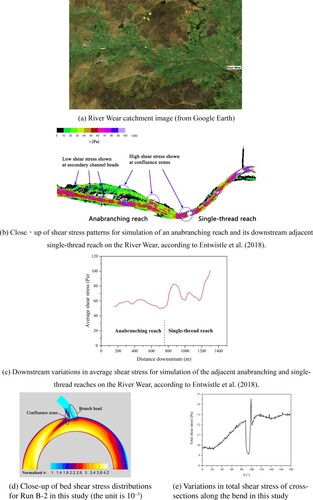
Branching sites and their topographies dominate the flood flow distribution and secondary channel activations. We agree with Entwistle et al. (Citation2018) that controlled branching rivers could play vital roles in natural water-sediment management. As shown in (a) and (b), they investigated the energy regime of an anabranching system of the River Wear, UK, and made numerical comparisons of shear stresses between the anabranching reach and its downstream single-thread reach: as the flow energy dissipated along the channel system, shear stresses tended to be low at the branch head and became high at the downstream confluence zone; in particular, the maximum shear stresses concentrated at the single-thread reach. The no-free-flowing branch condition of our study is like such an anabranching case to some extent: as indicated in (d), the bed shear stress of run B-2 has similar distribution characteristics in the branch head, confluence zone and the downstream areas which are far away from the branching site. Also, when escaping the branching impacts, the uprush of cross-sectional shear stress is a common feature (see c at x-coordinate = 850 m and e at x-coordinate = 100°). Naturally, the sediment transport and bed–bank erosion are more prevalent throughout the downstream single-thread reach. The rationality of our analysis on primary velocities in Section 3.1 has also been demonstrated through these findings.
Figure 12. Comparisons of the shear stress distributions before and after the intersection positions of channels, between the simulations of Entwistle et al. (Citation2018) and our simulations. (a) River Wear catchment image (from Google Earth); (b) close-up of shear stress patterns for simulation of an anabranching reach and its downstream adjacent single-thread reach on the River Wear, according to Entwistle et al. (Citation2018); (c) downstream variations in average shear stress for simulation of the adjacent anabranching and single-thread reaches on the River Wear, according to Entwistle et al. (Citation2018); (d) close-up of bed shear stress distributions for Run B-2 in this study (the unit is 10−3); (e) variations in total shear stress of cross-sections along the bend in this study.
As early as the 1990s, Sear et al. (Citation1995) conducted field investigations on the study reach of Entwistle et al. (Citation2018) and gathered evidence of the history of channel developments and the influence of controlling processes of branches. Many secondary channels could only be activated by flood discharge and were otherwise maintained within residual isolated pools for most of the year; their behaviors happen to match an intermediate transition state between the no-free-flowing branching system and the free-flowing branching system in our study. The common woody debris in the secondary channels formed stable features after years of evolution and gradually exerted controlling effects on the channel system development; in contrast, there appeared only a thin and disrupted woody riparian strip in the downstream single-thread channel owing to the overlarge bank erosion. Coarse sands spread over the river system, and were combined into some functioning riffle and bar units in secondary channels driven by flood flow; fine sediment was found to accumulate in the bed and banks as consolidated deposits (Sear et al., Citation1995). The riparian zones organically promote the strong connectivity between the primary channel and branching channel region during the process of adapting to various water and sediment inputs. Rivers could thus become a perfect self-adapting system through optimization of the branch and plant configuration.
Many researchers have analyzed the relative equilibrium configurations of bifurcations by accounting for the adjustments of river–floodplain characteristic parameters (such as channel widths, channel curvatures, riverbed gradient, sediment particles and riparian vegetation) on flow discharge in gravel-dominated rivers (Burge, Citation2006; Frias et al., Citation2015; Iwasaki et al., Citation2016; Miori et al., Citation2006; Yang, Citation2020). The stable configurations are generally accepted to be asymmetrical: one of the branches is fed with greater water and sediment discharges; and an inlet step, which is representative of the transverse bottom inclination that is responsible for the flow and bed load distributions, establishes at the intersection of the two channels. (Similarly, see c, left, for the cascade change of bed shear stresses toward the branch side among the cross-sections of θ = 80°–95°.) With regard to the colonization of riparian vegetation, a braided channel could even progress to a single-thread channel and maintain moderate sinuosity (as in our study, the critical curvature ratio of R/B is reported to be 2.0–3.3 by Yang, Citation2020); that is, the formation of a quasi-equilibrium anabranching channel. However, the mutual interactions between physical and ecological processes within the anabranching system still lack full knowledge and understanding.
Our research is very consistent with the above anabranching river studies in terms of the geometric characteristics and physical processes of the channel system. The key difference here is the consideration of forward biological evolution, and especially the co-evolution of physical processes and ecological processes based on an anabranching river. From our perspective, through its own evolution, vegetation could not only stabilize the tendency for multi-thread development inside the smooth and single-thread edges of the river floodplain, but also promote the stabilized system to break through such edges and grow outward into an organic river system, like the relations of tree trunk and branches in trees or arthropodous trunk and appendages in anthropods. To improve the river management and address channel flow with a hyper-concentration of sediment, as in the Lower Yellow River, in our research series, branch configuration studies in a moderately curved 180° bend, as in this study, is just the first phase; the second phase, of plant configuration studies, and the third phase, of systematic co-evolution studies of the river environment, have already been arranged.
Nevertheless, Reynolds-averaged Navier–Stokes models usually overpredict the bed shear stresses near the inner bank of the bend apex (on average by about 20%) and the middle of the channel, and are also unable to capture the persistence of outer-bank secondary cells (precisely, the residual of the main secondary cell of the previous bend) until the exit of the bend (Blackaert & de Vriend, Citation2004; Ottevanger et al., Citation2011; Stoesser et al., Citation2010). Therefore, the real channel migrations will be weaker than the effective simulations presented in this study, and river management on the basis of our results will be conservative enough.
5. Conclusions
The branching character systematically manages flow energy dissipation and shear stress actions along the moderately curved bend, and has the potential to help create a dynamically stable environment for vegetation growth in the form of systematic out-branching channels. In this effective simulation study of a practice-based generalized main-branch flow, the impacts of the existence and flow conditions of the branch were found to contrast with each other, and are distinguished by the various distributions of the time-averaged velocity-excess core zone, vorticity zone, helical flow strength and erosive potential downstream of the branching site. The most noteworthy conclusions from this study are as follows:
The velocity-excess core zone of depth-averaged primary velocity distribution and the bank migration potential are approximately inversely equivalent to each other.
The existence of a branch can significantly complicate the secondary flow of the main channel, promoting the formation of a new core vorticity zone, and the conflicting development of the negative vorticity zone near the left inner bank and the positive vorticity zone near the right outer bank at the cross-sections along the bend downstream of the bifurcation site.
The combined effects of the open developed branch flow and counteractive backflow near the inner bank can make the overall main-channel migrations completely inactive, especially in the situation of the critical curvature ratio of R/B = 3.
Whether or not it is freely flowing, the branch can lead to the significant intensification of the cross-sectional helical flow strength along the bend upstream of the bifurcation site overall in the critical situation of R/B = 3, relative to the no-branch case.
The branch can cause the shear stress distribution to greatly concentrate around the bifurcation site, and result in the distributions of the relatively low-value zone at the branch head and the relatively high-value zone at the confluence zone when the branch is in a static state.
Based on actual statistics, this study provides a foundational support for flow space settings for harmoniously optimizing the branch–plant configurations and establishing the perfect self-adapting vegetated river system. Starting from the fixed-bed flow study in this article, besides the improvement of the CFD code (e.g. LES), in the future, to advance the movable-bed evolutionary research on the systematic out-branching rivers, the key point would be to upgrade the mechanism of vegetated-bank collapse under the complicated and changeable inflow conditions, by incorporating some mutation processes similar to those found in biological evolution.
Acknowledgments
The authors acknowledge support from the Open Research Fund of Key Laboratory of Hydro-Sediment Science and River Training, the Ministry of Water Resources, China Institute of Water Resources and Hydropower Research and the National Natural Science Foundation of China.
Disclosure statement
No potential conflict of interest was reported by the authors.
Correction Statement
This article has been republished with minor changes. These changes do not impact the academic content of the article.
Additional information
Funding
References
- Abad, J. D., & Garcia, M. H. (2009). Experiments in a high-amplitude Kinoshita meandering channel: 1. Implications of bend orientation on mean and turbulent flow structure. Water Resources Research, 45(2), W02401. https://doi.org/10.1029/2008WR007016
- Allen, D. C., Cardinale, B. J., & Wynn-Thompson, T. (2016). Plant biodiversity effects in reducing fluvial erosion are limited to low species richness. Ecology, 97(1), 17–24. https://doi.org/10.1890/15-0800.1
- ANSYS. (2020). ANSYS FLUENT theory guide (2020R2). ANSYS Inc.
- Azarisamani, A., Keshavarzi, A., Hamidifar, H., & Javan, M. (2020). Effect of rigid vegetation on velocity distribution and bed topography in a meandering river with a sloping bank. Arabian Journal for Science and Engineering, 45(10), 8633–8653. https://doi.org/10.1007/s13369-020-04818-7
- Bai, Y. C., Song, X. L., & Gao, S. X. (2014). Efficient investigation on fully developed flow in a mildly curved 180° open-channel. Journal of Hydroinformatics, 16(6), 1250–1264. https://doi.org/10.2166/hydro.2014.108
- Berger, M. A., & Field, G. B. (1984). The topological properties of magnetic helicity. Journal of Fluid Mechanics, 147(-1), 133–148. https://doi.org/10.1017/S0022112084002019
- Bertoldi, W., Welber, M., Gurnell, A. M., Mao, L., Comiti, F., & Tal, M. (2015). Physical modelling of the combined effect of vegetation and wood on river morphology. Geomorphology, 246, 178–187. https://doi.org/10.1016/j.geomorph.2015.05.038
- Blackaert, K., & de Vriend, H. J. (2004). Secondary flow in sharp open-channel bends. Journal of Fluid Mechanics, 498, 353–380. https://doi.org/10.1017/S0022112003006979
- Blanckaert, K. (2011). Hydrodynamic processes in sharp meander bends and their morphological implications. Journal of Geophysical Research: Earth Surface, 116, F01003. https://doi.org/10.1029/2010JF001806
- Blanckaert, K., & de Vriend, H. J. (2003). Nonlinear modeling of mean flow redistribution in curved open channels. Water Resources Research, 39(12), 1375. https://doi.org/10.1029/2003WR002068
- Blanckaert, K., & de Vriend, H. J. (2010). Meander dynamics: A nonlinear model without curvature restrictions for flow in open-channel bends. Journal of Geophysical Research: Earth Surface, 115, F04011. https://doi.org/10.1029/2009JF001301
- Burge, L. M. (2006). Stability, morphology and surface grain size patterns of channel bifurcation in gravel–cobble bedded anabranching rivers. Earth Surface Processes and Landforms, 31(10), 1211–1226. https://doi.org/10.1002/esp.1325
- Camporeale, C., & Ridolfi, L. (2007). Noise-induced phenomena in riparian vegetation dynamics. Geophysical Research Letters, 34, L18406. https://doi.org/10.1029/2007GL030899
- Chang, W. Y., Constantinescu, G., & Tsai, W. F. (2017). On the flow and coherent structures generated by a circular array of rigid emerged cylinders placed in an open channel with flat and deformed bed. Journal of Fluid Mechanics, 831, 1–40. https://doi.org/10.1017/jfm.2017.558
- da Silva, A. M. F., El-Tahawy, T., & Tape, W. D. (2006). Variation of flow pattern with sinuosity in sine-generated meandering streams. Journal of Hydraulic Engineering, 132(10), 1003–1014. https://doi.org/10.1061/(ASCE)0733-9429(2006)132:10(1003)
- Dulal, K. P., & Shimizu, Y. (2010). Experimental simulation of meandering in clay mixed sediments. Journal of Hydro-Environment Research, 4(4), 329–343. https://doi.org/10.1016/j.jher.2010.05.001
- Eaton, B. C., Millar, R. G., & Davidson, R. (2010). Channel patterns: Braided, anabranching, and single-thread. Geomorphology, 120(3-4), 353–364. https://doi.org/10.1016/j.geomorph.2010.04.010
- Entwistle, N., Heritage, G., & Milan, D. (2018). Flood energy dissipation in anabranching channels. River Research and Applications, 34(7), 709–720. https://doi.org/10.1002/rra.3299
- Esfahani, F. S., & Keshavarzi, A. (2011). Effect of different meander curvatures on spatial variation of coherent turbulent flow structure inside ingoing multi-bend river meanders. Stochastic Environmental Research and Risk Assessment, 25(7), 913–928. https://doi.org/10.1007/s00477-011-0506-4
- Farzadkhoo, M., Keshavarzi, A., Hamidifar, H., & Javan, M. (2018). A comparative study of longitudinal dispersion models in rigid vegetated compound meandering channels. Journal of Environmental Management, 217, 78–89. https://doi.org/10.1016/j.jenvman.2018.03.084
- Frias, C. E., Abad, J. D., Mendoza, A., Paredes, J., Ortals, C., & Montoro, H. (2015). Planform evolution of two anabranching structures in the upper Peruvian Amazon river. Water Resources Research, 51(4), 2742–2759. https://doi.org/10.1002/2014WR015836
- Ghisalberti, M., & Nepf, H. (2006). The structure of the shear layer in flows over rigid and flexible canopies. Environmental Fluid Mechanics, 6(3), 277–301. https://doi.org/10.1007/s10652-006-0002-4
- Gibling, M. R., & Davies, N. S. (2012). Palaeozoic landscapes shaped by plant evolution. Nature Geoscience, 5(2), 99–105. https://doi.org/10.1038/ngeo1376
- Hamidifar, H., Keshavarzi, A., & Rowiński, P. M. (2019). Influence of rigid emerged vegetation in a channel bend on bed topography and flow velocity field: Laboratory experiments. Water, 12(1), 118. https://doi.org/10.3390/w12010118
- Han, S. S., Biron, P. M., & Ramamurthy, A. S. (2011). Three-dimensional modelling of flow in sharp open-channel bends with vanes. Journal of Hydraulic Research, 49(1), 64–72. https://doi.org/10.1080/00221686.2010.534275
- Iwasaki, T., Shimizu, Y., & Kimura, I. (2016). Numerical simulation of bar and bank erosion in a vegetated floodplain: A case study in the Otofuke River. Advances in Water Resources, 93, 118–134. https://doi.org/10.1016/j.advwatres.2015.02.001
- Kashyap, S., Constantinescu, G., Rennie, C. D., Post, G., & Townsend, R. (2012). Influence of channel aspect ratio and curvature on flow, secondary circulation, and bed shear stress in a rectangular channel bend. Journal of Hydraulic Engineering, 128(12), 1045–1059. https://doi.org/10.1061/(ASCE)HY.1943-7900.0000643
- Keshavarzi, A., Hamidifar, H., & Ball, J. (2016). Bed morphology in vegetated estuarine river with mild-curved meander bend. Hydrological Sciences Journal, 61(11), 2033–2049. https://doi.org/10.1080/02626667.2015.1081201
- Kim, H. S., Nabi, M., Kimura, I., & Shimizu, Y. (2015). Computational modeling of flow and morphodynamics through rigid-emergent vegetation. Advances in Water Resources, 84, 64–86. https://doi.org/10.1016/j.advwatres.2015.07.020
- Kobayashi, Y., & Mori, A. S. (2017). The potential role of tree diversity in reducing shallow landslide Risk [article]. Environmental Management, 59(5), 807–815. https://doi.org/10.1007/s00267-017-0820-9
- Launder, B. E., & Spalding, D. B. (1974). The numerical computation of turbulent flows. Computer Methods in Applied Mechanics and Engineering, 3(2), 269–289. https://doi.org/10.1016/0045-7825(74)90029-2
- Li, C. W., & Zhang, M. L. (2010). Numerical modeling of shallow water flow around arrays of emerged cylinders. Journal of Hydro-Environment Research, 4(2), 115–121. https://doi.org/10.1016/j.jher.2010.04.005
- Li, Q., Song, J. F., Li, C., Wei, Y. D., & Chen, J. Y. (2013). Numerical and experimental study of particle deposition on inner wall of 180° bend. Powder Technology, 237, 241–254. https://doi.org/10.1016/j.powtec.2012.11.008
- Liu, D., Zheng, Y. L., & Chen, Q. (2016). Simulation of flow around rigid vegetation stems with a fast method of high accuracy. Journal of Fluids and Structures, 63, 1–15. https://doi.org/10.1016/j.jfluidstructs.2016.02.006
- Miori, S., Repetto, R., & Tubino, M. (2006). A one-dimensional model of bifurcations in gravel bed channels with erodible banks. Water Resources Research, 42(11), W11413. https://doi.org/10.1029/2006WR004863
- Olsen, N. R. B. (2007). A three dimensional numerical model for simulation of sediment movements in water intakes with multiblock option, User's manual. Norwegian Univ. of Science and Technology.
- Ottevanger, W., Blanckaert, K., & Uijttewaal, W. S. J. (2011). A parameter study on bank shear stresses in curved open channel flow by means of large-eddy simulation. Proceedings of the 7th IAHR symposium on river, coastal and estuarine morphodynamics (RCEM2011), Beijing.
- Palmquist, E. C., Ralston, B. E., Merritt, D. M., & Shafroth, P. B. (2018). Landscape-scale processes influence riparian plant composition along a regulated river. Journal of Arid Environments, 148, 54–64. https://doi.org/10.1016/j.jaridenv.2017.10.001
- Piliouras, A., & Kim, W. (2019). Upstream and downstream boundary conditions control the physical and biological development of river deltas. Geophysical Research Letters, 46(20), 11188–11196. https://doi.org/10.1029/2019GL084045
- Sear, D. A., Newson, M. D., & Brookes, A. (1995). Sediment-related river maintenance: The role of fluvial geomorphology. Earth Surface Processes & Landforms, 20(7), 629–647. https://doi.org/10.1002/esp.3290200706
- Song, X. L., & Bai, Y. C. (2015). A new empirical river pattern discriminant method based on flow resistance characteristics. Catena, 135, 163–172. https://doi.org/10.1016/j.catena.2015.07.026
- Song, X. L., Xu, G. Q., Bai, Y. C., & Xu, D. (2016). Experiments on the short-term development of sine-generated meandering rivers. Journal of Hydro-Environment Research, 11, 42–58. https://doi.org/10.1016/j.jher.2016.01.004
- Song, X. L., Xu, H. J., & Bai, Y. C. (2022). The systematic out-branching (dragon style) rivers under the perspective of connection between river morphology and ecology. Ecohydrology & Hydrobiology, https://doi.org/10.1016/j.ecohyd.2022.05.003
- Stoesser, T., Ruether, N., & Olsen, N. R. B. (2010). Calculation of primary and secondary flow and boundary shear stresses in a meandering channel. Advances in Water Resources, 33(2), 158–170. https://doi.org/10.1016/j.advwatres.2009.11.001
- Tanaka, N., & Yagisawa, J. (2010). Flow structures and sedimentation characteristics around clump-type vegetation. Journal of Hydro-Environment Research, 4(1), 15–25. https://doi.org/10.1016/j.jher.2009.11.002
- Van Balen, W., Uijttewaal, W. S., & Blanckaert, K. (2009). Large-eddy simulation of a mildly curved open-channel flow. Journal of Fluid Mechanics, 630, 413–442. https://doi.org/10.1017/S0022112009007277
- Van Balen, W., Uijttewaal, W. S. J., & Blanckaert, K. (2010). Large-eddy simulation of a curved open-channel flow over topography. Physics of Fluids, 22, 075108. https://doi.org/10.1063/1.3459152
- Wang, M., Avital, E., Korakianitis, T., Williams, J., & Ai, K. (2020). A numerical study on the influence of curvature ratio and vegetation density on a partially vegetated U-bend channel flow. Advances in Water Resources, 148(5), 103843. https://doi.org/10.1016/j.advwatres.2020.103843
- Xin, W. Y., Xu, H. J., & Bai, Y. C. (2018). River pattern discriminant method based on resistance parameter and activity indicators. Geomorphology, 303, 210–228. https://doi.org/10.1016/j.geomorph.2017.11.011
- Yan, X. F., Duan, H. F., Liu, T. H., Xu, Z. X., & Wang, X. K. (2022). Geomorphologic changes around a mid-river bar system at a meandering reach in the lower Yangtze River, China: Impacts of the Three Gorges Dam (TGD) and human activities. Catena, 212, 106038. https://doi.org/10.1016/j.catena.2022.106038
- Yan, X. F., Duan, H. F., Wai, W. H. O., Li, C. W., & Wang, X. K. (2022). Spatial flow pattern, multi-dimensional vortices, and junction momentum exchange in a partially covered submerged canopy flume. Water Resources Research, 58(3), e2020WR029494. https://doi.org/10.1029/2020WR029494
- Yang, H. (2020). Numerical investigation of avulsions in gravel-bed braided rivers. Hydrological Processes, 34(17), 3702–3717. https://doi.org/10.1002/hyp.13837
- Zhang, J. L. (2018). Reconstruction and ecological management of the floodplain in the Lower Yellow River. IOP Conference Series: Earth and Environmental Science, 191(1), 012020. https://doi.org/10.1088/1755-1315/191/1/012020
- Zhang, J. L., & Zhang, Y. S. (2020). Study on the evaluation and optimization of ecological spatial layout of the lower Yellow River floodplain. IOP Conference Series: Earth and Environmental Science, 559(1), 012019. https://doi.org/10.1088/1755-1315/559/1/012019