
 ?Mathematical formulae have been encoded as MathML and are displayed in this HTML version using MathJax in order to improve their display. Uncheck the box to turn MathJax off. This feature requires Javascript. Click on a formula to zoom.
Abstract
Intake structures are commonly used in drainage systems to redirect surface rainfall runoff into underground tunnels. The Hong Kong West Drainage Tunnel (HKWDT) system is designed to capture stormwater from steep upland catchments during periods of heavy rainfall, concurrently maintaining a minimal environmental flow downstream during dry weather. However, during heavy rainfall events, excess rainfall water is often directed into the drainage system, presenting a significant challenge to the urban drainage system. Undistorted Froude scale physical models and computational fluid dynamics (CFD) models are developed to investigate the flow performance. In this study, effects of various design parameters on water diversion performance are examined across a wide range of inflow conditions. Steeper channel bottom slopes leading to a larger proportion of water being directed downstream. Extending the length of the bottom rack effectively reduces adhering flow. Introducing a transverse barrier generates a hydraulic jump, which increases flow diversion into the LFC. With higher barrier heights, the hydraulic jump becomes stronger, facilitating greater water diversion into the downstream sewage system. The results indicate potential solutions to these challenges and provide valuable insights into optimizing flow diversion performance in intake structures, particularly in areas characterized by steep terrains and varying flow conditions.
1. Introduction
The escalating prevalence of heavy rainfall events in recent years, potentially attributable to climate change, underscores the growing urgency of flood management in cities globally. Urban drainage systems, particularly in areas characterized by steep terrain, frequently employ intake structures as flood discharge mechanisms (Alrdadi & Meylan, Citation2022; Subramanya, Citation2009).
Located in the subtropical zone, Hong Kong has an oceanic climate and is susceptible to heavy downpours and tropical cyclones during the summer months. The annual average rainfall of Hong Kong is about 2,200 millimeters, which is one of the highest among cities in the Pacific Rim. Moreover, Hong Kong's terrain is hilly and mountainous with steep slopes, especially in the northern part of Hong Kong Island, where intensive urban development has taken place. Urban development and expansion in upper catchment areas have significantly increased surface runoff and reduced the capacity of drainage systems to handle floods. As a result, during rainy seasons, serious flooding occurs in various parts of Northern Hong Kong Island, causing huge economic losses, inconvenience to everyday life for the public, and major disruptions to the transport system.
Figure 1. (a) The Hong Kong West Drainage Tunnel Scheme and (b) the typical intake structure with deversion barrier.
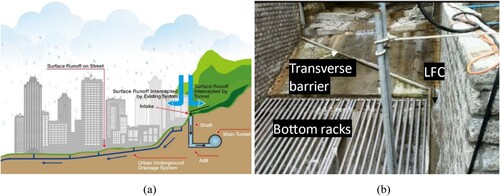
To mitigate the economic impact of flooding and its disruption to the daily routines of the public, the Drainage Services Department (DSD) implemented a stormwater interception strategy known as the Hong Kong West Drainage Tunnel (HKWDT) project. Initiated in November 2007 and completed in August 2012, the project utilized 34 vortex intakes to construct a drainage tunnel system in the western part of Hong Kong Island. This system intercepts stormwater from the upper catchment at the Mid-Levels and directly discharges it into the sea (Figure ). The project has successfully decreased the volume of rainwater flowing into downstream low-lying areas, thus reducing flood risks in urban zones. Each intake structure within this system includes an approach channel, a transverse barrier, a bottom rack chamber, and a low flow channel (LFC) (Figure (b)). The LFC is constructed adjacent to the bar rack, which serves to convey minor runoff to the urban drainage system during dry weather for environmental flushing purposes. Transverse barriers divert dry weather flow to the LFC, which is designed to accommodate a flow rate of 20 L/s. However, field observations suggested that the actual flow through the LFC often exceeds the intended capacity. These excessive un-intercepted flows can strain the drainage systems and increase flood risks in downstream urban areas, and the causes of this phenomenon remains unknown.
The effectiveness of an intake structure is significantly influenced by flow regimes and the specifics of the intake structure design (Chang & Wei, Citation2022b; Chang & Wei, Citation2023; Shen et al., Citation2022). Both physical experiments and theoretical models have been deployed to study the incipient hydraulic jump that results from a supercritical flow's impingement on a vertical sill (Hager et al., Citation1986). Experimental and numerical investigations have examined two categories of incipient jumps over a sill, discussing the mechanism of the jump and the impact of channel width (Ohtsu et al., Citation1996). These studies were conducted in horizontal channels, with the incoming flow direction perpendicular to obstacles. Much of the existing research on flow interception has primarily focused on the interception of sub-critical flows (Brunella et al., Citation2003; Kumar et al., Citation2010; Righetti & Lanzoni, Citation2008). The characteristics of supercritical flow over obstacles have been examined for the design of stilling basins for spillways (Cancian Putton et al., Citation2011; Padulano et al., Citation2017).
However, flow behaviours over an inclined barrier within a sloped approach channel can exhibit significant differences. The flow characteristics over sills in a sloped open channel (0≤φ≤14°) have been explored through physical experiments (Demetiou, Citation2009). The length of the jump region and the surface profiles have been measured and analysed. Despite these findings, the flow performance over an inclined barrier within a sloped channel has been rarely studied to date. To inform and guide the design of intake structures, it is crucial to evaluate the effects of the bottom slope of the approach channel and the angle and height of the barrier on flow performance (Qasim et al., Citation2022; Wei & Chang, Citation2023). Moreover, the interception of supercritical storm water through a bottom rack with a transverse barrier has been studied by Arega et al. (Citation2019). In this work, a two-dimensional model based on shallow water equations was developed to simulate the interception performance and flow characteristics of the intake structure.
The influence of variations in each design parameter and the interrelationships among these parameters on the diversion flow remain poorly understood, necessitating focused research endeavours to elucidate these aspects. In this study, storm flows over transverse barriers are investigated using both physical and numerical intake structure models with steep approach channel slopes of 1:1 and 1:5.5. First, the undistorted physical and numerical models of the real-world intake structure No. 11A and No. 23 were introduced. Then, the interception performance and water level inside the 1:1 slope channel of physical models were measured under different inflow rates, which were also used to validate the numerical models. After validation, the effects of the height of the barrier, the wall height of LFC, and the length of bottom racks on the flow interception performance are explored using physical experiments and 3D computational fluid dynamic models. Finally, important factors that could lead to the different interception performance of the intake structure were discussed.
2. Method
2.1. Physical model setup
To assess the hydraulic performance of the field intake structure, undistorted Froude scale models with a prototype-to-model length scale of 12 were used. To achieve the Froude similarity the ratios for key flow parameters between the model and the prototype can be calculated based on the definition of Froude number (Fr):
Therefore, if we have a length scale ratio (lm) of 1:12 (model: prototype), we can derive the other ratios as follows: Time Scale
, Velocity Scale vm = lm/tm = (1/12)/(1/3.46) = 1:3.46, Discharge Scale Qm = lm2× vm = (1/12)2 × (1/3.46) = 1:498.83. By using the Froude similarity, the ratio of inertia to gravity forces is preserved, so that the gravity effect on the flow impinging on the transverse barrier and being intercepted by the intake structure can be accurately modeled. On the other hand, at the selected scale, the model Reynolds number is sufficiently large to ensure turbulent flow conditions.
Physical models of No. 11 A and No. 23 intake structures of the HKWDT project were constructed in the Hydraulic Laboratory of the Hong Kong University of Science and Technology (HKUST). These two intake structures share the same total width and low-flow channel width, but they have different approach channel slopes. Specifically, the slopes of the approach channels for intakes No. 11A and No. 23 are 1:1 and 1:5.5, respectively.
Froude scale models are key in preserving the ratio of inertia to gravity forces undistorted, thereby enabling accurate simulation of gravity forces. Based on a length scale of lm = 12, the physical parameters of the prototype and model structures are outlined in Table . Physically, each model comprises an approach channel, a transition channel, a transverse barrier, a low-flow channel (LFC), and a bottom rack chamber. To measure the flow rate of intercepted and un-intercepted flows, two weirs were designed and constructed at the end of the LFC and the main channel.
Table 1. Physical characteristics of Intake 11A and 23.
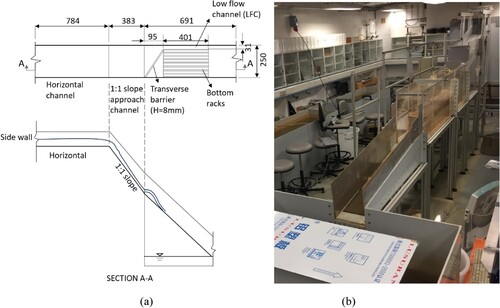
Figure illustrates the physical model setup of intake structure No.11A. Water first passes through a 0.78 m horizontal channel before flowing into an approach channel with a 1:1 slope. Under lower flow conditions, incoming water enters the approach channel and is diverted into the LFC by the transverse barrier. Higher flow rates cause part of the incoming flow to spill over the barrier, entering the chamber through the bottom rack – this is referred to as intercepted flow. A small portion of the total flow continues through the LFC into the downstream drainage system, referred to as un-intercepted flow.
Figure 2. The (a) design drawings and (b) photo of finished physical model.
The structures in the physical models are constructed in the hydraulic lab of the Hong Kong University of Science and Technology in 2015 with PVC and acrylic. The flow recirculating pump system possesses a maximum flow rate of 45 L/s (equivalent to 22.5 m³ in the prototype). The method of flow measurement mirrors that of the original study (Arega et al., Citation2019). Two ultrasonic flow metres were used to measure the total flow rate of the pipe supplying water to the model. A point gauge measured the flow rate at the model's inlet (start section of the approach channel). Interception and un-interception flow rates were measured separately using two calibrated weirs. Comparisons between weir flow measurements and ultrasonic flow measurements showed an average discrepancy of 3%. When the summary of intercepted and un-intercepted flow rates measured by weirs was compared with the total flow rate measured by the ultrasonic flow metres, the average difference amounted to 4%. Additionally, for the purpose of verifying numerical results, the water depth above the barrier was measured using a point gauge in the laboratory.
2.2. 3-D computational fluid dynamic (CFD) model
A 3D CFD model was developed to explore the hydraulic performance of the intake structures under a broad range of rainfall events. This section summarizes the governing equations, model grids, boundary conditions, and initial conditions.
2.2.1. Governing equations
The 3D air–water flow in the intake structures is modeled using a CFD model based on the Volume-of-Fluid (VOF) method (Cano-Lozano et al., Citation2015; Hirt & Nichols, Citation1981). In the VOF method, the fractional portions of water and air in each control volume are denoted by two variables, and
respectively, with the sum of them being equal to 1(
). This method calculates air–water two-phase flow by solving the continuity equation for the water phase and the shared momentum equation for both phases. The interface of the two phases is tracked by addressing the continuity equation for the volume fraction of one phase. The continuity equation for the water phase is as follows:
(1)
(1) where
is the volume fraction of water phase,
= 998.2 kg/m3 is water density and U(x, y, z) is the phase-averaged velocity of air and water mixture. Once the fraction of water is solved, the volume fraction of air can be computed from
.
The air and water flows share the same set of momentum equation and velocity U(x, y, z), the momentum equation can be written as (Patankar, Citation2018; Rodi, Citation2017):
(2)
(2) where
m/s2 is the gravitational acceleration;
is phase averaged turbulent dynamic viscosity that can be determined from the the Re-Normalisation Group (RNG) k−ϵ turbulence model (Yakhot et al., Citation1992);
is the average density for the air–water mixture in the control volume.
The governing equations are solved using the commercial software ANSYS FLUENT (Fluent, 2013). The 3D turbulent two-phase flow is addressed using the Reynolds-Averaged Navier-Stokes (RANS) equations model. The pressure-based implicit solver is chosen to solve the unsteady governing equations. The PISO algorithm is used for pressure-velocity coupling, and the skewness correction and neighbour correction parameters are set to 0 and 1, respectively. The PRESTO method and the modified HRIC scheme are utilized for the discretization of pressure terms and volume fraction equation, respectively. The RNG two-equation k-ϵ model is used for turbulent closure (Chang, Citation2022; Chang & Wei, Citation2022a). The second order upwind and first order upwind discretization schemes are applied for momentum and turbulence parameters. Convergence is declared if the normalized residual is less than 10−4 for all variables, and it requires approximately 10 iterations for convergence in each time step.
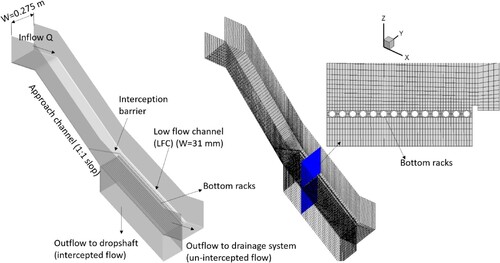
Figure 3. Computational domain and meshing of the CFD model of intake No. 11A.
2.2.2. Model grid, boundary conditions and initial conditions
The numerical models are set up in accordance with the physical models. Unstructured boundary-fitted grids are used in the model. The sensitivity test was performed with a time step of 0.001s, and the total grid number for cases without bottom racks varied from 63,834–255,336. The results showed stability when the total number was increased from 127,668–255,336. To optimize computational resources, a total grid number of 127,668 was selected for cases without racks, while cases with racks utilized 183,678 grids.
Figure displays the computational domain and meshing of the flow model for the existing intake with a 1:1 slope, respectively. Refined meshes were used in regions close to the channel bed, the transverse barrier, and bottom racks. The minimum grid size near the bottom rack bars is approximately 1 mm (1/8 of wall height), and increasingly coarser grids are adopted from the bars to the far downstream of the channel (to about 2 cm, 1/12 of the channel width).
There are four open boundaries in the numerical model, namely the flow inlet, the outlet of the bottom chamber, the outlet of the un-intercepted flow, and the top atmospheric boundary. At the model's inlet, the flow discharge, water depth, and turbulence parameters k and are prescribed. A zero-gauge pressure boundary condition is applied at the downstream outlet boundary and at the top boundary to represent the ambient air's atmospheric pressure. The turbulent boundary layer near the frictional wall at the bottom is modeled with a wall function to represent the roughness effect. The roughness element height is assumed to be 0.01 mm for all the solid walls.
The simulation begins with an initial condition of a critical water depth (calculated from the flow rate and channel width) at the horizontal channel. The supercritical flow is developed in the sloped approach channel. The sensitivity test of the time step was performed using the selected grid numbers mentioned earlier, ranging from 0.01 s to 0.0001 s. The simulation results remained stable when the time step was changed from 0.001s to 0.0005s. Therefore, a time step of 0.001s was chosen for the simulations. Convergence time for each simulation scenario was determined by monitoring the wall pressure at the top of the transverse barrier from 0 to 16 s of simulation time. Convergence was observed after 8–10 s, as depicted in the figure below. Consequently, a simulation time of 10 s was deemed appropriate for the duration of the simulations. Time-averaged flow depth, velocity, and air concentration are obtained based on quasi-steady solutions. The simulation is computed on an Intel i7-4790 3.6 GHz CPU computer with quad-core parallel computation. For a 10-second calculation, it takes approximately 20 h for cases without a bottom rack and about 4–5 days for cases with circular rack bars.
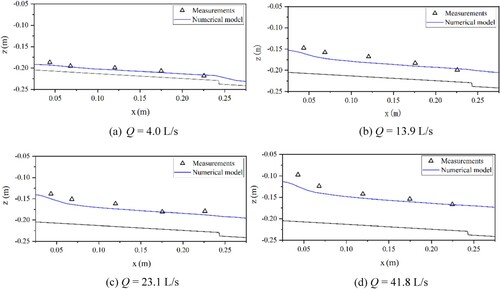
Figure 4. The measured and predicted water depth above barrier of the intake 23 under inflow rate (Q) of (a) 4.0 L/s, (b) 13.9 L/s, (c) 23.1 L/s, and (d) 41.8 L/s.
2.3. Simulation scenarios
The performance of the intake structures is investigated under representative design flow conditions, including storms with 2-, 10-, 50-, and 200-year return periods (Table ). Based on the Fifth Assessment Report of the Intergovernmental Panel on Climate Change (IPCC) global climate model (GCM) projections and statistical downscaling, both the annual rainfall and daily rainfall intensity in Hong Kong are projected to increase in the twenty-first century (e.g. Lee, Chan, Chan, & Kok, Citation2011). For drainage design, climate change effects up to the mid-twenty-first century were considered (Drainage Services Department 2018), leading to increased design flows under the same return period (Table ).
Table 2. Design flows for flow intake structure.
3. Result and discussion
3.1. Model validation
The water depth above the transverse barrier and the interception flow rate are measured in the physical model, which can be used as validation data of the numerical model. Figure showcases the comparison of measured and predicted water depths above the transverse barrier under typical rainfall conditions of 4, 13.9, 23.1, and 41.8 L/s. The root-mean-square error (RMSE) between the measurements and numerical results was found to be 0.011 m, signifying an excellent agreement between the measurements and model predictions.
The water depth above the barrier in all simulated cases displayed a higher depth near the side-wall due to the wall effect. The water depth gradually decreased with the distance from the wall and remained almost stable until the barrier's end. With the increase of the flow discharge, the water depth above the barrier noticeably escalated.
Figure 5. The retained water on the top of the bottom racks with slope of 1:5 and 1:1, x: the distance from the end of the interception barrier. (a) 1:5.5 slope, Q = 13.9 L/s, x = 0 cm (b) 1:5.5 slope, Q = 13.9 L/s, x = 10 cm (c) 1:1 slope, Q = 13.9 L/s, x = 0 cm (d) 1:1 slope, Q = 13.9 L/s, x = 10 cm.
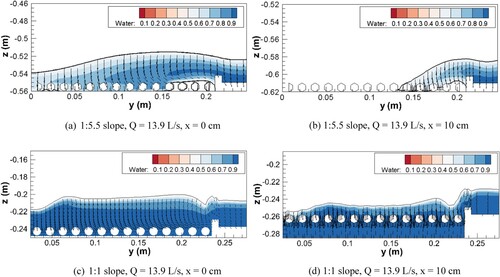
3.2. Un-intercepted flow rates of the two intake structures with different slopes
The un-intercepted flow rates of two models, differing in their bottom slopes (1:1 and 1:5.5), were evaluated and forecasted under varying inflow rates (Q). The root-mean deviations of the model predictions and measurements were 0.11 and 0.20 L/s respectively, demonstrating a strong agreement between the measured data and the model predictions.
As the total inflow rate within the same structure increased from 1 to 19.5 L/s, the un-intercepted flow rates escalated, while the intercepted flow rates correspondingly decreased. Given the same inflow rate, the un-intercepted flow rate was larger in scenarios with a steeper bottom slope, indicating a higher un-intercepted rate (%) in these scenarios. Figure provides an illustration of the flow fields and velocity distributions of the cross-sections at differing distances along the bottom rack. At equivalent distances from the onset of the bottom racks, a greater volume of water was observed atop the bottom rack in cases with a steeper slope. This retained flow above the bottom rack signifies the subpar interception performance of the bottom rack and intake structure. As a result, an increased volume of water enters the city's drainage system, potentially surpassing the system's capacity and leading to pipe rupture and leakage.
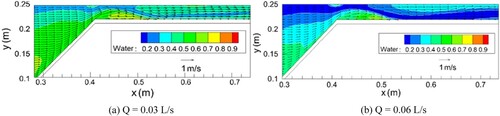
3.3. Flow characteristics in LFC
Under low flow conditions, a substantial proportion of the incoming flow is directed towards the Low Flow Channel. Specifically, when the inflow rates are 0.06 and 0.03 L/s, the un-intercepted rates reach notable levels of 72% and 100% respectively. The flow that goes into LFC can serve as flushing flow of the city drainage system. Following the diversion caused by the transverse barrier, the water undergoes a trajectory towards the LFC's side wall, where it impinges upon the far side wall before being reflected (Figure ). Consequently, a sinuous water flow pattern is established between the two parallel side walls of the LFC. The same phenomenon is observed in the field observation of the intake structure system (Figure (b)). The sinuous water flow resulting from the diversion causes the reflected flow to impinge upon the walls of both the Low Flow Channel and the bottom rack. This impact induces the ingress of water into the bottom rack chamber.
Figure 6. The sinuous water flow formed in LFC inside the model of intake 11A. (a) Q = 0.03 L/s (b) Q = 0.06 L/s.
3.4. Flow characteristics over the transverse barrier
Supercritical flow from the approach channel encounters the barrier at high velocity, inducing a hydraulic jump at the barrier's location. The characteristics of this jump flow hold significant relevance to the present study. Consequently, the cross-section's flow fields and turbulent kinetic energy (TKE) in models of intake 11A under varying flow conditions are illustrated in Figure . Clear hydraulic jumps are noticeable across the barrier under a flow rate of 4 L/s. However, the prominence of the hydraulic jump diminishes as the inflow rate increases. At a flow rate of 13.9 L/s, the water surface exhibits a subtle curvature, while no distinct surface change can be discerned when the flow rate escalates to 41.8 L/s.
Figure 7. The flow fields and TKE distribution of the cross-section across the transverse barrier in numerical model of intake 11A.(a) Q = 4 L/s (a) Q = 13.9 L/s (a) Q = 41.8 L/s.
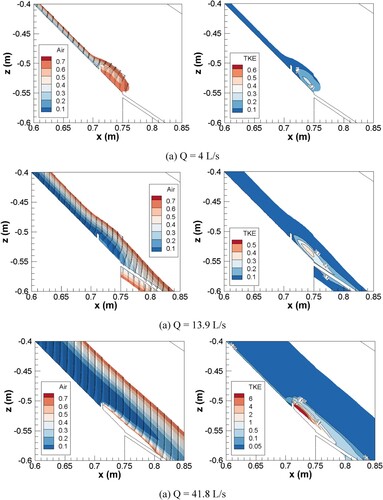
Figure also compares the turbulent kinetic energy before and after the transverse barrier. Areas with higher TKEs are observed post the transverse barrier, and the turbulence intensifies correspondingly with the flow rate. Furthermore, an air cavity begins to form behind the transverse barrier as the flow rate increases, becoming clearly visible at a flow rate of 41.8 L/s.
3.5. Effect of LFC wall height
In the original design, the height of the wall between the LFC and the bottom rack chamber was 8 mm. To investigate the impact of wall height on the diversion efficiency, the additional design scenarios in the numerical model of intake 11A with wall heights of 4 and 2 mm are introduced. The computational results indicate that, under the same flow conditions, the un-intercepted flow decreases as the height of the LFC wall decreases (Table and Figure ). This suggests that reducing the wall height can enhance the interception efficiency of the bottom racks and reduce the flow that goes into the city drainage systems. As the flow performance in the main channel is identical before water goes into the diversion part of LFC and bottom rack chamber, therefore, the control factor of the un-intercepted flow rates is the wall height of the LFC. The higher LFC wall can sustain more water within the channel and convey more water downstream.
Figure 8. The un-intercepted flow rates of numerical model of intake No.11A and its modifications with LFC wall height of 4 and 2 mm.
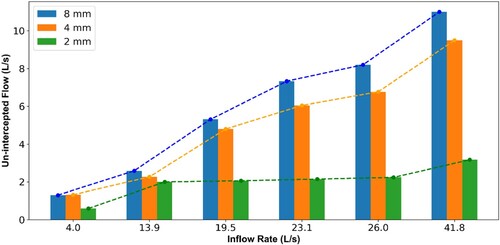
Table 3. Un-intercepted flow rates (Qu) of Intake 23 (1:5 slope) and 11A (1:1 slope).
3.6. Effect of the bottom rack on flow diversion
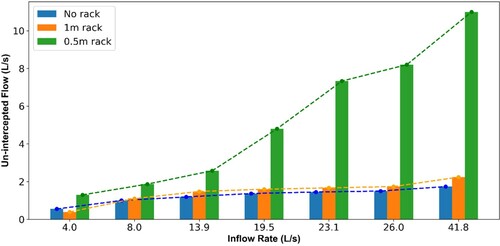
In drainage structures, the implementation of a bottom rack serves the purpose of filtering solid materials. However, the presence of the rack introduces resistance to the flow, subsequently diminishing the speed and efficiency of drainage. While the filtration function is crucial in protecting the drainage system from potential damages and blockages, it is essential to strike a balance between filtration effectiveness and drainage efficiency during the design and operation of drainage structures. In this part, the impact of bottom rack implementation on drainage efficiency is examined. The numerical experiments investigating the influence of bottom rack were carried out on three additional designs of intake No. 11A: absence of a bottom rack, a bottom rack with a length of 0.5 m, and a bottom rack with a length of 1 m.
The un-intercepted flow rates of the three cases under various inflow conditions are illustrated in Figure . The results indicate a significant reduction in the un-intercepted rainfall goes into to drainage system through LFC without a bottom rack, and as the length of the bottom rack increases, the un-incepted water also decreases. Under the flow rate of 41.8 L/s, about 11 L/s water flows into city drainage system in case with 0.5 m bottom racks, which reduces to 2.24 L/s in case with 1 m bottom rack and 1.74 for case without racks. These findings provide valuable insights into the influence of bottom rack length on rainwater management and can inform the design and implementation of effective drainage systems.
Figure 9. The predicted un-intercepted flow of intake structures 11A with 0.5, 1 m length bottom racks and no racks.
The flow performance after the transverse barrier with and without bottom racks is represented in Figure . Right after the transverse barrier, most of the water pours down into the bottom chamber wall without bottom racks, after which the water is poured out of LFC along its propagation downstream. On the contrary, a layer of water is retained on the top of the bottom racks due to the blocking effect. The retained water on the top of the bottom racks introduced into the LFC, therefore, the un-intercepted rate is higher than that without bottom racks (Table ).
Figure 10. The flow characteristic in cross-section with travelling distance of (a) 0 mm, (b) 5 mm, and (c) 10 mm from the end of transverse barrier (Q = 19.5 L/s).
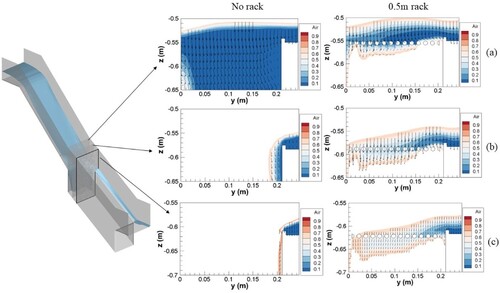
Table 4. The un-intercepted flow rates of numerical model of intake No.11A (Original height H) and its modifications with LFC wall height of 4 mm (1/2 H) and 2 mm (1/4 H).
3.7. Effect of the transvers barrier
In this section, the impact of diversion barrier height on flow interception is examined by developing models with varying transverse barrier heights in models of intake No. 11A. Table and summarizes the forecasted un-intercepted flow rates across different design scenarios, under various inflow conditions. It's noteworthy that the un-intercepted flow rate inversely correlates with barrier height, with the lowest rate observed in scenarios absent of a transverse barrier (Figure ). To illustrate the differing flow behaviour, the air–water interface distributions for three cases at a flow rate of 19.5 L/s are depicted in Figure .
Figure 11. The predicted un-intercepted flow of intake structures 11A with 8- and 2-mm height of transverse barrier and case without a transverse barrier.
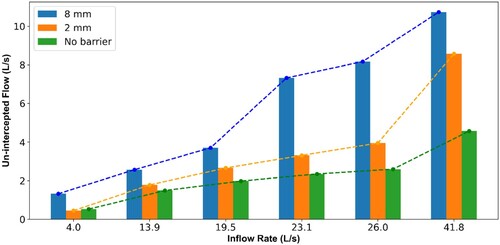
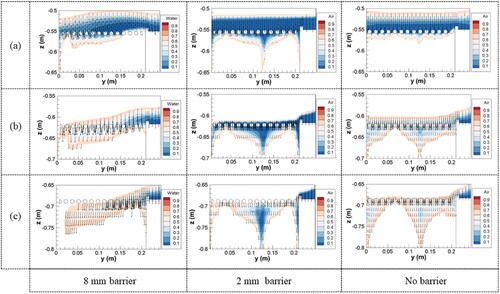
Figure 12. The water surfaces in intake structures barrier height of (a) 8 mm, (b) 2 mm and (c) no barrier under inflow rate of Q = 19.5 L/s. (a) Barrier height = 8 mm (b) Barrier height = 2 mm (c) No barrier.
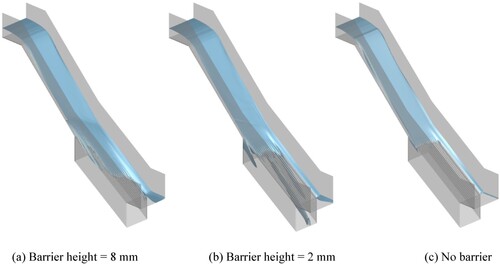
Table 5. Predicted Un-Intercepted Flow Rates for Physical Models of Intake 11A with Bottom Racks Lengths of 0.5 m (2 times length of the channel width L) and 1 m (4 times length of the channel width L), and without Bottom Racks.
A hydraulic jump is evident in the original design, which features an 8 mm barrier. This causes the water to traverse in the direction of the LFC due to the reflection effect of the transverse barrier. As a result, most water is directed towards the LFC, leaving some dry areas on the side opposite to the LFC (as shown in Figure (a)). In contrast, the intake structure with a 2 mm barrier exhibits a less pronounced hydraulic jump, with the flow progressing more uniformly (as illustrated in Figure (b)). The flow's traveling distance on the bottom racks is shortened in the 2 mm-barrier scenario compared to the original design due to the week jump over the transverse barrier. In the case without a barrier, the lack of a transverse barrier leads to a shorter traveling distance of water on the racks compared to the 2 mm-barrier scenario (as depicted in Figure (c)). The hydraulic jump caused by the transverse barrier leading to more flow goes into the LFC and resulting in larger un-intercepted flow rates with higher transverse barrier (Table ).
Table 6. The comparison of un-intercepted flow rates of numerical model of intake No.11A (Original barrier height H) and its modifications with barrier of 2 mm (1/4 H) and no transverse barrier.
The water phase distribution and velocity fields in the three structures under a flow rate of 19.5 L/s are depicted in Figure . Immediately after the transverse barrier, the flow exhibits a higher water surface elevation in the structure equipped with an 8 mm barrier compared to the other two cases, as presented in Figure (a). A hydraulic jump can be clearly observed as there is a large space between the water flow and the bottom racks with a jump distance of 10 mm (Figure (b)). The water surface is lower on the side close to LFC, and water flows into the LFC from the main channel. The water finally reached the bottom racks after a traveling distance of 20 mm after the transverse barrier (Figure (c)). In the intake structure with a 2 mm barrier, the water was distributed more evenly on the bottom racks, which is in accordance with the water surface variation observed in Figure . For the scenarios without a transverse barrier, the water surges into the bottom rack chamber from the approach channel, precipitating a swift plunge in water surface level and substantial air entrainment, as displayed in Figure (b,c).
Figure 13. The air-water two phase flow distribution in cross-sections with traveling distance of (a) 0, (b) 10 mm, and (c) 20 mm from the end of the transverse barrier.
4. Conclusions
The validated 3D CFD model is used to predict flow diversion in intake structures. Various design parameters such as bottom slope, bottom racks, transverse barrier height, and LFC wall height are investigated under a wide range of inflow conditions from 4 to 41.8 L/s. Steeper bottom slopes lead to higher velocities and shorter retainment times on top of racks, resulting in more water going into the drainage system. These findings are consistent with the results of Arega et al. (Citation2019) but the simulation scenarios are further extended. The steep terrain of Hong Kong Island poses challenges to the drainage system during heavy rainfall. Comparing with the flow characteristics of the sub-critical flow (Brunella et al., Citation2003; Kumar et al., Citation2010; Righetti & Lanzoni, Citation2008), the performance of supercritical flows are more complicated (Cancian Putton et al., Citation2011; Padulano et al., Citation2017). During low flow conditions, most inflow goes into the LFC, creating a sinuous flow pattern. As inflow increases, LFC capacity is reached, and wall height controls water retention and flow to the drainage system. The difference performance of flow diversion in cases with and without bottom racks proved that there will be a partial of water flow adhering to the bottom racks and goes into the downstream drainage system under all the representative design flow conditions. Extending the length of the bottom rack can significantly reduce adhering flow, which could be a good solution to the balance between filtration effectiveness and drainage efficiency. When there is no transverse barrier, the incoming flow will be evenly distributed to the two channels according to the width of the LFC and bottom rack channel. When the barrier is set, the water flow will form a hydraulic jump after encountering the barrier, and more water flow will be introduced into the LFC. As the height of the barrier increases, the height and span of the hydraulic jump are larger, which is more conducive to introducing water into the downstream sewage system.
This study offers valuable findings on enhancing the efficiency of flow diversion in intake structures, proposing potential design enhancements, especially in regions characterized by rugged topography and fluctuating flow conditions. The limitation of this work is that a limited number of parameters were investigated, along with a limited range of design scenarios. The study only examined a few specific situations for each design parameter, offering a qualitative understanding of their impact on flow diversion performance. To further enhance the understanding of these parameters, it would be beneficial to explore a wider range of parameter values and conduct more comprehensive quantitative analyses to establish the quantitative relationships and laws governing the flow diversion performance. By expanding the scope of parameter investigation, a more detailed and precise understanding of the design considerations and their quantitative effects can be achieved. However, this work addresses the lack of research on flow performance over inclined barriers in sloped channels. It emphasises the importance of evaluating the effects of channel slope, barrier angle, and height on flow performance to guide intake structure design. The study highlights the need for focused research to understand the interrelationships among these parameters and their impact on diversion flow.
Data availability statement
All data that support the findings of this study are available from the corresponding author upon reasonable request. All models used during the study appear in the published article.
Additional information
Funding
References
- Alrdadi, R., & Meylan, M. H. (2022). Modelling water flow through railway ballast with random permeability and a free boundary. Applied Mathematical Modelling, 103, 36–50. https://doi.org/10.1016/j.apm.2021.10.018
- Arega, F., Lam, M. Y., & Lee, J. H. (2019). Supercritical stormwater flow interception through bottom rack with transverse barrier. Journal of Irrigation and Drainage Engineering, 145(4), 05019002. https://doi.org/10.1061/(ASCE)IR.1943-4774.0001371
- Brunella, S., Hager, W. H., & Minor, H. E. (2003). Hydraulics of bottom rack intake. Journal of Hydraulic Engineering, 129(1), 2–10. https://doi.org/10.1061/(ASCE)0733-9429(2003)129:1(2)
- Cancian Putton, V., Marson, C., Fiorotto, V., & Caroni, E. (2011). Supercritical flow over a dentated sill. Journal of Hydraulic Engineering, 137(9), 1019–1026.https://doi.org/10.1061/(ASCE)HY.1943-7900.0000407
- Cano-Lozano, J. C., Bolaños-Jiménez, R., Gutiérrez-Montes, C., & Martínez-Bazán, C. (2015). The use of volume of fluid technique to analyze multiphase flows: Specific case of bubble rising in still liquids. Applied Mathematical Modelling, 39(12), 3290–3305. https://doi.org/10.1016/j.apm.2014.11.034
- Chang, L. (2022). Effects of pipeline geometry, sample volume, and flow rate on pb monitoring outcomes in copper pipe drinking water supply systems. Water Research, 222, 118890. https://doi.org/10.1016/j.watres.2022.118890
- Chang, L., & Wei, W. (2022a). Numerical investigation of the plunging and vortex-flow regimes occurring in drop shafts with a tangential intake. Journal of Irrigation and Drainage Engineering, 148(8), 04022026-1–10. https://doi.org/10.1061/(ASCE)IR.1943-4774.0001692
- Chang, L., & Wei, W. (2022b). Numerical study on the effect of tangential intake on vortex dropshaft assessment using pressure distributions. Engineering Applications of Computational Fluid Mechanics, 16(1), 1100–1110. https://doi.org/10.1080/19942060.2022.2072954
- Chang, L., & Wei, W. (2023). Numerical study on the effect of tangential intake design and inflow discharge on vertical dropshaft assessment using pressure and velocity distributions. Engineering Applications of Computational Fluid Mechanics, 17(1), 2252045. https://doi.org/10.1080/19942060.2023.2252045
- Demetiou, J. (2009). Inclined jumps over sills part 2 downstream geometry. Springer. Fluent, A., 2013. Ansys fluent theory guide 15.0. ANSYS, Canonsburg, PA 33.
- Hager, W. H., Basler, B., & Wanoschek, R. (1986). Incipient jump condition for ventilated sill flow. Journal of Hydraulic Engineering, 112(10), 953–963. https://doi.org/10.1061/(ASCE)0733-9429(1986)112:10(953)
- Hirt, C. W., & Nichols, B. D. (1981). Volume of fluid (VOF) method for the dynamics of free boundaries. Journal of Computational Physics, 39(1), 201–225. https://doi.org/10.1016/0021-9991(81)90145-5
- Kumar, S., Ahmad, Z., Kothyari, U. C., & Mittal, M. (2010). Discharge characteristics of a trench weir. Flow Measurement and Instrumentation, 21(2), 80–87. https://doi.org/10.1016/j.flowmeasinst.2010.01.002
- Lee, T. C., Chan, K. Y., Chan, H. S., & Kok, M. H.. (2011). Projections of extreme rainfall in Hong Kong in the 21st century. Acta Meteorologica Sinica, 25(6), 691–709.
- Ohtsu, I., Yasuda, Y., & Hashiba, H. (1996). Incipient jump conditions for flows over a vertical sill. Journal of Hydraulic Engineering, 122(8), 465–469. https://doi.org/10.1061/(ASCE)0733-9429(1996)122:8(465)
- Padulano, R., Fecarotta, O., Del Giudice, G., & Carravetta, A. (2017). Hydraulic design of a usbr type ii stilling basin. Journal of Irrigation and Drainage Engineering, 143(5), 04017001. https://doi.org/10.1061/(ASCE)IR.1943-4774.0001150
- Patankar, S. V. (2018). Numerical heat transfer and fluid flow. CRC press.
- Qasim, R. M., Mohammed, A. A., & Abdulhussein, I. A. (2022). An investigating of the impact of Bed flume discordance on the weir-gate hydraulic structure. HighTech and Innovation Journal, 3(3), 341–355. https://doi.org/10.28991/HIJ-2022-03-03-09
- Righetti, M., & Lanzoni, S. (2008). Experimental study of the flow field over bottom intake racks. Journal of Hydraulic Engineering, 134(1), 15–22. https://doi.org/10.1061/(ASCE)0733-9429(2008)134:1(15)
- Rodi, W. (2017). Turbulence models and their application in hydraulics: A state-of-the-art review. Routledge.
- Shen, W., Wang, S., Zhang, X., & Liang, X. (2022). Large-eddy simulation and mathematical model of vortex breakdown and pressure drop in a cavity with tubeless vortex reducer. Engineering Applications of Computational Fluid Mechanics, 16(1), 1344–1363. https://doi.org/10.1080/19942060.2022.2091662
- Subramanya, K. (2009). Flow in open channels. Tata McGraw-Hill Education.
- Wei, W., & Chang, L. (2023). Analytical solutions for vortex flow at the tangential inlet of a vertical dropshaft. Physics of Fluids, 35(1), 015160.
- Yakhot, V., Orszag, S., Thangam, S., Gatski, T., & Speziale, C. (1992). Development of turbulence models for shear flows by a double expansion technique. Physics of Fluids A: Fluid Dynamics, 4(7), 1510–1520. https://doi.org/10.1063/1.858424