
 ?Mathematical formulae have been encoded as MathML and are displayed in this HTML version using MathJax in order to improve their display. Uncheck the box to turn MathJax off. This feature requires Javascript. Click on a formula to zoom.
ABSTRACT
Magnetic coupling is an approach employed to prevent gas leakage by transforming the dynamic seal into a non-contact static seal for the recovery of natural gas pressure energy. The impact of thermal demagnetization necessitates the consideration of the heat dissipation characteristics resulting from eddy current losses in the rotating magnetic field. We performed a numerical study of thermal-magnetic coupling in a magnetic transmission validated by experimental results. The Maxwell software was utilized to simulate the distribution characteristics of induced current, while the Fluent software was employed to analyze the dissipation of heat caused by eddy currents. The obtained simulation results reveal a proportional increase in induced current and eddy current losses with the rotation speed. Also, the eddy current losses increase together with the thickness of the isolation cover, since more volume of the conducting media is affected by the eddy currents. Furthermore, reducing the electrical conductivities of the isolation cover and enhancing the internal flow rates can effectively decrease the temperature of the magnetic coupling and mitigate thermal demagnetization. These research findings offer valuable insights for the design and optimization of non-contact transmission methods, ultimately enhancing the safety of natural gas top-pressure energy recovery equipment.
Nomenclature
| B | = | magnetic induction intensity(T) |
| c | = | constant |
| D | = | the electric displacement vector(C/m²) |
| E | = | the electric field intensity(V/m) |
| G | = | turbulence kinetic energy generation rate |
| H | = | the magnetic field strength(A/m) |
| J | = | the eddy current densities(A/m2) |
| N | = | number of magnet poles |
| n | = | rotational speed(rpm) |
| = | air pressure (Pa) | |
| T | = | Isolation cover thickness(mm) |
| = | Time(s) | |
| u | = | air velocity component (m/s) |
| = | the location component(mm) |
Abbreviation
| CFD | = | Computational Fluid Dynamics |
| RNG | = | Reynolds Renormalization Group |
| rpm | = | Revolutions per minute |
| ICEM | = | Integrated Computer Engineering and Manufacturing code |
| SIMPLE | = | Semi-Implicit Method for Pressure Linked Equation |
Greek letters
| = | the deflection angle of the magnet rotor(°) | |
| σ | = | the conductivity of the medium(S/m) |
| = | turbulence kinetic energy | |
| = | turbulence dissipation rate | |
| = | dynamic viscosity (N·s/m2) | |
| = | air density (kg·m3) |
Subscripts
| = | condition of a different location | |
| = | condition of a different location | |
| = | radial position | |
| eff | = | effective viscosity coefficient |
1. Introduction
The natural gas is widely recognized as a clean, secure, and highly efficient energy source, boasting a stable supply, adaptability, and environmentally friendly qualities (Sun et al., Citation2022). However, when transporting natural gas over long distances, it becomes necessary to pressurize the gas in order to enhance its transportation capacity and achieve optimal economic efficiency. Consequently, a decompression process is implemented at the inlet of downstream equipment through the use of a pressure-regulating valve, which ensures safety. In a power plant located in Jiangsu province, Eastern China, the upstream pressure of the natural gas stands at 5 MPa, while the allowable pressure for the gas turbine is only 4 MPa. As a result, a significant amount of energy is squandered by the pressure regulator in this scenario.
Converting the wasted pressure energy to electrical power through the use of a gas turbine offers a convenient solution, characterized by its ease of transportation and storage (Dumont et al., Citation2017; Yu et al., Citation2018). However, the shaft seal is a critical component in the rotary recovery systems because of the explosive nature of natural gas (Zhou et al., Citation2022). Moreover, as the operational duration increases, traditional sealing techniques such as packing seals, mechanical seals, and labyrinth seals experience a gradual decline in their sealing capabilities, accompanied by a reduction in radial force (Han et al., Citation2015; Zhang & Xie, Citation2018). Therefore, the development of a reliable sealing method holds the potential to enhance the safety of pressure energy recovery equipment.
In comparison to traditional shaft sealing methods, magnetic coupling offers a contactless torque transmission mechanism, utilizing the power of magnetic flux. This innovative system comprises an inner magnet, an outer magnet, and an insulated enclosure, providing noteworthy benefits such as reduced vibration, lower noise levels, and built-in overload protection (Abdolkhani & Hu, Citation2011; Shi et al., Citation2022). The intricate design associated with dynamic sealing can be replaced by enclosing the natural gas between the rotary expander and isolation hood. However, it's important to note that the metal enclosure cover placed within an alternating magnetic field may induce electric currents and eddy current loss, which can lead to a temperature rise and potential transmission failures in the permanent magnet. Therefore, investigating the mechanisms that generate these losses and understanding the heat transfer characteristics is crucial in the development of this new driving mode, aiming to prevent any temperature rise in the permanent magnet.
Numerous researchers have devoted their efforts to the investigation of eddy current loss generation. It showed that the finite element method is an effective way to study the magnetic field and eddy current loss. In Bo et al. (Citation2010), a two-dimensional finite element model, employing a magnetic-thermal element coupling, was used to accurately simulate the distributed heat sources. Zunquan focused on analyzing the primary heating region impacted by eddy current loss, noting that excessive eddy current loss can elevate magnet temperatures, leading to a decline in magnet performance and magnetic transmission efficiency (Kou et al., Citation2009; Yuan & Wang, Citation2011). Changsong conducted a study on the air-gap magnetic field of a cylindrical magnet coupling, examining the characteristics of eddy current density along the axial direction, taking into consideration the skin effect. The findings indicated that an undesirable increase in eddy current could occur when using a thicker isolation cover (Cai et al., Citation2017). HJ Zhang analyzed the eddy characteristics by using the finite element method, and proposed specific programs to reduce the eddy current power loss (Zhang et al., Citation2012). Zina Zhu constructed a 3D finite element analysis model to analyze the magnetic field spatial distributions and vector eddy currents, and compared with the experimental results. It was concluded that the 3D analytical method of eddy current loss using the ANSYS software was viable and could be used for the eddy current loss prediction of magnet couplings (Zhu & Meng, Citation2016).
The aforementioned studies primarily focused on the theoretical aspects of eddy current losses, without delving into eddy current heat dissipation methods or magnetic-thermal coupling calculations. To study the thermal dissipation in more details, Yu conducted an analysis of temperature distribution in a cylindrical permanent magnet coupling, revealing that the high-temperature region predominantly occurs within the internal permanent magnet rotor, while the outer permanent magnet exhibits relatively lower temperatures (Cao et al., Citation2020). In a related field, Gamez-Montero simplified the structure of the cooling circulation loop in magnetic pump and mathematically analyzed the flow resistance coefficient within the pump (Gamez-Montero et al., Citation2009). Zhenjun examined the water-cooling channel in a magnetic pump and investigated the heat dissipation mechanism of eddy currents by using the cooling water through the isolation sleeve gap to prevent excessive temperatures in the magnetic rotors (Zhenjun et al., Citation2021). Gang Cheng studied the flow field and structure temperature field distribution of the axial magnetic coupling by using the fluid-thermal coupling simulation method, and the heat dissipation coefficient and temperature distribution law of the structure surfaces were calculated (Cheng et al., Citation2023). Lei Wang simulated the temperature field of the magnetic coupling based on the fluid-thermal coupling method, optimizing the shape and the number of the cooling channels in a water-cooled magnetic coupling (Wang et al., Citation2019). Di Zheng calculated the eddy current loss, temperature of the magnetic coupling, and verified the electromagnetic thermal model by using the finite element method and the experimental results (Zheng et al., Citation2018). These studies collectively contribute to a deeper understanding of magnetic heat dissipation characteristics and non-contact transmission technologies.
Traditional shaft sealing methods can’t prevent leakage because the radial force and the compression effect on the shaft surface gradually deteriorate. To overcome this problem, in our research, we adopt the magnet coupling to replace the traditional shaft seal transferring the power through the inner and outer magnet and completely sealing the gas by the isolation shell. In this land of research, the magnetic field and temperature field of magnetic coupling are simulated (see the papers mentioned in the Introduction). However, most of the research object is on the axial coupling rather than the cylindrical coupling, and the cooling medium is water. There are few results on the temperature influence for the magnetic coupling under the natural gas cooling condition. Therefore, it is of interest to conduct magnetic analysis, temperature rise tests, and analysis the heat dissipation to improve the reliability of the magnetic coupling in natural gas utilization. The study investigates the generation of eddy current losses through a 3D finite element analysis using Maxwell's equations. Furthermore, it analyzes the dissipation mechanism of these losses using Fluent through one-way coupling calculations, aiming to mitigate temperature-induced demagnetization. The outcomes of this research are expected to enhance the safety of existing equipment and improve the economic efficiency of power plants in gas pressure energy recovery process.
2. Numerical methods
2.1. Structure of the magnetic drive equipment
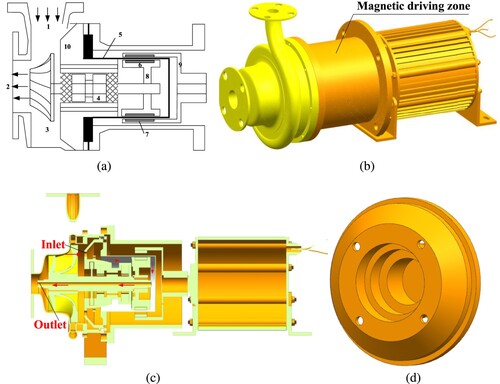
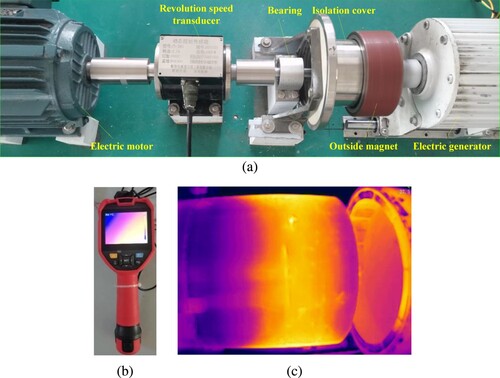
illustrates the internal structure of the pressure energy recovery device, which comprises the inner magnet, the outer magnet, and the isolation enclosure. As shown in Figure (a) and (b), the radial gas turbine and the inner magnet are fixed at the both ends of the rotating shaft supported by bearings. The outer magnet, driven by magnet force through the isolation cover, performs the task of transforming the dynamic shaft seal into a static seal, effectively preventing gas leakage. As a consequence of the magnet field rotation, eddy currents are induced within the isolation cover, leading to an increase in ambient temperature. To prevent the demagnetization of the permanent magnet, caused by high temperature, and to avoid the corresponding failure in the power transmission, a part of the high-pressure gas flows into the inlet hole at the bearing seat to remove the heat (see Figure (c) and (d)). This cooling flow is then returned to the downstream flow from the center hole of the shaft. This process effectively mitigates temperature-induced demagnetization of the permanent magnet, thereby enhancing the reliability of the device.
Figure 1. Structure of the pressure energy recovery equipment.
2.2. Parameter setting and mesh generation
shows the calculation domain and simulation mesh in Maxwell software, the detailed parameters are shown in , the permanent magnetic coupling has 24 magnetic blocks, and the thickness of the 304 stainless steel is 1 mm. The relative permeability of Nd2Fe14B is 1.05, the conductivity of Nd2Fe14B is 625,000 S/m, the coercivity of Nd2Fe14B is 850,000 A/m and the conductivity of 304 stainless steel is 617,000 S/m.
Figure 2. The calculation domain and mesh in Maxwell.
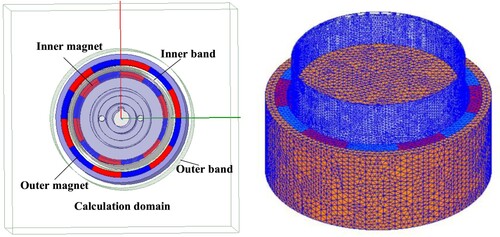
Table 1. The size about the magnetic coupling.
depicts the computational domain utilized in Fluent. In Figure (a), the mainstream gas is employed to drives the gas turbine, while a portion of the gas is directed towards removing heat from the magnetic-thermal zone, flowing through the inlet hole located at the bearing seat. In Figure (b), the eddy current heat is removed through the outer surface of the isolation cover by the outside air. Figure (c) and (d) illustrate the grid distribution of the calculation domain, and the mesh is refined near the isolation enclosure. The velocity inlet boundary and pressure outlet boundary are utilized as boundary conditions. For internal cooling gas, the mass flow rate is 10.8 kg/h, the temperature is 300 K at velocity inlet, and the pressure value is 200,000 Pa at pressure outlet. The temperature for cooling air is 300 K, and the pressure value is 101,325 Pa. Mesh motion method is employed to achieve the rotation of the inner and outer rotator with a speed of 1500 rpm. Further details regarding solver settings can be found in (Kandil & Abdelghany, Citation2015).
Figure 3. The fluid domain and calculation grid.
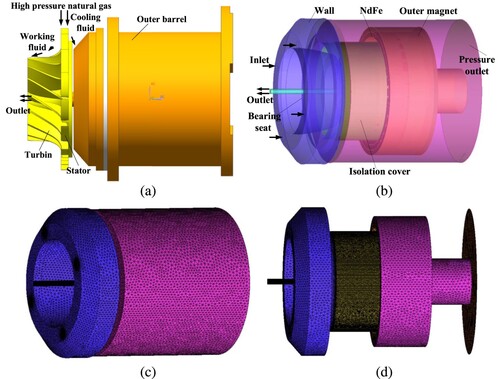
Table 2. Parameter settings for flow field calculation.
2.3. Governing equations
The fundamental governing equation for the calculation of the electromagnetic field is the Maxwell equation (Ern & Guermond, Citation2018):
(1)
(1)
In this formula, H is the magnetic field strength, J is the current densities, E is the electric field intensity, B is the magnetic induction intensity, D is the electric displacement vector, and ρ is the free electron density.
Besides, a medium is needed to satisfy the general relationship described above.
(2)
(2)
Where ϵ is the dielectric constant of the medium, µ is the permeability of the medium, and σ is the conductivity of the medium.
The flow field in the cooling circular passage is calculated using the following formula (Mao et al., Citation2022):
The continuity equation of a fluid flow:
(3)
(3)
The equation of momentum balance:
(4)
(4)
Where,
are the velocity components,
is the air density,
is the air pressure,
is the dynamic viscosity, and
is time.
The equation of RNG turbulence:
(5)
(5)
(6)
(6)
Where k is the turbulence kinetic energy,
is the turbulence dissipation rate,
is the location component,
is the turbulence kinetic energy generation rate,
is the effective reverse Prandtl number,
is the effective viscosity coefficient, c is a constant.
The equation of energy:
(7)
(7)
Where T is the temperature, cp is the specific heat capacity, ST is the internal heat source induced by Ohmic loss.
2.4. Grid independence analyzes and experimental variation
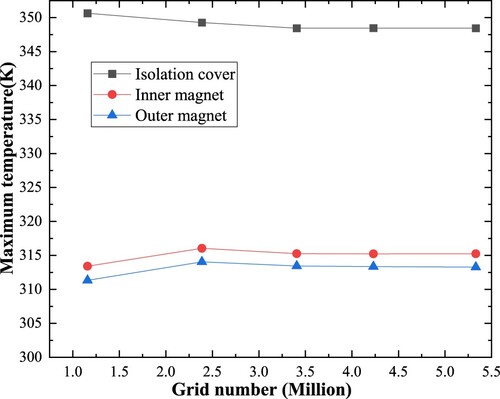
The grid independence analysis, presented in , aims to assess the impact of grid resolution on simulation accuracy. The grid number is varied from 1,158,034 to 5,330,695, approximately 5 times larger. By comparing the calculation result with experimental values in reference (Zhangyu, Citation2013), it is observed that the maximum temperature remains unchanged when the grid number reaches 3,406,866. Additionally, the simulated eddy current heat is determined to be 179.6 W, whereas the experimental result stands at 193.1 W. This indicates that the calculation results basically consistent with the experimental value and the relative error is 6.99%. Thus, the grid having 3,406,866 elements is selected as the calculation mesh.
Figure 4. The calculated temperature under different grid numbers.
In order to enhance the accuracy of temperature field calculations, a comprehensive experimental setup is devised, as depicted in , to investigate the thermal effects of the isolation cover. This setup comprises an electronic motor, a rotation speed transducer, an inner magnet, an outer magnet, an isolation cover, and an electric generator. As illustrated in Figure (a), the inner magnet is set in rotational motion through the driving force of the electronic motor. Furthermore, it imparts motion to the outer magnet via magnetic forces, thus driving the electric generator. Figure (b) showcases the utilization of the Uti320E professional thermal imager for assessing the temperature distribution induced by the varying magnetic field within the isolation cover. It should be noted that the thermal imager exhibits a 2% margin of error in temperature measurements. The rotation speed is accurately measured by the revolution speed transducer, which possesses a precision of 0.3%. The test results reveal that a high-temperature zone emerges within the magnet transmission zone, while relatively lower temperatures are observed at both ends of the isolation cover. This disparity can be attributed to the fact that the changing magnetic field elevates the temperature in the magnet transmission zone, resulting in a temperature increment of 64.08°C at 1500 rpm. Conversely, the ambient air acts to decrease the temperature at the two ends of the isolation cover.
Figure 5. Temperature distribution of isolation cover at 1500 rpm.
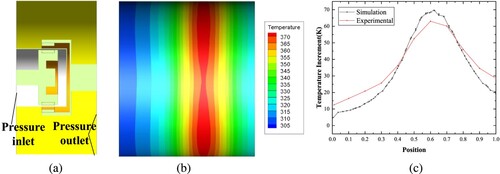
demonstrates the simulation model and the calculation results of the magnet coupling. The pressure inlet and pressure outlet are listed as the outer boundary conditions, and the parameter settings are described in . The distribution of simulated temperature is the same as experimental results, that obtain a high temperature at the magnetic transmission zone and has a lower temperature at the two ends of the isolation cover in Figure (b). When comparing the temperature increment of the simulation and the experimental results (see Figure (c)), we note that the experimental value is lower than the simulated result (71.5°C) at the power transmission zone, since the boundary of the rotation shaft and the isolation cover can’t avoid heat dissipation in the experimental setup. The simulated temperature at two both ends of the isolation cover is slightly lower than the experimental value since the boundary temperature is set as the environmental value without considering the heat effect of eddy current loss. However, the temperature increment of the isolation cover shows a similar tendency to the experimental result, which gradually increases from the right end of the isolation cover, reaches the peak value at the magnetic transmission zone, and then decreases to the left end. Hence, the temperature difference between experimental and simulation at the magnetic transmission zone is 11.60%. It indicates that the simulation method is feasible and its precision meets the needs of engineering simulations.
Figure 6. Numerical simulation of the thermal effecting.
3. Numerical simulation of the overall characteristics
3.1. Magnetic field at different rotation speeds
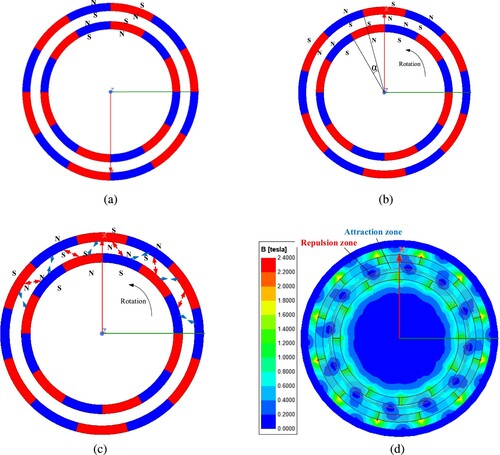
illustrates the operational conditions of the magnet coupling. Initially, in Figure (a), the N poles of the inner magnet are positioned opposite to the S pole of the outer magnet, resulting in a static state of the magnet coupling. Subsequently, as depicted Figure (b), when the inner magnet is set in motion, it imparts rotational movement to the outer magnets. Under the influence of the magnetic force, a fixed deflection angle α emerges and remains constant throughout the rotation process. The outer magnet blocks are subjected to the attraction force and repulsion force at the front ends and rear ends respectively shown in (c). This originates a difference in magnetic induction intensity, having higher values at the attraction zones and lower values at the repulsion zones shown in (d). Examining the magnetic distribution in Figure (d), it is evident that the maximum magnetic induction intensity materializes at the junction of the adjacent magnets and the cylindrical yoke. This maximum value reaches a magnitude of 2.4 T. This phenomenon can be attributed to the fact that the outer conductor has a higher magnetic permeability compared to air. Consequently, the magnetic induction lines emitted by N poles find it easier to reach the S poles, resulting in a higher magnetic induction intensity.
Figure 7. Operation conditions of the magnetic coupling.
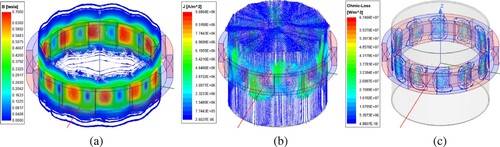
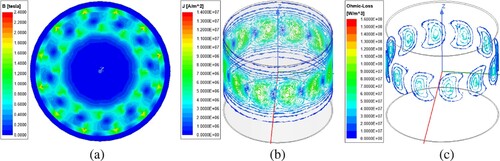
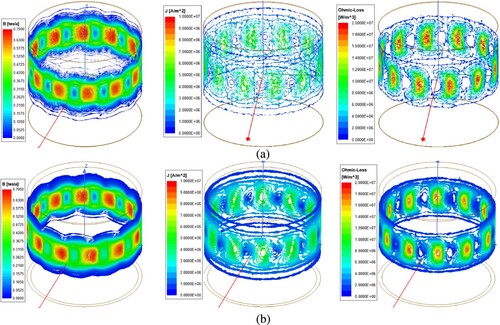
When the magnetic coupling is acting, the magnetic flux through the isolation cover changes because the magnetic induction intensity is different at attraction zones and repulsion zones. By Faraday's law, the induced currents are generated at the isolation cover. The temperature of the metal isolation cover is increased due to the heating effect of the current causing energy loss. These currents are called the ‘induced eddy current’, and the thermal loss is called the ‘eddy current loss’. demonstrates a snapshot (at a random time instance) of the eddy current losses in the magnetic transmission zone. Within the inner rotor, a single magnetic block is positioned between two outer magnetic blocks. In the direction of rotation, the front block provides resistance while the rear block exerts tension on this particular magnetic block. At the regions where two magnets repel each other, there is a lower density of magnetic field lines passing through the isolation cover. Conversely, at the attraction zone, a higher density of magnetic field lines traverses the isolation cover. Therefore, the magnetic induction intensity value is high at attraction and is low at the repulsive region, and 12 pairs of high and low magnetic induction intensity zones appears at the isolation cover in Figure (a). In order to facilitate the analysis of the induced eddy current, the magnetic rotors can be treated as stationary components, while the isolation cover rotates and intersects the magnetic field lines in the opposite direction. Due to electromagnetic induction effect, the induced eddy current is generated in the isolation cover shown in Figure (b), and the high induced currents occur at the high induction intensity zones. Because the magnetic induction line direction is opposite in adjacent two high magnetic induction areas, the high induced current direction is different and the distribution characteristics of eddy current loss is finally formed in Figure (c).
Figure 8. The generation of eddy current loss at 1500 rpm.
3.2. The eddy current heat transfer characteristics
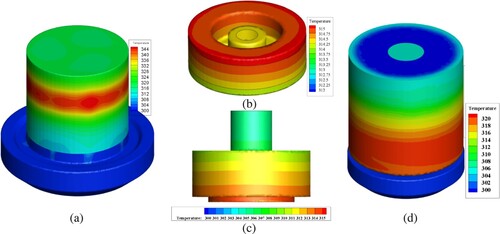
By utilizing the one-way coupled method in Fluent, the overall temperature distribution of the magnet couplings is determined by incorporating the calculated loss. In , the internal cooling air is maintained at a temperature of 300K, with a flow rate of 10.8kg/h. The results reveal that the power transmission region serves as the primary source of heat generation. Notably, a distinct high-temperature region emerges, reaching up to 344K at 1500 rpm in Figure (a)–(c) present the temperature of inner rotor and outer rotor, and their temperature change from 314 to 315 K and 305 to 315 K, respectively. Because of the thermal insulation effects of cooling gas, the temperature of magnetic rotors is lower than the temperature of isolation cover. For the outer wall in Figure (d), the temperature is high at end of outer cooling channel resulting from the long distance from the air flow inlet.
Figure 9. Temperature distribution of the magnet coupling at 1500 rpm.
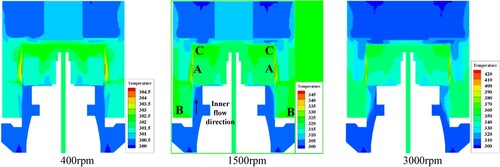
illustrates the overall temperature field and heat transfer characteristics of the isolation cover at 1500rpm. In Figure (a), the internal gas and external air effectively prevent excessive temperature rise and offer a protective effect against thermal demagnetization at the magnetic transmission zone through efficient heat exchange. The eddy current losses cause localized temperature elevation near the magnetic zone, denoted as point A. Additionally, the temperature of the external air (point B) and internal air (point C) also increases due to the heat generated by the eddy current losses. Moving along the axial direction, the dissipated eddy current losses contribute to a gradual increase in temperature, culminating at the magnetic transmission zone.
Figure 10. Heat transfer characteristics of the isolation cover at 1500 rpm.
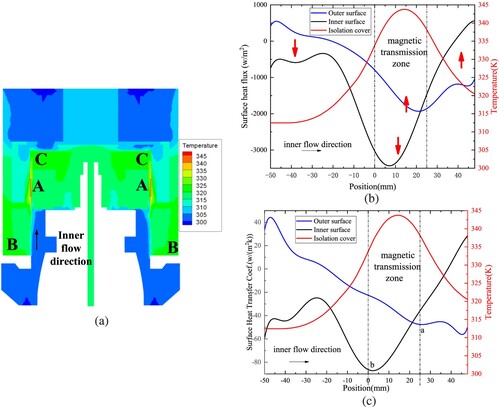
The specific surface heat flux can be seen in Figure (b). Since the temperature of the isolation cover is significantly higher than that of gas on both sides, therefore, the heat flux is significantly transferred from the isolation cover to the gas on both sides of the magnetic transmission zone. At point C, the isolation shell releases the heat from the internal surface to the outer one, since the internal gas is hotter than the outer air. Similarly, at point B, the outer surface flux is positive and the internal surface flux is negative, demonstrating that the heat is transferred from the outer air to the internal (colder) gas.
Figure (c) shows the simulated heat transfer coefficient at 1500 rpm. It has a similar distribution characteristic as the surface heat flux. Since the cooling gas has a higher temperature difference at the two ends of the magnetic transmission region, the outer surface heat transfer coefficient has a relatively high value at point a and the internal surface heat transfer coefficient has a maximum value at point b. Hence, it proves that the magnetic transmission zone near the magnetic block is the main region for eddy current loss dissipating because of the high surface heat flux and efficiency.
3.3. The effects of rotation speed
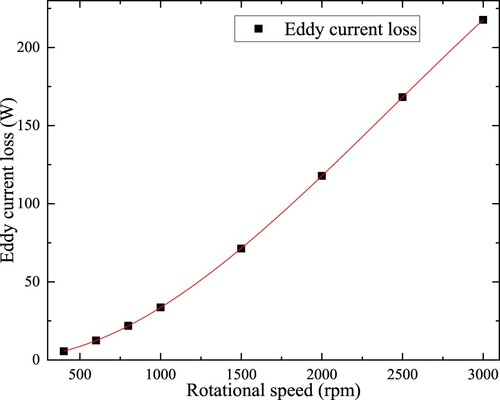
When the rotational speed changes from 400 to 3000 rpm, the eddy current loss increases from 5.56 to 217.69 W in . For larger rotation rates, the isolation cover is influenced by higher frequencies of the rotating magnetic field, causing stronger eddy currents and, hence, producing more energy loss.
Figure 11. The relationship between eddy current loss and the rotation speed.
The magnetic induction intensity is directly influenced by the material properties and geometric dimensions of magnetic blocks including the residual magnetism of permanent magnets, the number of magnetic poles, and the size and arrangement of magnetic blocks. To further investigate the influence of rotation speed, since the structure and properties of magnetic blocks are not changed, thus, the distribution of the magnetic field remains unchanged under different speeds in Figures and . Therefore, the distribution of the induced current and the associated eddy current loss exhibits no variations since the magnetic field distribution remains unaltered (Figure (b) and (c)). However, it is important to note that at higher speeds, both the induced current and the eddy current loss experience a significant increase. Specifically, when the rotational speed escalates from 400 to 3000 rpm, the maximum induced current value is increased from 2.6 × 10⁶ to 1.4 × 10⁷ A/m2 and the maximum Ohmic loss is increased from 5 × 10⁶ to 1.6 × 10⁸W/m2. Results shows that the increasing rotation speeds will cause an increase in induced current value and further increase the total loss value.
Figure 12. The eddy current loss distribution at 400 rpm.
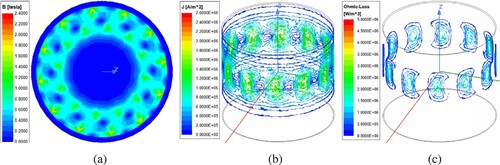
Figure 13. The eddy current loss distribution at 3000 rpm.
In , the temperature distribution of the magnetic coupling at various speeds is displayed. Upon comparing the rotation speeds of 400 and 3000 rpm, it is apparent that the overall temperature distribution characteristic remains largely unaltered. The maximum temperature continues to manifest at the magnetic transmission zone, while two relatively warm zones appear at the corners of the outer wall and the isolation cover. However, it is important to highlight that the overall temperature value at 3000 rpm is higher, primarily due to the escalated magnitude of the eddy current loss.
Figure 14. Temperature distribution at different rotating speeds.
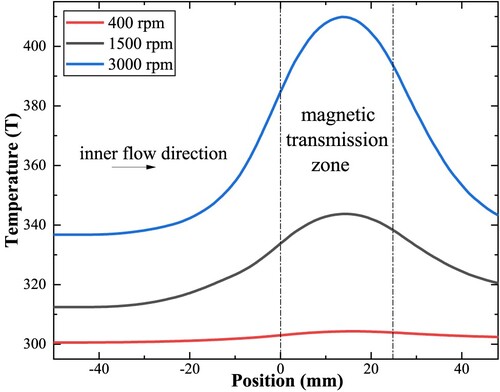
When the rotational speed increases from 400 to 3000 rpm, the maximum temperature of the isolation cover, inner magnet and external magnet are linearly increased from to 304.64 to 422.16 K, 301.21 to 341.24 K, and 301.48 to 328.12 K, respectively in . shows the temperature distribution of isolation enclosure alone the axial direction, the maximum temperature appears at the magnet transmission zone because it has a significant change in magnetic field causing a higher eddy current loss. Comparing the temperature at different, a more distinct temperature difference occurs at 3000 rpm changing from 336.74 to 409.87 K due to a high loss value.
Figure 15. Maximum temperature at different speeds.
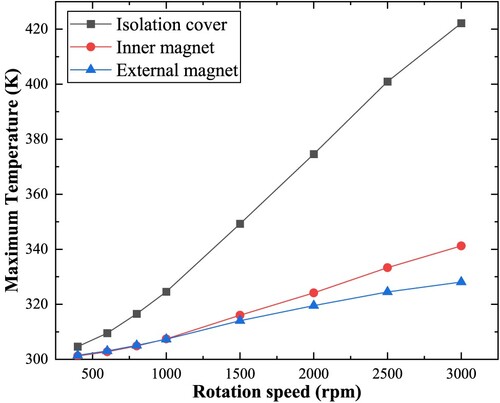
Figure 16. Temperature distribution of the isolation cover.
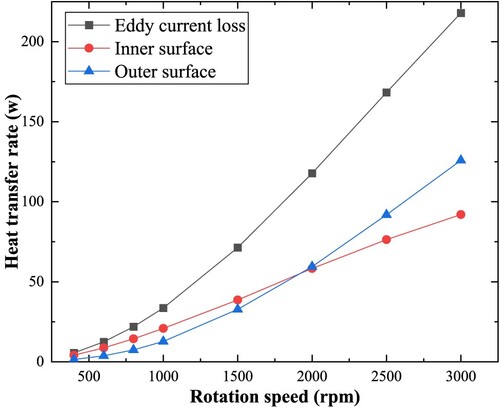
demonstrates the heat transfer magnitude from the surface of the isolation cover. As the rotation speed transitions from 400 to 3000 rpm, the dissipated heat transferred from the inner surface escalates from 4.16 to 92.01 W, while the extracted heat transferred from the outer surface changes from 1.44 to 125.90 W. Notably, when the rotation speed exceeds 2000 rpm, the heat dissipation from the outer surface surpasses that from the internal surface. This occurrence can be attributed to the larger size of the outer rotor, which enhances the heat exchange efficiency at higher speeds.
Figure 17. Heat transfer amount changes with rotation speed.
4. The eddy current heat dissipation at different working conditions
4.1. The effect of isolation cover thickness
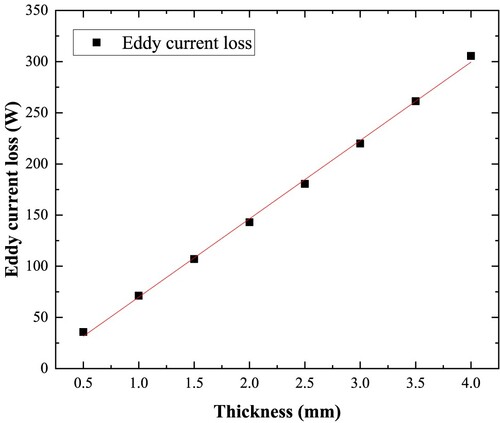
illustrates the eddy current loss at different isolation cover thicknesses. When the thickness is changed from 0.5 to 4 mm, the eddy current loss is linearly increased from 35.72 to 305.58W.
Figure 18. The effect of enclosure thickness on eddy current loss.
shows the eddy current generation at different isolation cover. Because the structure of isolation cover is not modified, the distribution characteristics of the magnetic flux density and the induced current intensity are not changed. However, the regions affected by the alternating magnetic fields increase which can significantly increase the Ohmic loss value.
Figure 19. Eddy current loss at different enclosure thicknesses.
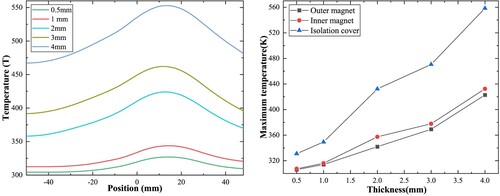
illustrates the thermal field variations across different wall thicknesses at 1500 rpm. As the thickness is altered from 0.5 to 4 mm, the overall temperature exhibits a significant rise, with the maximum temperature increasing from 331.00 to 558.46 K. This escalation can be attributed to the concurrent increase in eddy current values. Consequently, it is advisable to minimize the thickness of the isolation cover while ensuring it retains sufficient strength, as this approach helps control the temperature rise effectively.
Figure 20. Temperature distribution at different thickness.
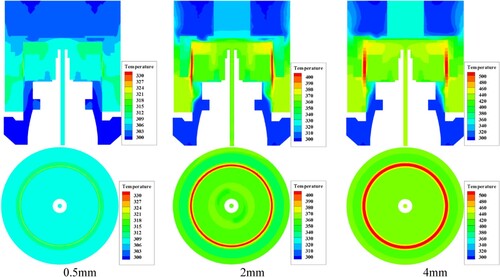
shows the temperature of isolation cover under different isolation thickness, and a thicker isolation cover can bring more eddy current loss and increase the overall temperature value of the magnet coupling. When the thickness is 4 mm, the maximum temperature of the inner magnet and the outer magnet is 432.42 K and 422.88 K, respectively, which is lower than the admissible temperature of Nd2Fe14B because the inner and outer cooling fluids remove the heat from the isolation cover surface.
Figure 21. The temperature of the isolation cover under different thickness.
4.2. The influence of material property
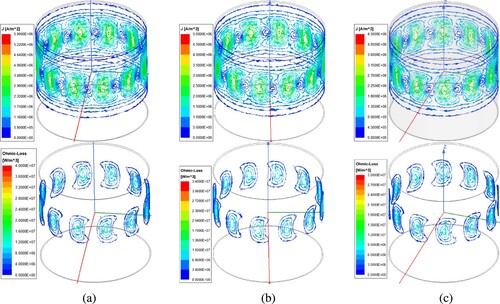
The effects of different materials on induction current and eddy current loss distributions are given in Figure . Due to the unchanged magnetically structural, the distributions of induced current and eddy current loss are not changed except for the values. The electrical conductivities of stainless steel, 718 alloy, Hastelloy C, and Ti-6AL-4V materials are 1,389,000, 834,475, 719,420, and 625,000 siemens/m, and the calculated eddy current losses values at 1500 rpm are 71.36, 42.89 W, and 37.19 , 32.12 W, respectively.
Figure 22. The effects of materials on eddy current loss.
The findings depicted in indicate that the three alternative materials exhibit lower overall temperature values compared to stainless steel. This discrepancy can be attributed to their lower eddy current losses. Specifically, the high-temperature zones observed in Hastelloy C and Ti-6AL-4V are less pronounced due to their low eddy current loss values. These results further highlight the influence of the isolation enclosure material on the magnitude of eddy current losses. It is evident that a material with lower bulk conductivity can significantly reduce the eddy current value, thereby positively impacting the overall temperature distribution.
Figure 23. The temperature distribution of different materials.
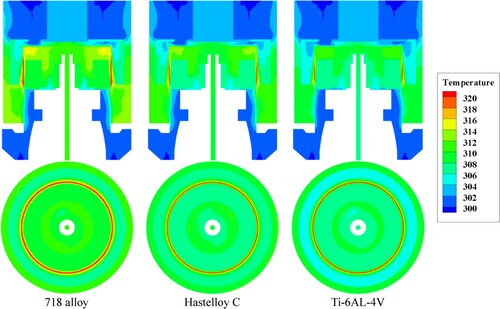
shows the temperature distribution alone the axial direction. The maximum temperature of Hastelloy C and Ti-6AL-4V are obviously lower than stainless steel and 718 alloy due to the lower eddy current loss. Because Hastelloy C has a higher thermal conductivity than the other three materials in , more eddy current loss is conducted from the magnet transmission zone to the entire isolation cover, thus setting its maximum temperature is same as Ti-6AL-4V. Comparing the results in , the maximum temperature of inner magnet, outer magnet and the isolation cover of Ti-6AL-4V are 306.84 K, 305.81 and 325.45 and it is regarded as a perfectly material due to a lower eddy current loss.
Figure 24. Temperature distribution alone axial direction.
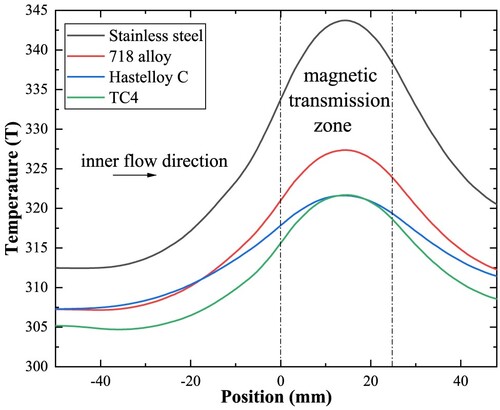
Table 3. The maximum temperature of main components.
4.3. The internal flow rate on heat transfer enhancement
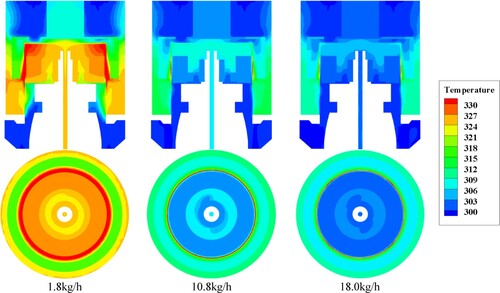
The temperature distributions at different flow rates are given in . Compared to the 1.8 kg/h conditions, the overall temperature of flow fluid reduces at 10.8 and 18.0 kg/h because a higher flow rate can effectively remove the heat from the isolation cover.
Figure 25. The temperature distribution at different cooling rates.
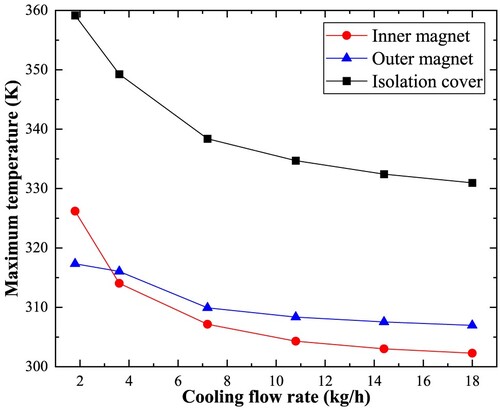
illustrates the temperature distribution of isolation cover. When the cooling flow rate increases from 1.8 to 18 kg/h, the maximum temperature of the isolation cover, the inner magnet and outer magnet reduce from 353.944 to 326.49 K, 326.20 to 302.28 K, 317.33 to 306.95 K, respectively in . Therefore, increasing the internal cooling flow can significantly decrease the temperature of magnetic coupling.
Figure 26. Temperature distribution alone axial direction.
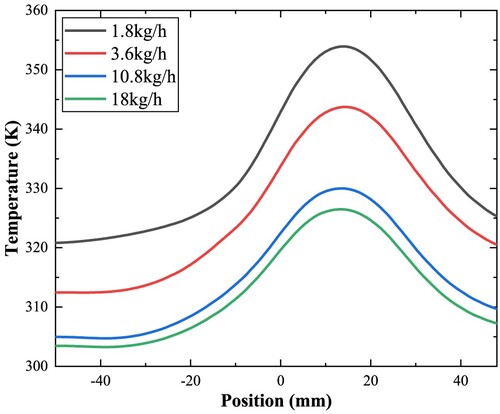
Figure 27. The variation of maximum temperature.
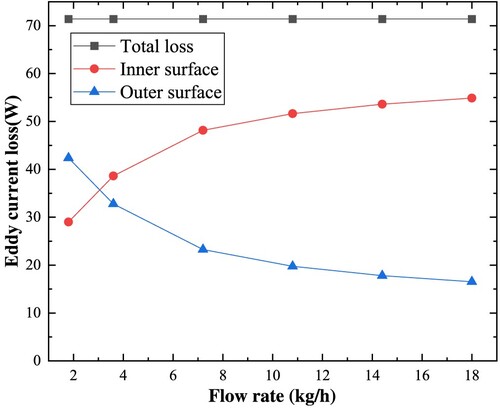
In , it can be observed that as the flow rate increases, the dissipation heat from the inner surface gradually rises, while the heat transferred from the outer surface exhibits a decline tendency. Once the flow rate surpasses 10.8 kg/h, the heat flux has no significant changes, and the impact of the flow rate on heat dissipation diminishes as well. Therefore, a judicious increase in the internal flow rate proves advantageous in lowering the temperature of the magnetic coupling.
Figure 28. Heat exchange amount at different flow rates.
5. Conclusions
The magnetic coupling serves as a crucial power transmission element in the natural gas pressure energy recovery device, ensuring the prevention of gas leakage. To investigate the physical properties associated with the magnetic field and thermal field, a one-way coupling approach is employed, simulating the system using the Maxwell and Fluent software. Various parameters, including rotation speed, thickness and material of the isolation cover, and internal cooling rate, are examined to gain a comprehensive understanding of the generation and dissipation of eddy current losses. The primary sources of funding for this research are detailed below:
In this paper, 12 pairs of high and low magnetic induction intensity zones affected by the attraction and repulsion of the magnetic force appear at the isolation cover which generates the induced current and resulting the formation of eddy current loss. It indicates that the power transmission region is the main heat generation zone, and a distinct high-temperature region appears which can reach to 344 K at 1500 rpm when the temperature of internal cooling air is 300 K and the flow rate is 10.8 kg/h.
When the rotational speed changes from 400 to 3000 rpm, the maximum induced current value is increased from 2.6 × 10⁶ to 1.4 × 10⁷ A/m2, the maximum Ohmic dissipation is increased from 5 × 10⁶ to 1.6 × 10⁸ W/m2. Results show that increasing rotation speed causes an increase in induced current value and further increase of the total loss.
Although the magnetic flux density and the induced current intensity are not changed under different thicknesses of isolation cover, the regions affected by the alternating magnetic fields increase which can significantly increase the Ohmic loss value. And the maximum temperature of isolation cover is increased from 331.00 to 558.46 K when the thickness is changed from 0.5 to 4 mm.
Reducing the bulk conductivity of isolation enclosure material can decrease eddy current loss, Ti-6Al-4V is regarded as a preferable material in comparison with the other three materials to reduce temperature rising effect. Besides, increasing the internal cooling flow can significantly decrease the temperature of magnetic coupling and avoid the temperature demagnetization.
Acknowledgments
The authors acknowledge financial support from the National Key Research and Development Program of China (2019YFE0122000) and the project funded by the Foundation of Southeast of University (3203002105C3 104.205.2.5). We thank the Big Data Computing Center of Southeast University for providing the facility support on the numerical calculations in this paper. This study received support from the China Scholarship Council.
Disclosure statement
No potential conflict of interest was reported by the author(s).
Additional information
Funding
References
- Abdolkhani, A., & Hu, A. P. (2011, November). A novel detached magnetic coupling structure for contactless power transfer. In IECON 2011-37th Annual Conference of the IEEE Industrial Electronics Society (pp. 1103–1108). IEEE.
- Bo, Z., Jibin, Z., & Wenjuan, Q. (2010, October). Magnetic-thermal element sequential coupling algorithm in the application of permanent magnet generator temperature analysis. In 2010 International Conference on Electrical Machines and Systems (pp. 1804–1808). IEEE.
- Cai, C., Wang, J., Hu, M., Long, M., & Zhou, Y. (2017). Electromagnetic properties of cylinder permanent magnet eddy current coupling. International Journal of Applied Electromagnetics and Mechanics, 54(4), 655–671. https://doi.org/10.3233/JAE-170006
- Cao, Y., Li, X., & Liu, W. (2020, May). The analysis of thermal magnetic coupling of tubular permanent magnetic coupler. In Journal of Physics: Conference Series (Vol. 1550, No. 4, p. 042044). IOP Publishing.
- Cheng, G., Song, D., Wang, P., & Chen, J. (2023). Temperature calculation, test and structure improvement of magnetic coupling under high slip. Energies, 16(5), 2398. https://doi.org/10.3390/en16052398
- Dumont, O., Dickes, R., & Lemort, V. (2017). Experimental investigation of four volumetric expanders. Energy Procedia, 129, 859–866. https://doi.org/10.1016/j.egypro.2017.09.206
- Ern, A., & Guermond, J.-L. (2018). Analysis of the edge finite element approximation of the Maxwell equations with low regularity solutions. Computers & Mathematics with Applications, 75(3), 918–932. https://doi.org/10.1016/j.camwa.2017.10.017
- Gamez-Montero, P., Salazar, E., Castilla, R., Freire, J., Khamashta, M., & Codina, E. (2009). Misalignment effects on the load capacity of a hydraulic cylinder. International Journal of Mechanical Sciences, 51(2), 105–113. https://doi.org/10.1016/j.ijmecsci.2009.01.001
- Han, C., Zhang, H., & Zhang, J. (2015). Structural design and sealing performance analysis of biomimetic sealing ring. Applied Bionics and Biomechanics, 2015, 11. Article ID 358417, https://doi.org/10.1155/2015/358417
- Kandil, H. A., & Abdelghany, S. T. (2015). Computational investigation of different effects on the performance of the Ranque–Hilsch vortex tube. Energy, 84, 207–218. https://doi.org/10.1016/j.energy.2015.02.089
- Kou, Z., Tan, Q., He, F., Zheng, F., Ma, X., & Wang, C. (2009, August). Analysis of eddy current loss in axial permanent magnet coupling. In 2009 International Conference on Mechatronics and Automation (pp. 1947–1951). IEEE.
- Mao, Y., Guo, W., Cai, L., Wu, T., & Zhu, H. (2022). Numerical simulation of the pressure distribution in the ventilating channels with a mixed flow fan. International Communications in Heat and Mass Transfer, 135, 106105. https://doi.org/10.1016/j.icheatmasstransfer.2022.106105
- Shi, G., Tong, D., Xia, Y., Jia, S., Chang, J., Li, Q., Wang, X., Xia, H., & Ye, Y. (2022). A piezoelectric vibration energy harvester for multi-directional and ultra-low frequency waves with magnetic coupling driven by rotating balls. Applied Energy, 310, 118511. https://doi.org/10.1016/j.apenergy.2021.118511
- Sun, X., Liu, H., Duan, X., Guo, H., Li, Y., Qiao, J., Liu, Q., & Liu, J. (2022). Effect of hydrogen enrichment on the flame propagation, emissions formation and energy balance of the natural gas spark ignition engine. Fuel, 307, 121843. https://doi.org/10.1016/j.fuel.2021.121843
- Wang, L., Jia, Z., Zhu, Y., & Zhang, L. (2019). Flow field and temperature field of water-cooling-type magnetic coupling. Chinese Journal of Mechanical Engineering, 32(1), 1–12. https://doi.org/10.1186/s10033-018-0313-7
- Yu, W., Wen, K., Min, Y., He, L., Huang, W., & Gong, J. (2018). A methodology to quantify the gas supply capacity of natural gas transmission pipeline system using reliability theory. Reliability Engineering & System Safety, 175, 128–141. https://doi.org/10.1016/j.ress.2018.03.007
- Yuan, D., & Wang, L. (2011, April). Finite element analysis of eddy current field of magnetic coupling with Halbach array. In 2011 International Conference on Consumer Electronics, Communications and Networks (CECNet) (pp. 354–357). IEEE.
- Zhang, H. J., Du, X. F., & Li, B. (2012). Study on the eddy current loss characteristic of the coaxial cylinder style magnetic coupler. Applied Mechanics and Materials, 151, 41–46. https://doi.org/10.4028/www.scientific.net/AMM.151.41
- Zhang, J., & Xie, J. (2018). Investigation of static and dynamic seal performances of a rubber O-ring. Journal of Tribology, 140(4), 042202. https://doi.org/10.1115/1.4038959
- Zhangyu. (2013). Magnetic coupling design and eddy current loss research. Zhejiang University.
- Zheng, D., Wang, D., Li, S., Zhang, H., Yu, L., & Li, Z. (2018). Electromagnetic-thermal model for improved axial-flux eddy current couplings with combine rectangle-shaped magnets. IEEE Access, 6, 26383–26390. https://doi.org/10.1109/ACCESS.2018.2835469
- Zhenjun, G., Zhang, J., Wenyang, L. I., Jintao, L. I., Changqing, S. I., Feng, H. O., Jianrui, L. I., & Xiaotao, S. H. (2021). The flow-heat coupling study of cooling circulating channel of magnetic drive pump. Mechanics, 27(4), 285–294. https://doi.org/10.5755/j02.mech.29651
- Zhou, K., Li, F., Cai, H., Jing, Y., Zhuang, J., Li, M., & Xing, Z. (2022). Estimation of the natural gas leakage source with different monitoring sensor networks in an underground utility Tunnel: From the perspectives of energy security. Energy and Buildings, 254, 111645. https://doi.org/10.1016/j.enbuild.2021.111645
- Zhu, Z., & Meng, Z. (2016). 3D analysis of eddy current loss in the permanent magnet coupling. Review of Scientific Instruments, 87(7), 074701. https://doi.org/10.1063/1.4954970