
 ?Mathematical formulae have been encoded as MathML and are displayed in this HTML version using MathJax in order to improve their display. Uncheck the box to turn MathJax off. This feature requires Javascript. Click on a formula to zoom.
Abstract
A sudden angle change between the Y-shaped diversion channel and the inlet tank of the circular pump station often leads to boundary layer separation and large vortex formation. These flow patterns can cause significant sediment deposition in sediment-laden rivers, reducing pump efficiency. A mixture model is introduced to describe water-sediment two-phase flows. Simulation results analyze vortex characteristics and formation mechanisms, and evaluate potential sediment deposition areas. Without rectification, vortex areas cause significant sediment migration towards the sidewalls of the Y-shaped diversion channel and pump inlet. Diversion measures like sills and pressure plates are introduced to reduce flow vortices. Results show that sills generally optimize flow structures. Sills in the main Y-shaped diversion channel outperform those in other channels in terms of optimization. Pressure plates also optimize flow structures. Vortex structure and position are closely related to the distance between the pressure plate and the circular intake tank. Optimized measures with pressure plates significantly reduce the flow deviation angle and improve flow velocity uniformity. Numerical simulation accuracy is validated through experiments. Results reveal the formation mechanism of adverse vortices and their sedimentation effects, which are detrimental to pump stations. The proposed rectification scheme provides theoretical support for optimizing pump station operation.
1. Introduction
In modern water conservancy engineering, pumping stations are very important components and are widely used in industrial and agricultural production, urban water supply (Gong et al., Citation2022), environmental protection, and other applications (Feng et al., Citation2018). The construction of large pumping stations plays an indispensable role in average water resource allocation and improving water resource utilization efficiency. However, over time, the operational efficiency of pumping stations has gradually increased and are influenced by factors such as flow patterns, water quality, equipment, and operating conditions, resulting in many pumping stations not meeting the design standards for operational efficiency. The pump (Wang et al., Citation2023a) station is composed of inlet and outlet buildings, pump rooms, electrical equipment, and other devices. The forebay of the pump station serves as a building connecting the water diversion channel and the inlet tank, which plays a role in ensuring smooth and uniform flow of water into the inlet tank. Therefore, the flow pattern in the inlet tank directly affects the efficiency of the pump. However, due to factors such as inlet inertia and sudden changes in cross-section, turbulence is common, especially in the northwest region of China, where the Yellow River is the main irrigation river. As a large amount of sediment from the Yellow River flows into the forebay, the sedimentation and accumulation of sediment cause serious secondary interference to the flow pattern, which has a negative impact on pump operation and pump station maintenance. According to statistical data, in sandy rivers, the operating efficiency of most pumping stations is less than 60%, and that of some pumping stations are even lower than 30% (Song et al., Citation2021). Solving the problems of high energy consumption and low efficiency in pump station operation is highly important for reducing energy consumption and achieving low-carbon environmental protection goals (Chen et al., Citation2022).
The forebays and inlet tanks of pumping stations are prone to generating vortices, and their size, position, and strength characteristics significantly impact the overall flow pattern. The current main numerical calculation methods for flow state problems include various approaches. Tang et al. (Citation2010) applied the LBM-SGS model to the two-dimensional flow field analysis of the inlet pool of a forward pumping station and predicted the vortex flow state and hydrodynamic characteristics of the forebay. Dou et al. (Citation2010) used an orthogonal curve grid and finite volume method to simulate the flow pattern in a forward inlet pool, predicting the distribution of sediment deposition. Zhan et al. (Citation2012) used the RNG k-ε model, combining the turbulence model and the VOF model captured by the free water surface to predict the position of lateral vortices, noting certain differences in vortex intensity compared to experimental results. Zi et al. (Citation2016) simulated the forward inflow pool and proposed that the dimensionless y + grid in the computational domain should strictly meet the wall function requirements of 30–500 to effectively capture various vortex characteristics.
In muddy and sandy river flows, poor flow patterns in the inlet pool are prone to sediment accumulation, causing secondary effects on the vortex flow pattern and easily changing the flow direction of the mainstream area. Xu et al. (Citation2018) optimized the vortex flow pattern and reduced sediment deposition by combining numerical simulation with engineering experiments using a 45° water pressure plate. Fan et al. (Citation2023) conducted a study on the diffusion angle between the forward forebay and the inlet tank and found that when the diffusion angle is between 25° and 30°, the inflow is greater, which can improve the deterioration of the flow state caused by sediment deposition. Wang et al. (2023) conducted numerical simulations and engineering experiments on the two-phase flow of water and sediment in a certain forebay and inlet tank in the Ningxia region. The research results showed that adding baffles at the back of the inlet tank and combining them with guide piers can significantly weaken the horizontal vortex area, divert large vortices between the slope section and the inlet tank, weaken the reflux range, reduce sediment deposition, and improve the operational efficiency of the pumping station.
Regarding the research on the types of forebays, they are usually divided into forward and lateral forebays based on the direction of water flow. However, the structure of circular forebays is different from these two types. Due to design limitations, terrain fluctuations, and other factors, they are relatively rare in pumping stations. However, circular forebays have the advantages of simple construction and easy flow regulation. Therefore, they occupy a place in pumping stations in the middle and upper reaches of the Yellow River. When the water flows into two circular inlet tanks from the Y-shaped diversion channel, the diversion results in faster outer flow velocity and slower inner flow velocity. The uneven flow velocity causes vortices to appear at the connection between the diversion channel and the inlet tank. The disturbance of water and sediment flow patterns will inevitably affect the efficiency of pump stations. Additionally, the sediment accumulation in the circular forebay is all at the bottom of the tank, making dredging work relatively more difficult.
In summary, current scholars have made certain research achievements on the flow patterns inside forebays, but most of them have conducted more research on forward and lateral forebays and inlet tanks. Research on Y-shaped diversion channels and circular inlet tanks in terms of calculation methods and rectification optimization measures is lacking. The main reason is that their internal structure is complex, causing suspended sediment particles to be affected by the combined action of water flow turbulence and vortices, resulting in multimode movements such as settlement, rotation, rolling, and jumping. The optimization problem of flow patterns in a circular forebay is extremely rare. Therefore, we introduce a mixture model to describe the two-phase flow of water and sediment, explore the water flow characteristics and sediment transport relationship between a Y-shaped diversion channel and a circular inlet tank, and study more reasonable and effective rectification measures to optimize flow patterns, reduce sediment deposition, and improve the efficiency of pump station operation.
2. Description of the study area
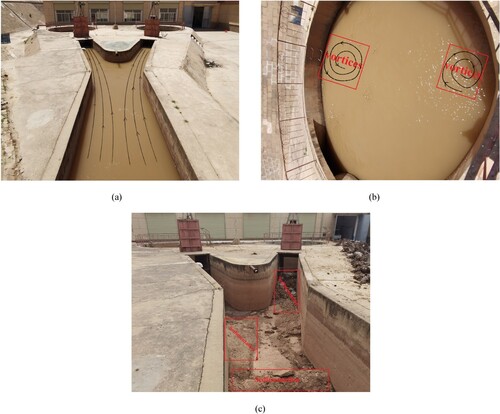
We focus on the research and analysis of a Y-shaped diversion channel and circular inlet tank pump station in Gansu Province, as depicted in Figure . The appearance of this structural watershed is primarily due to topographical constraints, leading to the following issues: (1) The unique conditions of the Y-shaped diversion channel result in uneven flow velocities; (2) Complex turbulent conditions within the inlet tank restrict pump inlet conditions; (3) The high sediment content of the Yellow River water leads to significant sedimentation and deposition in the Y-shaped diversion channel; (4) Pressure gradients and water level fluctuations affect the operation of the pump station. Addressing the above problems, we conduct analysis and research on issues such as water-sediment flow patterns, sediment deposition, and rectification measures in the research area.
Figure 1. Field conditions of the circular forebay: (a) illustrating the flow pattern in the Y-shaped diversion channel; (b) showing the location and direction of the vortex flow pattern in a circular inlet tank; (c) demonstrating sediment deposition in the Y-shaped diversion channel. These Figures were captured during the authors’ field research in 2022.
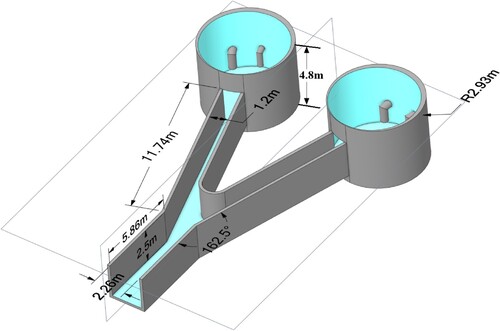
The circular forebays are mainly divided into circular inlet tanks and Y-shaped diversion channels. The inlet width of the Y-shaped diversion channel is 2.26 m, the width of the diversion channel is 1.2 m, the height inside the channel is 2.5 m, and the total length is 17.3 m. The circular inlet tank has a radius of 2.93 m and a height of 4.8 m. It is equipped with four pumping pumps, including two with a single unit flow rate of 1.82 m3/s and two with a single unit flow rate of 0.52 m3/s. The specific dimensions are shown in Figure .
Figure 2. Geometric dimensions of the circular forebay.
3. Methods
3.1. Governing equations
The sedimentation and accumulation of sediment in sandy rivers affect the flow pattern of water in the forebays of pumping stations by changing the terrain shape, which needs to be considered in mathematical models. The mixed phase model (Mixture) is selected to simulate the movement of sediment-laden water flow in the forebay (Manninen et al., Citation1996). This model describes the flow and suspended sediment movement by solving the continuity equation, momentum equation, energy equation, and volume fraction equation of each phase. It is suitable for the precise simulation of three-dimensional complex sediment-carrying water flow. The turbulence model uses the standard k-ε (Romero-Gomez et al., Citation2017) and has been extensively validated in reference (Wang et al., 2023).
The governing equations for water sediment two-phase flow include continuity equations (Xi & Lu, Citation2021) and momentum equations (Xu et al., Citation2020):
Continuity equation:
(1)
(1) Where
is the mixed density and
is the average mass velocity.
The mixed phase density is calculated by weighting each component in the mixture model and velocity
:
(2)
(2)
(3)
(3) Where
is the volume fraction of the k-th phase,
is the density of the k-th phase, and
is the velocity of the k-th phase. Momentum equation:
(4)
(4) In the formula, n is the number of phases,
is gravity,
is the volume force other than gravity,
is the mixed viscosity,
is the drift velocity of the k-th phase, and in this study, it is the sediment particle phase.
The finite volume method is used to discretize and solve the above governing equations. To ensure computational accuracy, a second-order upwind scheme is used for spatial discretization, a second-order implicit scheme is used for temporal discretization, and a simple algorithm based on a separation solver is used for velocity and pressure decoupling. For a detailed description and verification of the numerical methods, please refer to Wang et al. (Citation2022). Numerical calculations were performed on each scheme using OpenFOAM.
3.2. Grid division and boundary conditions
Based on the geometric characteristics of the circular forebay, a mixed method of structured and unstructured grids was used to divide the computational domain, as shown in Figure . The Y-shaped diversion channel, inlet, and circular inlet tank use unstructured grids, while the outlet of the pumping pump uses structured grids. To balance the efficiency and accuracy of grid computing, the hydraulic loss of water and sediment flowing through the forebay is used as grid evaluation criterion (Luo et al., Citation2015), as shown in equation Equation(5)(5)
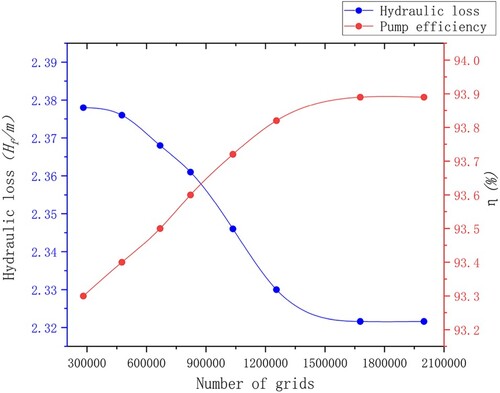
(5) . Convergence tests are conducted on 8 sets of grids with different resolutions, as shown in Figure , and a 1.67 million grid model is ultimately selected.
(5)
(5) Where
represents hydraulic loss;
is the inlet velocity;
is the exit velocity;
is the inlet static pressure;
is the outlet static pressure;
is the average import potential energy; and
is the average potential energy of the export.
Figure 3. Computational Grids.
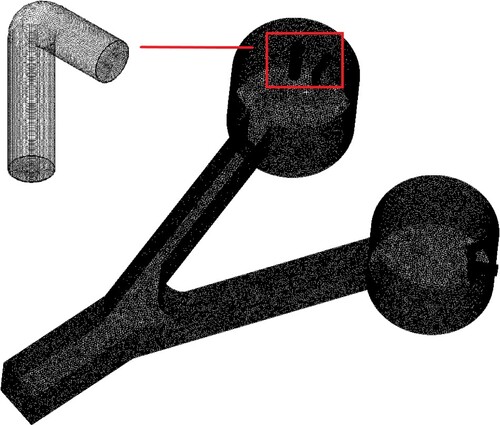
Figure 4. Hydraulic losses in circular forebays with different numbers of grids.
The inlet of the diversion channel is set as the mixed velocity inflow boundary in the calculation model (Xu et al., Citation2022), and the inflow velocity is set to 0.8 m/s based on the measurement results. The water pump outlet is set as a free flow boundary (Ahmed et al., Citation2021). The wall function method is used to handle solid boundaries (Shen et al., Citation2021), and the assumption of a free sliding rigid cover is adopted to handle the boundary of the free water surface (Kan et al., Citation2020).
3.3. Sediment content research
According to the measurement data of water volume and sediment inflow near the upstream diversion channel of the circular forebays in the Yellow River Basin for the past eight years (2013–2020), as shown in Table , we found that the main reason for sediment accumulation in the forebays of the pumping stations was the high sediment content in the diversion channel. Moreover, July to October are months with high sediment concentrations. Therefore, to analyse this issue more deeply, the average inflow sediment content of these four months is taken as 2.62 kg/m3. This simulation was conducted for a total of 110 days to study and analyse the changes in sediment content and flow patterns in the forebay under different flow velocities.
Table 1. Water and Sediment Statistics (2013–2020).
4. Numerical simulation results and discussion
4.1. Numerical simulation of the original operating conditions without rectification measures
According to the contents of Sections 2 and 3, the forebays of the circular pumping station are modelled and calculated. Using the SIMPLEC algorithm, the number of calculation steps is set to 106 days (the actual operating time of the pumping station from July to October 2022), with a total of , and every 10 s is a step, with a total of
steps. The bottom of the Y-shaped diversion channel is set as the y1 section, and 0.5 m is extended upwards as the y2 section. The three-dimensional calculation results are shown in Figure , and the extracted cross-sectional calculation results are shown in Figure .
Figure 5. Three-dimensional distribution of the flow field in the circular forebay: (a) top view; (b) bottom view.
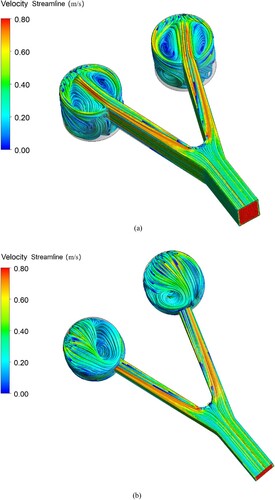
Figure 6. Distribution of streamlines and sediment content in various cross-sections: (a) y2 cross-section; (b) y1 cross-section.
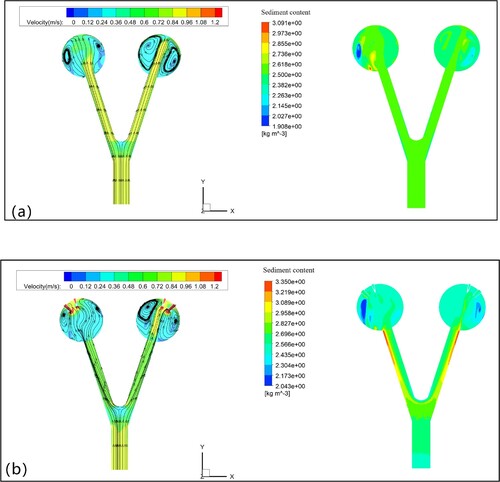
Two asymmetric shallow water plane vortices are formed in each circular inlet tank, gradually decreasing from top to bottom. The vortex area occupies a large part of the circular inlet tank. According to calculations, the y2 section vortex area accounts for 75% of the total circular area, while the y1 section vortex area accounts for 62% of the total circular area. The vortex height is approximately 95% of the water depth, resulting in a significant decrease in the pumping efficiency of the pump station. The flow pattern in the Y-shaped diversion channel is relatively smooth, but there is turbulence in the flow pattern near the edge wall area of the circular inlet tank. Sediment content analysis: The sediment content in the circular inlet tank increases from top to bottom, and the siltation area is mainly concentrated near the edge wall of the circular inlet tank, with the highest content reaching 3.350 kg/m3. Due to the depth of the circular inlet tank, the sediment content in sections y1 and y2 is not very high. However, due to the presence of vortices, there are more suspended sediment particles at this location.
The mixed flow of water and sand flows from the Y-shaped diversion channel into the circular inlet tank. Due to the high flow velocity in the mainstream area and the short diffusion section, the inertia causes it to collide with the Y-shaped rear wall pier, causing the mixed flow to separate and form two different flow velocities in different directions. In the Y-shaped diversion section, due to the narrowing of the boundary layer of the diversion channel and the frictional force on the sidewall, the flow velocity in the sidewall area decreases, and the sediment content increases before entering the circular inlet tank. The main flow velocity of the diversion channel far from the wall area is relatively high. When the water flow in this section collides with the back wall of the circular inlet tank, two large vortex areas are formed, and a reverse force is generated to collide with the slower water flow entering from the Y-shaped diversion channel wall. Therefore, once again reducing the water flow velocity near the edge wall, the sediment content in this part increases again, and then the suspended sediment forms a clear settling trend, reducing the efficiency of the water pump.
4.2. Influence mechanism of the bottom sill on the flow pattern
As the name suggests, the bottom sill is usually set at the bottom of the forebay. Its main working principle is to cause vertical flipping and rolling of the water flow behind the bottom sill through the action of jet flow. The vertical flipping neutralizes the reflux or vortex in the plane, thereby destroying the turbulent state in the circular forebay. When setting the bottom sill, the ratio of the water depth to the height of the sill should be considered, and the post of the sill should be set up to eliminate the Karman vortex to achieve the best effect of improving the flow pattern of the forebay. In this simulation, a bottom sill is selected as the rectification measure. l is the distance from the water inlet of the diversion channel, L is the width of the Y-shaped diversion channel before diversion, A is the diversion point, a is the length between the bottom sill and point A, Z is the width of the Y-shaped diversion channel, and b is the distance between the bottom sill and the sidewall. The size parameters of the bottom sill are width K, height G, and length C. The sill is symmetrically arranged in the forebay of the circular pump station, as shown in Figure . Scheme 1 to Scheme 3 are comparisons of different sizes from the inlet of the diversion channel, as shown in Table . Scheme 4 to Scheme 9 are a comparison of different distances from diversion point A, as shown in Table . Scheme 10 combines the double bottom sill layout of Scheme 4 and Scheme 9, as shown in Table .
Figure 7. Bottom sill layout.
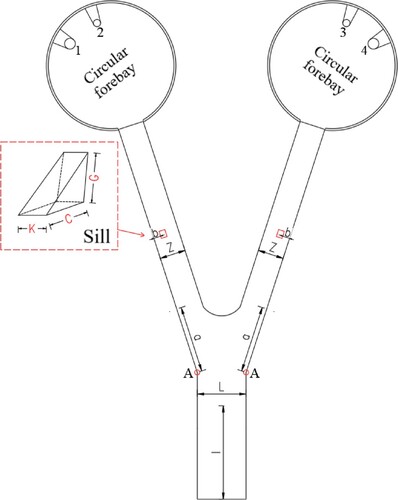
Table 2. Configuration of Simulation Schemes 1–3.
Table 3. Configuration of Simulation Schemes 4–9.
Table 4. Configuration of Simulation Scheme 10.
For the layout of the bottom sill, a comparative analysis of the y1 section is conducted, as shown in Figure . In Schemes 1–3, the bottom sill position is concentrated in the main diversion channel. Compared to section y1, the bottom sill dissipates energy before the main flow velocity collides with the Y-shaped rear wall. The diversion effect of the main flow velocity is better, and there is no obvious reflux zone in the diversion channel. However, different degrees of asymmetric vortex areas are generated in the circular inlet tank. Scheme 3 has the best bottom sill position, and it generates the smallest vortex area. In Schemes 4–9, the bottom sill is concentrated in the Y-shaped diversion channel. Compared to section y1, there is no obvious vortex area in the diversion channel, but different vortex areas are generated in the circular inlet tank, and the vortex area of the left circular inlet tank is smaller than that of the right circular inlet tank. After analysis, the vortex range of Scheme 7 is relatively small, but the effect of setting the bottom sill in the diversion channel is not as good as that of setting the bottom sill in the mainstream position. The vortex area of Scheme 7 is larger than that of Scheme 3, and the common point between Schemes 1–10 are that the generated vortices are close to the pumping outlet of the pump station, which can easily affect the efficiency of the pump station.
Figure 8. Flow structure distribution at y1 section of bottom sill from schemes 1–10: (a) Schemes 1 and 2; (b) Schemes 3 and 4; (c) Schemes 5 and 6; (d) Schemes 7 and 8; (e) Schemes 9 and 10.
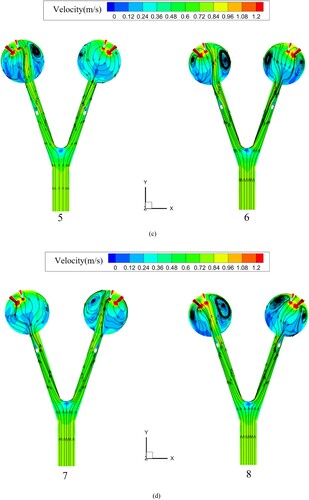
The bottom sill is primarily designed to reduce mainstream velocity and disperse the kinetic energy of the flow by utilizing the flow interference effect. The deceleration effect and flow interference of the bottom sill may generate vortices around the bottom sill. In Schemes 4–9, as the position of the bottom sill approaches the circular inlet tank, the vortex area mainly shows an increasing trend. However, the reason for the reduction in vortices in Scheme 7 is that the rebound force generated by the impact of the water flow in the diversion channel on the front and back walls of the pool counteracts the water flow in the diversion channel. At this time, the position of the bottom sill can precisely dissipate some kinetic energy, resulting in a reduction in the area of the vortices. The position selection of the bottom sill has a significant impact on the flow characteristics, and different positions of the bottom sill will have different effects on the water flow. In Schemes 1–9, the different positions of the bottom sill result in different forms and distributions of vortices. The motion of mixed water–sand flow is not static, and it is influenced by various factors, including the velocity and direction of the water flow, the position and shape of the bottom sill, etc. Therefore, the generation and evolution of vortices are mainly caused by the impact of the diversion channel on the front and back walls of the pool, and the energy dissipation state of the bottom sill cannot reach, resulting in the generation of vortices of different degrees. The position of the bottom sill in Scheme 3 is set in the main diversion channel, which is located on the path of the main water flow. This position allows the bottom sill to more effectively slow the main flow velocity and disperse the kinetic energy of the water flow, thereby reducing the vortex area in the circular inlet tank.
4.3. Influence mechanism of the water pressure plate on the flow pattern
The setting of the water pressure plate here is mainly to change the direction of movement of the water flow main body, increase the bottom flow velocity, and enhance the plane diffusion of the water flow. In the circular forebay, a water pressure plate is installed near the inlet of the diversion channel to ensure a smoother and more uniform flow of water into the circular forebay. At the same time, some water is washed into the bottom of the diversion channel at high speed, reducing sedimentation at the inlet and ensuring favourable inlet conditions for the forebay. In this section, a pressurized water plate is selected for simulation to correct the flow pattern in the circular forebay. The specific layout of the pressurized water plate is shown in Figure . The length, width, and height of the pressurized water plate in each scheme are consistent, with a length of 1.2 m, a width of 0.1 m, and a height of 1 m. Z is the width of the diversion channel, which is 1.2 m. A is the diversion point of the diversion channel, a is the length of the pressure plate from diversion point A, and γ is the rotation angle of the water pressure plate. Schemes 11–13 investigate the effect of the rotation angle A of the water pressure plate on the overall flow pattern. Schemes 14–20 study the effect of the length a (m) of the pressure plate from diversion point A on the flow pattern of the circular forebay. The specific layout parameters are shown in Table .
Figure 9. Water pressure plate layout.
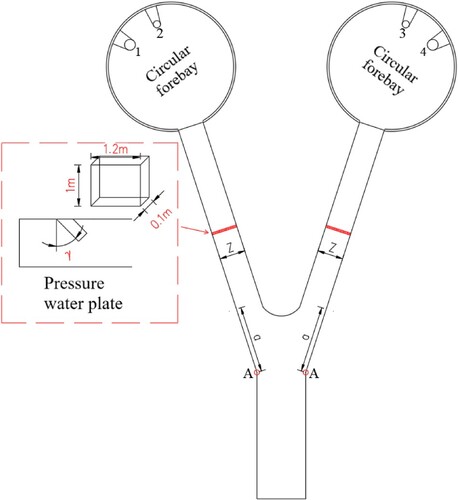
Table 5. Configuration of Simulation Schemes 11–20.
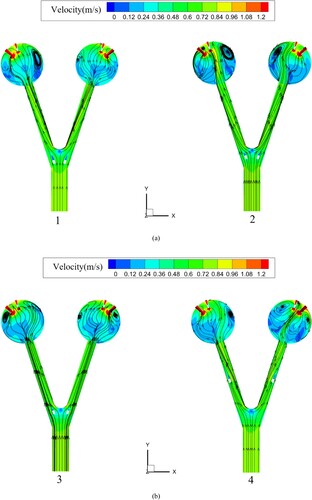
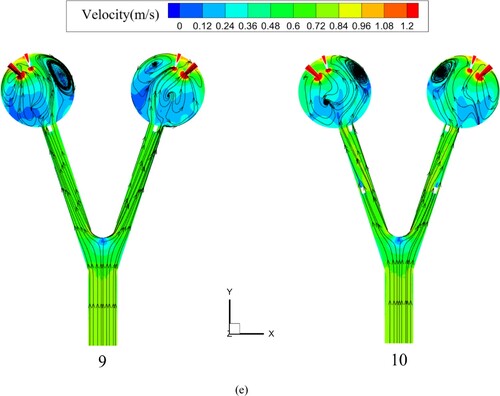
In the layout scheme of the water pressure plate, a comparative analysis was conducted on section y1, as shown in Figure . In Schemes 11–13, the rotation angle of the water pressure plate was changed. According to the numerical simulation results, there was no significant difference among the three schemes, and the generated vortex areas were all in a large range. Therefore, in Schemes 14–20,
= 45° was selected to explore the influence of different distances a(m) on the flow state in the circular forebay. As the water pressure plate approaches the circular inlet tank, each scheme will generate vortex areas of varying degrees and positions. Through comprehensive comparison, it was found that when a = 12.8 m, Scheme 19 generates a smaller range of vortices, and the vortex area is far from the vicinity of the pumping pump. This small vortex has a relatively small impact on the suction performance of the pump. Therefore, a water pressure plate can improve the poor flow pattern in circular forebays and provide a good working environment for pumping pumps.
Figure 10. Flow structure distribution at y1 section of bottom sill from schemes 11–20: (a) Schemes 11 and 12; (b) Schemes 13 and 14; (c) Schemes 15 and 16; (d) Schemes 17 and 18; (e) Schemes 19 and 20.
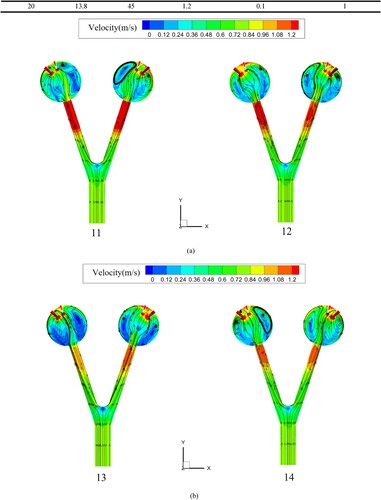
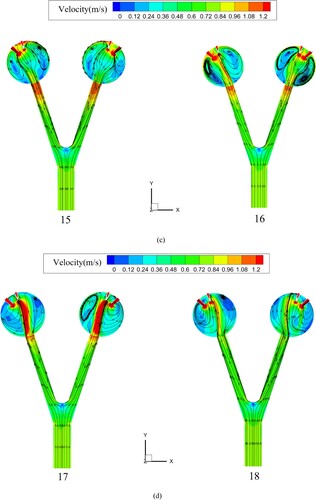
The rotation angle of the water pressure plate in the circular forebay has little effect on improving the flow pattern, while the presence of the water pressure plate changes the speed and direction of the water–sand mixed flow and eliminates some vortices generated by wall collisions. The selection of the position of the water pressure plate will improve or worsen the overall flow pattern. In Schemes 14–18, the large vortices generated near the pump inlet will affect the suction performance of the pump, leading to unstable working conditions. However, in Scheme 19, its parameters are set to = 45° and a = 12.8 m, which may be an equilibrium point. The elastic force generated by the impact of the main flow velocity on the circular inlet tank wall in the diversion channel reacts with the main flow. Due to the action of the water pressure plate, the kinetic energy of the main flow is strengthened, the rebound kinetic energy is weakened, and the force is reduced, resulting in a stable state of the mixed water–sand flow. As a result, the vortex range generated is small and not too close to the pumping pump. Therefore, Scheme 19 is an optimized circular forebay rectification measure that provides a good pumping environment for the pump station and reduces sediment accumulation.
4.4. Verification of the flow velocity uniformity and deviation angle for the optimal solution
To further verify the effectiveness of different rectification measures, for the original scheme, the optimal Scheme 3 in the bottom sill, and the optimal Scheme 19 in the water pressure plate, the flow velocity distribution uniformity and the average deviation angle
of section y1 were calculated and demonstrated using the following equations (6) (Li et al., Citation2017) and (7) (Xu et al., Citation2018).
(6)
(6)
(7)
(7) According to the grid division and section y1 calculation, m is the number of calculation units in section y1, and
is the average axial velocity, which can be set by section y1.
and
are the axial velocity and lateral velocity of the i-th calculation unit of the y1 section, respectively. The calculation results are shown in Table .
Table 6. Calculation of the flow velocity uniformity and deflection angle for cross-section y1.
For the y1 section of the circular forebay, due to the relatively small area occupied by the circular inlet tank and the stable flow state of the diversion channel, the flow velocity uniformity is relatively high. However, the focus of this section is to compare the improvement in flow velocity uniformity without rectification measures. In the circular forebay, due to the consistent direction of water flow with the direction of the pumping pump, the closer the deviation angle is to 0°, the better the pumping performance. Compared with the calculation results without rectification measures, Scheme 19 improved the uniformity of the flow velocity by 10.2% and achieved a deviation angle of 4.65°, which is better than that of Scheme 3. Moreover, the vortex area generated by Scheme 19 is far from the pump outlet, reducing the time for sediment particles to suspend at the pump outlet, reducing the probability of pump outlet pumping blockage, prolonging the service time of the pump station, and improving the pumping efficiency.
4.5. Vortex reduction estimation calculation
To enhance the accuracy of different rectification measures, a vortex reduction estimation is introduced to further analyse and calculate the generated vortices. Equations Equation(8)(8)
(8) and Equation(9)
(9)
(9) are introduced as follows (Yang et al., Citation2021):
(8)
(8)
(9)
(9) In the circular forebay,
is the ratio of vortex area parameters,
is the vortex area generated by the circular inlet tank section,
is the vortex area without rectification measures,
is the vortex area of bottom sill scheme 3, and
is the vortex area of pressurized water plate scheme 19. The circular area of cross-section y1 is set to
, where
is defined as the reduction rate of the vortex area. To verify the accuracy of the different rectification measures, the ratio of the vortex area parameters to the reduction rate of the vortex area in each plane is calculated, as shown in Table .
Table 7. Estimated Vortex Reduction Values for Different Rectification Measures.
Analysis and discussion: In the circular section of the y1 section of the forebay, the comparison shows that for the vortex area without rectification measures, Scheme 3 and Scheme 19 can reduce the vortex area to varying degrees. Scheme 19 had the greatest effect, with a reduction rate of 47.30% and a parameter ratio of 35.83%. The calculation results are good, and the vortex area generated by Scheme 19 is far from the pump outlet, which has a small impact on the overall flow state stability. Moreover, the results also verify the rectification effect of the water pressure plate in the circular forebay. As long as the position of the water pressure plate is at an equilibrium point, it dissipates some kinetic energy and strengthens some kinetic energy, which can achieve a good improvement effect. This approach can be used for designing the forebays of circular pump stations in the future. This study provides a certain theoretical basis for renovation.
5. Experimental verification
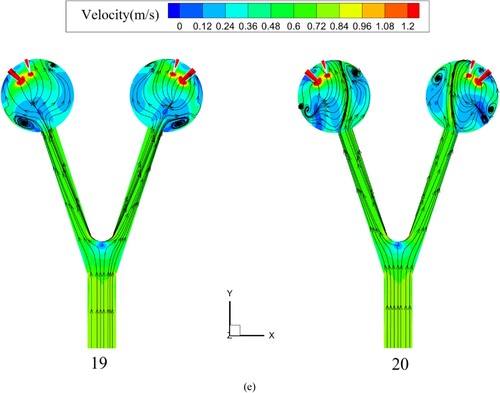
5.1. Experimental setup
To further verify the accuracy of the rectification effect of Scheme 3 in the bottom sill and Scheme 19 in the water pressure plate, a physical model device was made, as shown in Figure . The figure shows the model devices of the original Scheme, Scheme 3, and Scheme 19. The sediment concentration was adjusted to 2.62 kg/m3, and the inlet velocity of the water–sand mixed phase was adjusted to 0.02 m/s according to the design ratio of the circular forebay size. A sediment concentration measurement system was used to measure the sediment content at the bottom section of the circular forebay. The equipment system utilizes the principle of optical backscatter to accurately measure the sediment concentration in the water body. Simultaneously, a handheld high-precision flow velocity measuring device, with an accuracy range of 0.01–4 m/s, was employed to gauge flow velocities along the left centreline of both the Y-shaped diversion channel and circular inlet tank.
Figure 11. Physical model device for circular forebay.
5.2. Analysis of experimental results
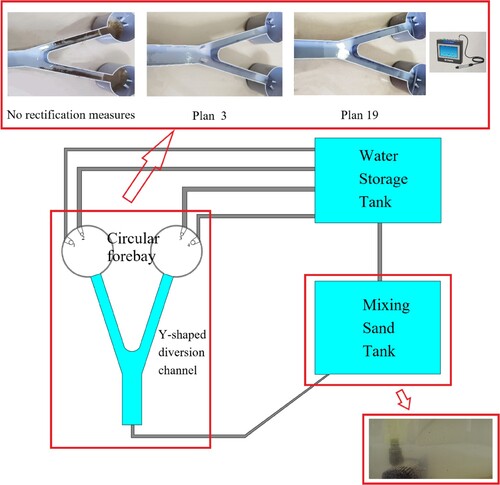
The sediment content results were imported into software for postprocessing, and the sediment content of section y1 in the original scheme, Scheme 3, and Scheme 19 was compared with the numerical results, as shown in Figure . The experimental results show that the location of areas with high sediment content is consistent with the numerical simulation results, and the maximum sediment content is also in good agreement with the numerical simulation results. In summary, in Scheme 19, it is evident that there is a reduction in the vortex area and a decrease in the sediment content, which once again verifies the accuracy of the numerical simulation results and the feasibility of the pressure plate rectification measures. It can provide a reliable basis for improving sediment deposition in the forebays of circular pumping stations.
Figure 12. Comparison between the numerical simulation and measured sediment content of section y1: (a) Original Scheme; (b) Scheme 3; (c) Scheme 19.
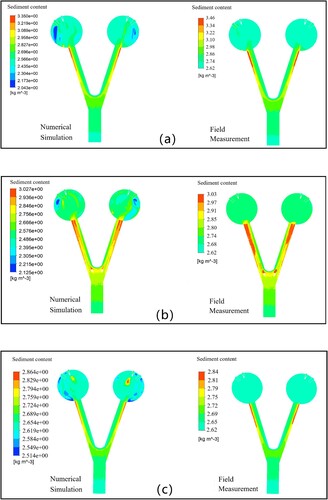
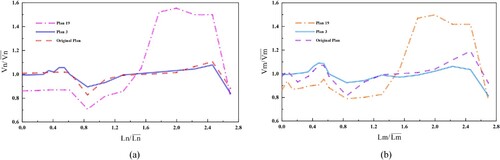
The numerical simulation and measured data were normalized by their respective average flow rates, as shown in Figure . The variation trends of the numerical simulation and measured results were essentially the same. Furthermore, the numerical model simulation results were converted, and the root mean square error analysis method was applied to conduct an error analysis on the measured results. The original calculation yielded a result of 0.023, while for Scheme 3 and Scheme 19, the results were 0.014 and 0.018, respectively. Consequently, the accuracy of the numerical simulation was confirmed based on these calculation results.
Figure 13. Comparative analysis of numerical simulation and measured results: (a) Numerical simulation; (b) Filed measurement results.
6. Conclusion
To address sedimentation issues in Y-shaped diversion channels and circular intake pumping stations of sandy rivers, we have adopted the Mixture model to characterize two-phase flow dynamics. A mathematical model, utilizing the standard k-ε turbulence equation, was developed to analyze flow distribution and sediment content within the calculation domain. Twenty optimized flow schemes were proposed, and the flow field structure was reconfigured to facilitate hydrodynamic dredging. Additionally, physical experiments and numerical simulations exhibit good agreement, offering a reliable theoretical foundation for similar engineering challenges. The research results indicate the following:
In the absence of any rectification measures, when the Y-shaped diversion channel contacts the circular inlet tank, the two-phase flow of water and sediment forms four shallow horizontal vortices due to boundary layer separation. This vortex area occupies more than half of the space in the circular inlet tank, 75% of the total area in the y2 section vortex area, 62% of the total area in the y1 section vortex area, and the vortex height is approximately 95% of the water depth. This causes the suspended sediment to migrate towards the edge wall area of the Y-shaped diversion channel and the pump outlet of the circular inlet tank, resulting in a significant decrease in the pumping efficiency of the pumping station.
In response to practical problems, there is a significant change in the flow pattern in the forebay after setting different rectification measures in the computational domain. When setting the bottom sill, its improvement effect is greater when it is located in the main Y-shaped diversion channel than when it is set in the diversion channel. When setting up a water pressure plate, as the water pressure plate approaches the circular inlet tank, each scheme will generate vortex areas of varying degrees and positions.
In Scheme 3 of the bottom sill, the rectification effect is obvious. In section y1, the uniformity of the flow velocity reaches 93.21%, the deviation angle is 13.52°, and the reduction rate of the vortex area reaches 24.68%, which improves the flow pattern in the circular forebay. Water pressure plate Scheme 19 has the best effect on improving the flow pattern, with a flow velocity uniformity of 96.35% in section y1, a deviation angle of 4.65° close to 0°, and a reduction rate of 47.30% in the vortex area, which strongly improves the flow pattern in the circular forebay.
Disclosure statement
The authors declare that they have no known competing financial interests or personal relationships that could influence the work reported in this paper.
Data availability statement
The data that support the findings of this study are available from the corresponding author upon reasonable request.
Additional information
Funding
References
- Ahmed, N., Yang, F., Zhang, Y., Wang, T., & Hassan, M. (2021). Analysis of the flow pattern and flow rectification measures of the side-intake forebay in a multi-unit pumping station. Water, 13(15), 2025. https://doi.org/10.3390/w13152025
- Chen, M., Tan, L., Fan, H., Wang, C., & Liu, D. (2022). Solid-liquid multiphase flow and erosion characteristics of a centrifugal pump in the energy storage pump station. Journal of Energy Storage, 56(Part A), 105916. https://doi.org/10.1016/j.est.2022.105916
- Dou, S., Yu, M., Yang, G., & Dou, C. (2010). Numerical simulation sediment movement in water intake forebay. Journal of Sediment Research, (01), 58–62. https://doi.org/10.16239/j.cnki.0468-155x.2010.01.007
- Fan, X., Dong, C., Wang, Z., Lu, Y., & Yao, W. (2023). Influence of diffusion angle on flow field structure in forward intake forebay of pumping station. Transactions of the Chinese Society of Agricultural Engineering, 39(01), 92–99. https://doi.org/10.11975/j.issn.1002-6819.202208112
- Feng, H., Wang, Y., Qiao, L., & Zhu, J. (2018). Internet of thing system to extract hierarchical healthy and efficiency information for pump station optimization. In Proceedings of the 2018 2nd International Conference on Big Data and Internet of Things (BDIOT ‘18) (pp. 162–166). Association for Computing Machinery. https://doi.org/10.1145/3289430.3289466
- Gong, J., Luo, W., Wu, T., & Zhang, Z. (2022). Numerical analysis of vortex and cavitation dynamics of an axial-flow pump. Engineering Applications of Computational Fluid Mechanics, 16(1), 1921–1938. https://doi.org/10.1080/19942060.2022.2122570
- Kan, K., Zheng, Y., Chen, H., Zhou, D., Dai, J., Binama, M., & Yu, A. (2020). Numerical simulation of transient flow in a shaft extension tubular pump unit during runaway process caused by power failure. Renewable Energy, 154. https://doi.org/10.1016/j.renene.2020.03.057
- Li, J., Guo, X., Yang, K., Guo, Y., Huang, W., & Cao Q. (2017). Flow passage optimization and performance study of the hydraulic ram pump. Journal of Hydraulic Engineering, 48(9), 1098–1106. https://doi.org/10.13243/j.cnki.slxb.20161212
- Luo, C., Qian, J., Liu, C., Chen, F. , & Zhou, Q. (2015). Numerical simulation and test verification on diversion pierrectifying flow in forebay of pumping station for asymmetric combined sluice-pump station project. Transactions of the Chinese Society of Agricultural Engineering, 26(1), 71–78. https://doi.org/10.3969/j.issn.1002-6819.2015.07.015
- Manninen, M., Veikko, T., & Sirpa, K. (1996). On the mixture model for multiphase flow. VTT Publications. Technical Research Centre of Finland, 288, 1–67. https://www.researchgate.net/publication/259938456_On_the_Mixture_Model_for_Multiphase_Flow.
- Romero-Gomez, P., Harding, S. F., & Richmond, M. C. (2017). The effects of sampling location and turbulence on discharge estimates in short converging turbine intakes. Engineering Applications of Computational Fluid Mechanics, 11(1), 513–525. https://doi.org/10.1080/19942060.2017.1313176
- Shen, S., Zhang, X., Zheng, K., Ling, Y., & Wang, S. (2021). Wall-function method used to simplify the solid oxide fuel cell model. Journal of Power Sources, 510, 230396. https://doi.org/10.1016/j.jpowsour.2021.230396
- Song, X., Rao, Y., Shen, Y., Bi, H., Zhang, Y., Du, L., & Wang, Z. (2021). Numerical prediction of erosion based on the solid-liquid two-phase flow in a double-suction centrifugal pump. Journal of Marine Science and Engineering, 9(8), 836. https://doi.org/10.3390/jmse9080836
- Tang, X., Wang, W., Wang, F., Yu, X., Chen, Z., & Shi, X. (2010). Application of LBM-SGS model to flows in a pumping station forebay. Journal of Hydrodynamics, 22(2), 196–206. https://doi.org/10.1016/S1001-6058(09)60045-7
- Wang, H., Li, C., Lu, S., & Song, L. (2022). The flow patterns and sediment deposition in the forebay of a forward-intake pumping station,”. Physics of Fluids, 34(8), 083316. https://doi.org/10.1063/5.0107905
- Wang, C., Yao, Y., Yang, Y., Chen, X., Wang, H., Ge, J., Cao, W. & Zhang, Q. (2023a). Automatic optimization of centrifugal pump for energy conservation and efficiency enhancement based on response surface methodology and computationalfluid dynamics. Engineering Applications of Computational Fluid Mechanics, 17(1), https://doi.org/10.1080/19942060.2023.2227686
- Xi, W., & Lu, W. (2021). Formation mechanism of an adherent vortex in the side pump sump of a pumping station,”. International Journal of Simulation Modelling, 20(2), 327–338. https://doi.org/10.2507/IJSIMM20-2-562
- Xu, W., Cheng, L., Du, K., Yu, L., Ge, Y., & Zhang J. (2022). Numerical and experimental research on rectification measures for a contraction diversion pier in a pumping station. Journal of Marine Scienceand Engineering, 10(10), 1437. https://doi.org/10.3390/jmse10101437
- Xu, C., Wang, R., Hui, L., Zhang, R., Wang, M., & Wang Y. (2018). Flow pattern and anti-silt measures of straight-edge forebay in large pump stations. International Journal of Heat and Technology, 36(3), 1130–1139. https://doi.org/10.18280/ijht.360346
- Xu, C., Wang, R., Liu, H., Lian, H., Wang, Y., & Wang, G. (2020). Research on the influence of start-up combinations on the flow pattern in forebay of side-in let pumping station on sandy river. Journal of HydraulicEngineering, 51(1), 92–101. https://doi.org/10.13243/j.cnki.slxb.20190662
- Yang, F., Zhang, Y., Liu, C., Wang, T., Jiang, D., & Jin Y. (2021). Numerical and experimental investigations of flow pattern and anti-vortex measures of forebay in a multi-unit pumping station. Water, 13(7), 935. https://doi.org/10.3390/w13070935
- Zhan, J., Wang, B., Yu, L., Li, Y., & Tang, L. (2012). Numerical investigation of flow patterns in different pump intake systems,”. Journal of Hydrodynamics, 24(6), 873–882. https://doi.org/10.1016/S1001-6058(11)60315-6
- Zi, D., Wang, F., Tao, R., & Hou, Y. (2016). Research for impacts of boundary layer grid scale on flow field simulation results in pumping station. Journal of Hydraulic Engineering, 47(2), 139–149. https://doi.org/10.13243/j.cnki.slxb.20150495