
 ?Mathematical formulae have been encoded as MathML and are displayed in this HTML version using MathJax in order to improve their display. Uncheck the box to turn MathJax off. This feature requires Javascript. Click on a formula to zoom.
ABSTRACT
Early childhood caries (ECC) is one of the most prevalent chronic diseases affecting children worldwide, and thus its etiology, diagnosis, and prognosis are of particular clinical significance. This study aims to test the ability of salivary microbiome and electrolytes in diagnosing ECC, and their interplays within the same population. We here simultaneously profiled salivary microbiome and biochemical components of 331 children (166 caries-free (H group) and 165 caries-active children (C group)) aged 4-6 years. We identified both salivary microbial and biochemical dysbiosis associated with ECC. Remarkably, K+, Cl-, NH4+, Na+, SO42-, Ca2+, Mg2+, and Br- were enriched while pH and NO3- were depleted in ECC. Moreover, the dmft index (ECC severity) positively correlated with Cl-, NH4+, Ca2+, Mg2+, Br-, while negatively with pH and NO3-. Furthermore, machine-learning classification models were constructed based on these biomarkers from saliva microbiota, or electrolytes (and pH). Unexpectedly, the electrolyte-based classifier (AUROC = 0.94) outperformed microbiome-based (AUROC = 0.70) one and the composite-based one (with both microbial and biochemical data; AUC = 0.89) in predicting ECC. Collectively, these findings indicate ECC-associated alterations and interplays in the oral microbiota, electrolytes and pH, underscoring the necessity of developing diagnostic models with predictors from salivary electrolytes.
Introduction
Early childhood caries (EEC) is one of the most prevalent chronic diseases of children worldwide [Citation1]. Severe EEC, an aggressive form of dental caries, can lead to acute pain, sepsis, and potential tooth loss and even interfere with the children’s quality of life, nutrition, and school participation [Citation2]. Most importantly, once started, the damage to teeth is irreversible, with ECC-affected children continuing to suffer from a higher risk for caries onsets and even tooth loss over their entire lifespan [Citation3]. In addition, ECC incurs enormous societal costs [Citation4,Citation5]. For instance, some of the children who suffer from dental treatment-related anxiety or are challenging to treat successfully in the dental chair require general anesthesia for the treatment of caries [Citation6]. Therefore, the early diagnosis and prognosis of ECC and preventive intervention are of particular clinical significance.
For the assessment and early detection of ECC, visual or visual-tactile detection combining with bite-wing radiography has been commonly employed [Citation7,Citation8]. A commonly used method is the International Caries Detection and Assessment System (ICDAS), which has shown to be an accurate and reproducible method to detect early lesions based on clinical visual appearance [Citation9]. Radiographs are more sensitive than clinical inspection for detecting approximal lesions, estimating lesion depth, and monitoring lesion behavior [Citation10,Citation11]. However, this chair-side check by a dental explorer might not be friendly to children due to the discomfort of intraoral instruments. Moreover, radiography cannot distinguish active lesions from arrested ones [Citation12]. Additionally, limitations of other useful tools aiding in caries detection are also not insignificant [Citation13,Citation14], such as Optical Coherence Tomography (OCT), Fibre-optic Transillumination (FOTI), and Electrical Caries Monitor (ECM). The principal issue of OCT is the lack of commercial availability due to its high cost and, moreover, determination of the lesion depth in relation to the pulp is prevented because the pulp chambers do not appear clearly in the OCT images [Citation15]. Although FOTI offers dentists and patients a three-dimensional image of carious lesions, it is not useful for the determination of lesion size, depth, volume, and mineral content [Citation16]. ECM has shown superior performance to FOTI and radiography in the early lesion [Citation11], but the inconsistent probe contact with the tooth surface could result in variations in producibility [Citation17]. The lesion activity assessment will assist in the treatment decision, particularly when preventive options should be implemented [Citation18]. Therefore, the development of risk-assessment methods that are objective, accurate, reproducible, patient-friendly, and readily accessible has become a top priority in this field.
ECC has been widely associated with oral microbiome dysbiosis. Salivary microbiome dysbiosis, allowing the promotion of cariogenic bacteria that lead to sustained demineralization of tooth tissue, has been implicated in dental caries [Citation19–22]. Evidence from our and other studies demonstrated that the saliva microbial biomarkers could serve as a non-invasive and host-friendly proxy for risk assessment of ECC [Citation22,Citation23]. However, these organismal markers were tested in relatively small cohorts (e.g. sample sizes ranging from 25 to 50), and only exhibited a moderate performance (e.g. area under the receiver operating characteristic curve (AUROC) ranging from 68% to 78%) in predicting dental caries status [Citation20,Citation22,Citation23]. Surveys and validation in larger children cohorts that include more inter-individual and biogeographic heterogeneity in the oral microbiome thus are urgently needed to refine the landscape of critical dysbiotic microbiota underlying ECC.
ECC is recognized as a multifactorial disease mainly caused by the complex metabolic interactions between the oral microbiome, diet, and many host factors [Citation24]. The dynamic changes of saliva electrolytes reflect the variation of microenvironment along with the occurrence of ECC. In the development of caries, the relationship between demineralization and remineralization is affected by the presence of saliva, which promotes the transport of electrolytes, bacteria, and fermentable carbohydrates to the tooth surface [Citation25]. Among them, Ca2+ and PO43- are contained in enamel hydroxyapatite. Once the enamel is demineralized, these electrolytes are released to saliva [Citation26]. F− incorporated with calcium and phosphate, which is taken up by demineralized tooth substrate, forms a fluorapatite crystalline structure by remineralization, thus increasing resistance to the next acid challenge [Citation27]. Na+, K+, Mg2+ and Cl− can substitute for calcium and phosphate in the crystal lattice of the various mineral phases present in the teeth, thereby potentially affecting tooth demineralization and remineralization interaction [Citation28,Citation29]. NO3− is mainly transported to the salivary glands, through the action of nitrate reductase in the oral cavity, then it is quickly reduced to NO2−. These salts are rapidly acidified when encountering some bacteria such as Lactobacillus, Actinomyces, and Streptococcus mutans, which are related to cariogenic effects [Citation30]. Br- has important functions in the formation of collagen IV and in the activation of α-amylase in saliva [Citation31]. Urea and ammonia, which are produced by arginine-rich protein, play a role in maintaining a neutral pH in the oral cavity [Citation32]. Thus, a comprehensive understanding of the dynamics of salivary constituents and properties in the larger children study is required for assessing its potential for better diagnosis and prediction of ECC.
Given that both oral microbiome and salivary biochemical environments can contribute to the etiology of ECC, here we further address three critical questions in a 331-member Chinese cross-sectional study consisting of both ECC and healthy individuals. (i) Do saliva microbial communities assemble differentially at different host disease states in a large-scale study? (ii) Do various saliva electrolytes, pH, and total protein differentially distribute across disease states? Does ECC feature a co-occurrence network of saliva microbiota and electrolyte components? (iii) What is the predictive power of the salivary microbiota and electrolyte biomarkers distinguishing the caries children from the healthy ones?
Materials and methods
Study design
Our study involved 4 to 6 years old children enrolled in 22 kindergartens in China. According to the 4th National Oral Health Survey, the mean caries prevalence for 4- to 6-year-old children is 70% in China. In a pilot study, 70% of the 4- to 6-year-old children in China had at least one tooth with untreated caries [Citation33]. We further estimated the sample size of the study employing the following formulate [Citation34].
where N = sample size, p = prevalence = 70%, d = margin of error = 15%. Therefore, the calculated minimum sample size was 36 children per group. The sample size of our study was 331 (165 caries-active and 166 caries-free children), far exceeding the calculated minimum sample size.
Inclusion criteria were as follows: (1) Both genders, aged from around 4 to 6 years; (2) Participants (or legal parents or other guardians for children) provided informed consent; (3) Children could cooperate with the sampling. The exclusion criteria considered individuals: (1) No orthodontic treatment or malocclusion or severe gingival or periodontal diseases; (2) Absence of any systemic or congenital diseases, emotional or intellectual disabilities, developmental malformations, bacterial or severe infections in other parts of the body; (3) No emergency dental recall in the last 3 months; (4) No antibiotics, probiotics, professionally applied fluorine vanish and orthodontic appliance within the past 3 months. The fluorine excluded in this study refers to the professionally applied fluoride vanish within 3 months, while we cannot exclude the use of fluoride in water and dentifrice.
Local authorities and children’s parents were informed of the study objectives and procedures. Parents who agreed to the participation of their children signed the informed consent form according to the approval of the ethical committee of Qingdao University. Then, a clinical oral examination was performed on those children in 22 kindergartens in Qingdao, China. Information about children’s age, gender, and whether they had used antibiotics, probiotics, fluoride, and dental appliances in the past 3 months was collected using questionnaires. According to the eligibility criteria, 331 children were selected for saliva sample collection, including 165 children (94 boys and 71 girls) diagnosed with active caries (dmft ≥ 4, C group) and 166 healthy children (81 boys and 85 girls; dmft = 0, H group).
All teeth were evaluated according to the criteria recommended by the World Health Organization (WHO) using dmft index (the number of decayed, missing, and filled teeth in deciduous dentition for primary teeth) [Citation35]. The clinical examination was carried out using a visual-tactile method with a dental mirror and WHO probe 5 s per dental surface under artificial light use [Citation36]. In our study, the healthy group consisted of children with intact healthy teeth surfaces. Children with clinical signs of early caries or white spots were not included in the H group. White spot lesions were differentiated from developmental enamel defects simply on clinical grounds based on the association of the lesions with the area of mature plaque and location on the tooth, i.e. white lesion appearing to occur adjacent to the gingival margin, and extending along the buccal or lingual surfaces [Citation37], combined with the aspect of the lesion when dry (white chalk looking versus dry).
Prior to the clinical data collection, the calibration procedures were conducted for the diagnosis of dental caries in a pilot study. These procedures sequentially involved theoretical training with the examination of photographs of different dental conditions, clinical examinations, and the determination of intraexaminer and interexaminer agreement. The process was conducted by a researcher with experience in epidemiological studies involving the indices to be employed (gold standard). Kappa coefficients were calculated, with an interval of 7 days between two examinations for the determination of intraexaminer agreement. The calibration procedures were performed on 20 children in the same age group until achieving excellent intraexaminer and interexaminer agreement (>0.80).
Saliva sample collection
Saliva samples were collected at the same period, in the morning from 8:00 to 10:00. Children were required not to brush their teeth in the morning before sampling. No drinking or eating was allowed for at least 90 min before collection. Subjects sat on ordinary chairs and were placed in Coachman’s posture at the time of sampling, with their heads slightly downward, hands palmed on their thighs, and slightly forward bending. These subjects were asked to slowly spit natural, unstimulated saliva into a 50 mL centrifugal tube for 5 min. Samples were recorded and transferred to 4°C until the end of the collection. The saliva samples were centrifuged at 3,000 rpm at room temperature for 10 min, and the supernatant was then stored in a refrigerator of −80°C.
Biochemistry components analysis
The stored saliva was thawed naturally. For each individual, 2 mL saliva samples were taken for biochemistry components analysis. Saliva was centrifuged at 13,000 rpm for 10 min and the clear supernatant was obtained for analysis. The pH values of saliva were measured by a digital pH meter. First, a pH 7.0 buffer was used to calibrate. Once the pH electrode was immersed in one saliva samples, the electrode should be infiltrated into distilled water prior to the next test. The infiltration part of the electrode was wiped off with filter paper and corrected with the buffer of pH 7.0. An automatic enzyme labeling instrument determined the concentrations of total protein in saliva. Absorbance was measured at 595 nm to evaluate the level of the total saliva protein. As for the determination of salivary ions, a chromatography unit was used to determine concentrations using specific columns. The chromatography unit was calibrated with the use of a standard eluent. Before analysis, all samples were filtered through 0.45 μM membrane filters to remove suspended particles. The treated samples were injected into the ion chromatography system. The anions we tested included sodium (Na+), potassium (K+), calcium (Ca2+), ammonium salt (NH4+), magnesium (Mg2+), and cations included chlorine (Cl−), phosphate (PO43-), nitrate (NO3−), nitrite (NO2−), sulfate (SO42-), fluoride (F−) and bromine (Br−). Chromatographic data were acquired and processed by software (Peaknet 6.2) integrated in the ion chromatography system. Calibration and linearity checks were performed according to a previous protocol [Citation38]. All of the above tests were performed in triplicate.
DNA extraction, PCR amplification, and sequencing of the salivary microbiome
Salivary genomic DNA was extracted by the Qiagen DNeasy Blood & Tissue DNA kit (Qiagen Valencia, CA), according to the manufacturer’s instructions [Citation39,Citation40]. Two milliliters of unstimulated saliva were taken into a microcentrifuge tube by centrifugation for 10 min at 13,000 rpm. The precipitate was re-suspended by buffer ALT and the mixture was incubated for 30 min at 37°C. Then, 20 μL of proteinase K was added and the mixture was incubated overnight at 56°C. Afterward, 200 μL buffer and 100 μL of ethanol were added. DNA yield and DNA purity were determined using NanoDrop ND-100 (NanoDrop Technologies, DE, USA), A 260/280 nm was used for protein contamination, and A260/230 nm for salt and phenol contamination. The V3-V4 region of the 16S ribosomal RNA (rRNA) gene was amplified using universal primers for pyrosequencing for all 331 volunteers. PCR amplification reaction mixtures in triplicate for each sample were pooled at approximately equal amounts and sequenced. The quality of the amplified PCR product was verified by electrophoresis (2% agarose gel) and PCR products were sequenced using Roche 454 FLX Titanium (GS-Titanium; 454 Life Sciences, Branford, CT, USA).
Sequence analyses, OTU clustering and taxonomy assignment
The raw sequences were filtered based on sequence length, quality, primer with Trimmomatic (v0.36), Pear (v0.9.6), and Flash (v1.20), and the low-quality or chimeric sequences were removed with Vsearch (v2.7.1). Downstream bioinformatics analysis was performed using the Parallel-Meta 3 software package. Both binary and source code packages are available at http://bioinfo.single-cell.cn/parallel-meta.html. Parallel-Meta 3 is popular used for 16S rRNA copy number calibration, diversity statistics, taxonomical comparison of microbial communities, comprehensive biomarkers selection and interaction network construction [Citation41]. Clustering of the operational taxonomic unit (OTU) was conducted at 97% similarity level using the GreenGenes database [Citation42]. Based on the results of OTUs, the microbial richness index (Chao1) and species diversity indices (Shannon index and Simpson index) were calculated to evaluate α diversity of the oral salivary microbiome. The distance between each pair of microbiota was computed based on the weighted and unweighted Meta-Storms algorithm [Citation43], which was used to quantify the differences between any two samples.
S. mutans and Prevotella pallens were selected species for technical verification. S. mutans was found to be related with a variety of electrolytes in our study. P. pallens was not found to have a significant association with ECC in this study, yet their genus Prevetolla was associated with ECC in our previous study [Citation22]. The absolute amounts of S. mutans were assessed by the specific qPCR primer Sm-F2 and Sm-R2. The primer sequence (5ʹ→3ʹ) was GCAGTCAAGGGGTGGAAATCG and TGGACGGCTTGTTGCAGGAATAC respectively, and the amplicon size was 188 bp [Citation44]. Another primer pair for P. pallens was 5ʹ AGCCTGAACCAGCCAAGTAG and 3ʹ CATAGCATACTTA-TTCCTGGCCG. The gene copy number was calculated based on the standard curve of each primer system with the LightCycler 480 software 1.5 (Roche). The relative abundance of S. mutans and P. pallens identified via qPCR was described in the following table. The correlation results showed that the relative abundance of S. mutans and P. pallens was consistent with the result of 16S rRNA sequencing (r = 0.64 for S. mutans and r = 0.72 for P. pallens, p < 0.05).
Statistical analyses
The statistical analyses were carried out via R (Version 2.15.0), including the chi-squared test, Wilcoxon rank sum test, permutational multivariate analysis of variance (PERMANOVA), and Spearman correlation. Biochemical statistics were presented as mean ± standard deviation, and the chi-squared test compares these two groups. Indices of Shannon, Simpson, and Chao1 between status and gender were compared by the Wilcoxon rank-sum test and further, the correlation of the above indices and the dmft index were estimated using the Spearman correlation coefficient. The influence of disease status and gender on the microbial community was calculated with PERMANOVA. The relative abundance of taxonomic groups at six phylogenetic levels between the C and H groups was evaluated with Wilcoxon rank-sum test. ‘ECC-enriched’ represents those microbial/biochemical indices with significantly increased relative abundance/concentration level in ECC children compared with healthy controls, while ‘ECC-depleted’ means those microbial/biochemical indices with significantly decreased relative abundance/concentration level in ECC children compared with healthy controls. Spearman correlation coefficients were used to evaluate the correlations among saliva biochemical components, caries activity (dmft index), and bacterial abundances. A P-value less than 0.05 was considered as statistically significant.
Establishing the ECC diagnostic model using a machine learning technique
Random Forest models were trained to identify disease status using the default parameters of the R implementation of algorithm (randomForest package in R, ntree = 5,000, using default ‘mtry’ of p/3, where p is the number of input taxa). We used random sampling to divide the dataset into a training set (90%) and a testing set (10%) so that to balance each dataset. To construct and optimize the diagnostic model, models were built based on biochemical indices alone, microbiomes alone, and both biochemical and microbial indices collectively. The ‘rfcv’ function estimated the minimal number of top-ranking discrimination taxa required for classifying over 100 iterations. The results were evaluated with a 10-fold cross-validation method and this process was repeated ten times. Then, the average of probability was reported as a result. In the 100 iterations of the algorithm, the sorting list of taxa was determined according to the order of feature importance reported by Random Forests. The performances of models were assessed by AUROC (area under the receiver operating characteristic curve), and a high area under the curve represents both high recall and high precision.
Data availability
The sequencing data in this study have been submitted to the Microbiome Search Engine (MSE) [Citation45] and NCBI Sequence Read Archive, and can be accessed through the project ID P_SCC0005 (http://mse.single-cell.cn/index.php/mse/get_by_project/P_SCC0005) and BioProject numbers PRJNA717886.
Results
Profound dysbiosis of salivary microbiota in ECC
We assigned 331 children into the C group (dmft = 9.01 ± 2.8; n = 165) and H group (dmft = 0; n = 166) according to their caries states determined by the dmft index [Citation35]. There was a balanced gender and age distribution between the H and C groups (chi-squared test, p > 0.05). We qualitatively and quantitatively measured the differences of the salivary microbiota with and without ECC in microbial diversity and composition. Firstly, alpha diversity indices, including Shannon index, Simpson index, and Chao1, were significantly higher in the C group as compared with the H group (p = 0.0062, 0.0048, 0.0074, respectively), yet not associated with gender (p = 0.28, 0.35, 0.72, respectively; ). Next, to assess microbial structure alterations (i.e. beta diversity) in ECC, we calculated the Meta-Storm distance between all pairs of samples and compared the community structures within and between disease states. We found that the disease state was the most dominant factor explaining the variation in the salivary microbiomes (p = 0.001, F = 3.22). Moreover, the degree of variations in the C group was significantly less than that in the H group, suggesting that ECC microbiomes were significantly relatively similar and conserved, whereas the healthy ones were relatively variable (p = 0.03; Figure S1). Lastly, we further identified differentially abundant taxa (i.e. ‘ECC-enriched’ and ‘ECC-depleted’ taxa) between two host groups at each of the six phylogenetic levels (i.e. phylum, class, order, family, genus, and species levels; , S2). At the genus level, ECC children exhibited an increased relative abundance of Prevotella, Mogibacterium, or Atopobium (p = 8.40e-4, 8.81e-3, 1.57e-4, respectively; ). Moreover, a few bacterial species under these genera, including Prevotella melaninogenica, Atopobium rimae and Atopobium parvulum, S. mutans and Streptococcus AY020 were found to be enriched in the C group (p = 2.08e-4, 4.01e-4, 7.96e-4, 9.20e-20, 5.32e-3, respectively; ). Conversely, at the genus level, Porphyromonas and Capnocytophaga (their representative species: Porphyromonas CW034 and Capnocytophaga sputigena) were less abundant in the C group than in the H group (ECC-depleted; p = 2.67e-4, 6.37e-3, 1.28e-5, 1.05e-3, respectively; ) while Streptococcus australis/sanguinis depleted in ECC as well (p = 6.68e-3; ). Furthermore, we found that the dmft index positively correlated with the relative abundance of S. mutans (ECC-enriched; p = 5.37e-22, rho = 0.52; ), while negatively correlated with Porphyromonas CW034 (ECC-depleted; p = 0.006, rho = −0.24; ).
Figure 1. Comparison of indices of α diversity between status and gender. The p value for each comparion was present within the boxplot. The Shannon, Simpson, and Chao1 indices were significantly higher in the C group (p = 0.0062, 0.0048, 0.0074), while none of these indices were significantly different between gender (p > 0.05)
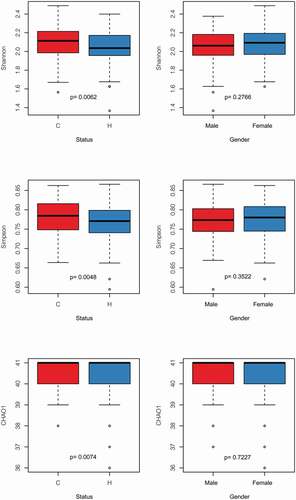
Figure 2. Relative abundance of significantly diverse genera and species in the C group and the H group. Each dot represented a sample. The H group in the blue box (n = 166), while the C group in the red one (n = 165). The ECC-enriched taxa were presented at the genus (A) and species (B) level, and the ECC-depleted taxa were shown at the genus (C) and species (D) level as well.PRINTER: Can the figures be increased to make them more readable?
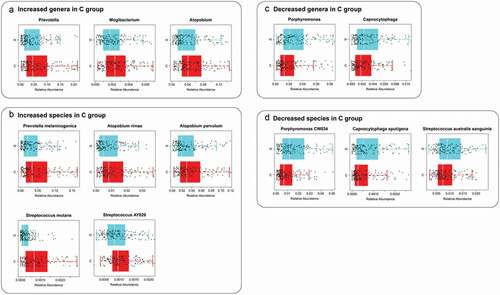
Figure 3. Correlations between microbiome at the species level and the host’s ECC severity (i.e. dmft index). In ECC, an abundance of Streptococcus mutans showed a positive correlation with the dmft index; while an abundance of Porphyromonas CW034 showed a negative correlation with the dmft index. rho: Spearman correlation coefficient
Key saliva biochemical components underlying ECC pathogenesis
Next, we pinpointed a wide array of ECC-associated biochemical markers (i.e. the ‘ECC-enriched’ and ‘ECC-depleted’). The electrolytic concentrations of K+, Cl−, NH4+, Na+, SO42-, Ca2+, Mg2+, and Br− were significantly higher in the C group (p = 6.63e-4, 1.49e-11, 1.63e-4, 1.63e-3, 1.31e-3, 5.68e-6, 4.98e-7, 1.29e-8 respectivelly; ), while levels of pH and NO3− were significantly higher in the H group (p = 9.95e-5, 2.72e-5, respectivelly; ). Among them, we identified positive correlations between levels of certain ECC-enriched electrolytes, including Cl−, Br−, Mg2+, Ca2+ and NH4+ and the dmft index (p = 2.66e-8, 2.74e-6, 2.43e-4, 3.98e-3, 1.59e-2, respectively; rho = 0.33, 0.29, 0.24, 0.20, 0.18, respectively; ). In contrast, changes in the ECC-depleted electrolyte (NO3−) level and pH value were negatively correlated with the dmft index (p = 4.62e-4, 2.21e-2, respectively; rho = −0.23 for pH value, −0.17 for NO3− level; ). Besides, no difference between the two groups was noted for the concentration of total protein. The relative abundance of S. mutans (caries-enriched taxon) showed a positive correlation with the concentration of Cl−, Br−, K+, and Mg2+ respectively (ECC-enriched electrolytes; p = 2.25e-8, 4.76e-5, 1.41e-2, 2.87e-2, respectively, rho = 0.35, 0.29, 0.23, 0.22; ), whereas Lautropia mirabillis positively correlated with NO3− (ECC-depleted electrolyte; rho = 0.24, p = 6.66e-3; ). The abundance of L. mirabillis was not statistically significantly different between the two groups but trended to be lower in ECC samples.
Table 1. Comparisons of biochemical parameters between the H and C group. (**: p < 0.01; ***: p < 0.001)
Figure 4. Correlations between biochemical components and the host’s ECC severity (i.e. dmft index), as well as microbiome at the species level. Each point represented a sample. In ECC, (A) the concentrations of Cl−, Br−, Mg2+, Ca2+, and NH4+ showed positive correlations with the dmft index, while in (B) pH, the concentration of NO3− showed negative correlations with the dmft index. (C) Correlations between species and electrolytes were present. The relative abundance of Streptococcus mutans abundance was positively correlated with the levels of Cl−, Br−, K+, Mg2+; Lautropia mirabilis was positively correlated with the NO3− level. rho: Spearman correlation coefficient. PRINTER: Can these figures be increased to make them more readable?
The predictive power of the salivary electrolyte pool is superior to that of microbiota in discriminating ECC
In this study, we observed the substantial alterations in the saliva microbiota and the biochemical compositions of the ECC group relative to those of the healthy controls. These findings raised three key questions: (i) whether we can develop the diagnostic model of ECC based on the biochemical profile as well as, if not better than, the oral microbiota; (ii) if yes, which feature set could offer a better prediction performance; (iii) whether a combined feature set, including both the salivary microbiomes and biochemical constituents, can further improve the model performance. To address these questions, we trained three sample classifiers for predicting ECC states using Random Forests (RF) algorithm based on features from oral microbiota alone, biochemical components alone, and a combined set to distinguish the ECC from the healthy control group, respectively. The model performance was evaluated via the area under the Receiver Operator Curve (AUROC) using a 10-fold cross-validation approach (Materials and methods). Then, we ranked the features by built-in RF importance scores in each predictive model for feature selection.
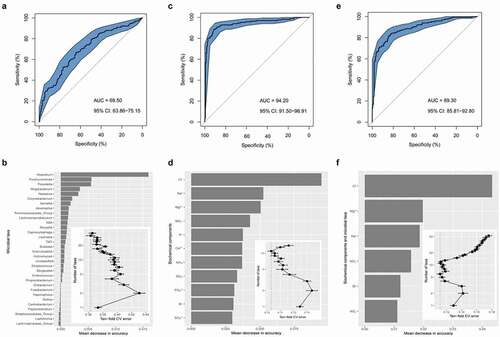
As for the salivary microbiome data, we trained an RF classifier based on the genus-level profile for which AUROC reached 0.70 (95% CI: 63.86%-75.15%, accuracy = 0.65; ). The performance improvement was maximized by employing the top-32 most discriminatory genera, many of which (e.g. Atopobium, Prevotella, Mogibacterium, and Neisseria) have been reported to be associated with dental caries () [Citation46–49]. Intriguingly, as compared with the oral-microbiota-based classifier, the ECC classifier performed better based on the biochemical indices, including 12 salivary electrolytes, pH, and total protein (AUROC = 0.94, 95% CI: 91.50%-96.91%, accuracy = 0.89; ). Consequently, 11 salivary electrolytes were selected as the optimal marker set, offering the best classification performance in the reduced model (). Unexpectedly, we found that the composite model only exhibited a moderate classification and did not outperform the electrolyte-based model (AUROC = 0.89, 95% CI: 85.81%-92.80%, accuracy = 0.82; ), suggesting that the two sets of salivary features could not be complementary in predicting ECC using the RF algorithm. In the feature selection, the performance in the reduced models was optimized when only the top six most discriminatory variables were employed, all of which were derived from salivary electrolytes (i.e. Cl−, Mg2+, Na+, NO3−, Br−, NO2−; ).
Figure 5. Disease classification based on salivary profiles. (A) Classification performance of Random Forest model using the microbial profile, (C) biochemical components, and (E) all of the variables of biochemical and microbial indices, assessed by the area under the receiver operating a characteristic curve with the distribution of sensitivity and specificity. (B) Microbial taxa, (D) biochemical components, and (F) all profiles of salivary indices with most important were ranked in descending order by their discriminating power to the accuracy of the model. The bar length at each row indicated the relative contribution of the taxa to the RF model. The inset of (B), (D) and (F) showed the relationship between the numbers of variables included in the model based on the saliva indices and the corresponding model performance. PRINTER: Can Figure B, D and F be increased to make them more readable?
Discussion
Saliva is considered the most crucial host-related factor that could affect dental caries development and play a key role in maintaining children’s health [Citation50,Citation51]. This study aimed to explore the value of both the salivary microbiome and biochemical components for ECC etiology and diagnosis. Firstly, we evaluated the salivary microbiome diversity and found that the C group exhibited a reduced microbial diversity compared to healthy children, reported in both caries children and adults [Citation52–54]. With the development of caries, an ecological disruption of the normal, healthy bacterial community occurs through glycolytic activity. Some dominant bacteria such as acidogenic and aciduric taxa can better adapt to the highly dynamic environment, thus resulting in the reduction of biodiversity in the oral environment. Moreover, we observed significant shifts in the saliva bacterial composition of the ECC relative to health, and identified both ECC-enriched taxa and ECC-depleted taxa. In addition to the classic cariogenic model of S. mutans [Citation55,Citation56], our study also identified a few novel bacteria positively associated with dental caries, such as Atopobium spp., Prevotella spp., and Neisseria spp [Citation46,Citation49,Citation57,Citation58]. Prevotella spp., which were consistently the main predictors of ECC reported in our previous studies [Citation22]. They may play key roles in dentin caries progression, mainly involved in proteolysis and infiltrating the degradation of organic matrix in dentin [Citation59]. In contrast, the ECC-depleted bacterial taxa, such as Porphyromonas CW034 and S. sanguinis may provide a protective function against dental caries [Citation55,Citation60]. Especially, in the in vitro models, S. sanguinis clearly exhibited an antagonistic interaction with S. mutans [Citation61]. Taken together, these results indicated the global alterations in the oral microbiota accompanying the shift from health to caries and highlighted the necessity of employing differentially abundant taxa as the diagnostic and predictive markers.
Next, we characterized salivary constituents and properties, including inorganic ions (electrolytes), organic molecules (i.e. total protein), and physicochemical property (i.e. pH), associated with ECC. Overall, ECC-affected saliva exhibited a distinct electrolytic pattern compared to healthy ones. For example, our results confirmed that salivary pH significantly decreased in caries patients and even negatively correlated with ECC severity [Citation34]. It has been documented that, in a caries circumstance, acid-producing and acid-resistant bacteria thrive through the glycolytic activity and culminate in demineralization events of tooth tissue after a cariogenic challenge with frequent carbohydrates [Citation1,Citation22]. From this perspective, it is plausible that the promotion of hydrogen ions can be developed as a qualitative and quantitative indicator of the ECC state. Moreover, the nitrate concentration in saliva decreased significantly in the caries state and negatively correlated with ECC severity. It was reported that in the caries condition, nitrate tends to be converted to nitrite by the over-abundance anaerobic and facultative anaerobic bacteria. Nitrite can be further transformed into nitrous acid, which was inherently unstable and easily decomposed to nitric oxide (NO) [Citation62] especially in the acidic pH environment [Citation63]. It has been suggested that an individual is in the progress of preventing cariogenic acidogenic bacteria with the ability of reducing large amounts of nitrate to nitrite [Citation62]. Interestingly, it is widely accepted that ammonium can neutralize the acid and decrease the H+ level of the oral the microenvironment to promote remineralization processes [Citation64]. As a result of a compensatory response, we found that caries patients had an enrichment in the electrolytic concentration of NH4+ compared to healthy controls, which was consistent with the relevant research [Citation65].
Saliva acts as a transporter of many ions, such as calcium, phosphate and fluoride, which are essential for the promotion of remineralization. At a normal pH, the calcium and phosphate in saliva are supersaturated, so demineralization will not occur. Acids of bacterial origin and acids in food or beverages tend to shift the balance towards mineral loss [Citation28]. On the one hand, the acid-induced demineralization of enamel can promote a more significant mobilization of saliva electrolytes due to the increased mineral dissolution and the release of inorganic elements (e.g. Na+, Ca2+, K+, Mg2+, and Cl−) [Citation66,Citation67]. On the other hand, saliva is also considered as a buffering pool that could shift the dynamic equilibrium between demineralization and remineralization for controlling the dental caries activity [Citation68–70]. Inorganic components in saliva can participate in the remineralization of the apatite crystal structure, which directly contributes to the maintenance of enamel integrity and mitigating the damage caused by acid-producing bacteria [Citation67,Citation71]. Ion substitutions that may occur in bioapatite include substitution of magnesium and sodium for calcium, substitution of fluorides and chlorides for hydroxyl sites, and carbonates for phosphate and hydroxyl sites [Citation28]. These biochemical processes can raise an environmental supersaturation of electrolytes (e.g. calcium and fluoride) around and inside the biofilm structure of the tooth surface [Citation71], which can be highly indicative of the oral health status. Collectively, identification of these biochemical markers may permit a more refined understanding of the caries pathogenesis and clarify significant etiologic factors in the shift from health to disease.
Finally, we assessed the predictive power of the salivary electrolytes, pH and total protein as well as oral microbiota for discriminating ECC status using machine-learning analyses. Similar to our recent studies [Citation22], the machine-learning model based on saliva bacterial profiles can classify disease states with a moderate performance. Interestingly, the predictive power of disease classifier based on salivary electrolytes outperformed that based on the oral microbiota. The seemingly unexpected findings provide novel insights into developing ECC diagnostic tools using saliva samples. (i) The underexplored host variables may confound the oral microbiome association with disease and limited its predictive power in discriminating the disease status in a relatively large study. Despite the great potentials in predictive modeling of human diseases, studies also clearly demonstrated that many under-sampled factors (e.g. individual’s genetics, diet, lifestyle, physiological state, etc.) can contribute to the variation of the oral microbiome among individuals [Citation72,Citation73]. Among these, oral disease states can only explain less than 10% of the variation in the oral microbiome. Thus, how to detrend the effect of other confounding factors on saliva microbiota for developing microbiome-based diagnostic and predictive tools for dental caries remains particularly challenging and merits further investigation [Citation74–76]. (ii) Salivary electrolytes and pH can be more sensitive to the physiological changes on the tooth surfaces than oral microbiota. ECC is essentially an outcome of the continuous demineralization of the crystalline mineral structure of the dental hard issues [Citation77,Citation78]. From this perspective, saliva electrolytes should be highly indicative of the speed and direction of the cariogenic pathways in the disease development (i.e. de- and re-mineralization dynamic process) [Citation78,Citation79]. Moreover, electrolytes are more stable in salivary fluid and relate to the ultimate products of complex metabolic interactions between host and microbiome [Citation80]. From the perspective of clinical practice, the electrolyte-based diagnostic model should merit more attention in the future study. Finally, considering the simplicity, efficiency and cost-effectiveness of a diagnostic or prediction tool of ECC in the clinical practice, oral microbiome profiling still have apparent limitations. For example, it heavily relies on DNA sequencing, which is subject to time-consuming and cost issues. These limitations hamper its broad applications to the on-site disease diagnosis or prediction in the clinical settings. In contrast, the ECC diagnostic model based on salivary biochemical indices is a more patient- and doctor-friendly method and holds the potential to be developed as a remote and automated approach [Citation81].
However, there are also limitations that should be emphasized. First, we only analyzed saliva samples, but we have no idea of plaque samples, which could provide different results. Second, we compared pH values, total protein, and some specific electrolytes, but the metabolites were not measured. Third, functional information of the microbiome was unrevealed. Lastly, our research is a preliminary exploratory experiment to understand the ability of saliva biochemical indicators and microbiome to distinguish caries and health and provide ideas and new biomarkers for risk assessment. In the subsequent work, we will conduct follow-up studies including more indices and following up the survey to evaluate the predictive power of these markers on caries.
In summary, our study showed that the microbial abundance and electrolytic concentration differed between ECC and healthy individuals and these biomarkers also exhibited strong correlations with disease severity. The ECC diagnostic models were established and compared based on the quantitative profiles of saliva microbial and biochemical compositions. Saliva samples are host-friendly and straightforward for monitoring and evaluating caries risk regularly and effectively. The classifier based on biochemical features outperformed the salivary microbiomes-based and composite-based one (both microbial and biochemical data) in predicting the ECC status. The salivary electrolyte levels can reflect the balance of demineralization and remineralization in the micro-environment that is positively associated with the onset and progression of dental caries, thus providing an essential proxy for developing a better diagnostic model.
Abbreviations
AUROC: area under the receiver operating characteristic curve; Br−: bromine; Ca2+: calcium; Cl−: chlorine; dmft: the number of decayed, missing, and filled teeth in the deciduous dentition; ECC: Early childhood caries; ECM: electronic caries monitor; F−: fluoride; ICDAS: International Caries Detection and Assessment System; K+: potassium; Mg2+: magnesium; Na+: sodium; NH4+: ammonium salt; NO2−: nitrite; NO3−: nitrate; OTU: operational taxonomic unit; PERMANOVA: permutational multivariate analysis of variance; PO43-: phosphate; PTR-LUM: photothermal radiometry and modulated luminescence; RF: Random Forests; SO42-: sulfate; TP: total protein.
Contributions
YZ, SH, SJ, FT, and FY conceived and designed the research, YZ, SJ, SL, LZ, and FT collected samples. SL, FL, LZ, JL and KT prepared samples. YZ, SH and SJ carried out the experiments with the supervision of ZS, SL, FL, LZ, JL, and KT. SH, YZ and ZS analyzed data and drew figures. YZ, SH, FT and FY wrote the paper. All authors have reviewed and approved the final version of the manuscript.
Supplemental Material
Download MS Word (1.7 MB)Acknowledgements
This work was funded by 81,670,979 and 31,600,099 from the National Natural Science Foundation of China and grant SKLOD2019OF04 from the State Key Laboratory of Oral Diseases (SKLOD) Open Fund. We are grateful to the department of stomatology of Qingdao Municipal Hospital for excellent technical support in the sampling of children.
Supplementary material
Supplemental data for this article can be accessed here.
Disclosure statement
The authors have declared that no competing interest exists.
Additional information
Funding
References
- Benjamin RM. Oral health: the silent epidemic. 433021. 2010;125(2):158–14.
- Li MY, Zhi QH, Zhou Y, et al. Impact of early childhood caries on oral health-related quality of life of preschool children. Eur J Paediatr Dent. 2015;16(1):65–72.
- Selwitz RH, Ismail AI, Pitts NB. Dental caries. Lancet. 2007;369(9555):51–59.
- Thomson WM. Public health aspects of paediatric dental treatment under general anaesthetic. Dent J (Basel). 2016;4(2). DOI:https://doi.org/10.3390/dj4020020
- Schroth RJ, Pang JL, Levi JA, et al. Trends in pediatric dental surgery for severe early childhood caries in Manitoba, Canada. J Can Dent Assoc. 2014;80:e65.
- Phantumvanit P, Makino Y, Ogawa H, et al. WHO global consultation on public health intervention against early childhood caries. Community Dent Oral Epidemiol. 2018;46(3):280–287. .
- Teo TK, Ashley PF, Louca C. An in vivo and in vitro investigation of the use of ICDAS, DIAGNOdent pen and CarieScan PRO for the detection and assessment of occlusal caries in primary molar teeth. Clin Oral Investig. 2014;18(3):737–744.
- Nuvvula S, Bhumireddy JR, Kamatham R, et al. Diagnostic accuracy of direct digital radiography and conventional radiography for proximal caries detection in primary teeth: a systematic review. J Indian Soc Pedod Prev Dent. 2016;34(4):300–305.
- Ferreira Zandona A, Santiago E, Eckert G, et al. Use of ICDAS combined with quantitative light-induced fluorescence as a caries detection method. Caries Res. 2010;44(3):317–322.
- Bader JD, Shugars DA, Bonito AJ. A systematic review of the performance of methods for identifying carious lesions. J Public Health Dent. 2002;62(4):201–213.
- Gomez J, Tellez M, Pretty IA, et al. Non-cavitated carious lesions detection methods: a systematic review. Community Dent Oral Epidemiol. 2013;41(1):54–66.
- Wenzel A, Kirkevang LL. Students’ attitudes to digital radiography and measurement accuracy of two digital systems in connection with root canal treatment. Eur J Dent Educ. 2004;8(4):167–171.
- Gomez J. Detection and diagnosis of the early caries lesion. BMC Oral Health. 2015;15(Suppl 1):S3.
- Pretty IA, Ekstrand KR. Detection and monitoring of early caries lesions: a review. Eur Arch Paediatr Dent. 2016;17(1):13–25.
- Katkar RA, Tadinada SA, Amaechi BT, et al. Optical coherence tomography. Dent Clin North Am. 2018;62(3):421–434.
- Abogazalah N, Ando M. Alternative methods to visual and radiographic examinations for approximal caries detection. J Oral Sci. 2017;59(3):315–322.
- Huysmans MC, Longbottom C. The challenges of validating diagnostic methods and selecting appropriate gold standards. J Dent Res. 2004;83(Spec No C):C48–52.
- Ekstrand KR, Zero DT, Martignon S, et al. Lesion activity assessment. Monogr Oral Sci. 2009;21:63–90.
- Dzidic M, Collado MC, Abrahamsson T, et al. Oral microbiome development during childhood: an ecological succession influenced by postnatal factors and associated with tooth decay. Isme J. 2018;12(9):2292–2306.
- Wang Y, Wang S, Wu C, et al. Oral microbiome alterations associated with early childhood caries highlight the importance of carbohydrate metabolic activities. mSystems. 2019;4(6). DOI:https://doi.org/10.1128/mSystems.00450-19.
- Tanner ACR, Kressirer CA, Rothmiller S, et al. The caries microbiome: implications for reversing dysbiosis. Adv Dent Res. 2018;29(1):78–85.
- Teng F, Yang F, Huang S, et al. Prediction of early childhood caries via spatial-temporal variations of oral microbiota. Cell Host Microbe. 2015;18(3):296–306.
- Zhu C, Yuan C, Ao S, et al. The predictive potentiality of salivary microbiome for the recurrence of early childhood caries. Front Cell Infect Microbiol. 2018;8:423.
- Kidd E, Fejerskov O. Changing concepts in cariology: forty years on. Dent Update. 2013;40(4):277–278, 280–272, 285–276.
- Gao X, Jiang S, Koh D, et al. Salivary biomarkers for dental caries. Periodontol 2000. 2016;70(1):128–141.
- Tanaka M, Margolis HC. Release of mineral ions in dental plaque following acid production. Arch Oral Biol. 1999;44(3):253–258.
- Mei ML, Nudelman F, Marzec B, et al. Formation of fluorohydroxyapatite with silver diamine fluoride. J Dent Res. 2017;96(10):1122–1128.
- Abou Neel EA, Aljabo A, Strange A, et al. Demineralization-remineralization dynamics in teeth and bone. Int J Nanomedicine. 2016;11:4743–4763.
- Lippert F. Chapter 3: macroelements: ca, Na, K, P, Cl. Monogr Oral Sci. 2020;28:22–31.
- Duncan C, Dougall H, Johnston P, et al. Chemical generation of nitric oxide in the mouth from the enterosalivary circulation of dietary nitrate. Nat Med. 1995;1(6):546–551.
- Novo DR, Mello JE, Rondan FS, et al. Bromine and iodine determination in human saliva: challenges in the development of an accurate method. Talanta. 2019;191:415–421.
- Hicks J, Garcia-Godoy F, Flaitz C. Biological factors in dental caries: role of saliva and dental plaque in the dynamic process of demineralization and remineralization (part 1). J Clin Pediatr Dent. 2003;28(1):47–52.
- Lu HX, Tao DY, Lo ECM, et al. The 4th national oral health survey in the Mainland of China: background and methodology. Chin J Dent Res. 2018;21(3):161–165. .
- Pyati SA, Naveen Kumar R, Kumar V, et al. Salivary flow rate, pH, buffering capacity, total protein, oxidative stress and antioxidant capacity in children with and without dental caries. J Clin Pediatr Dent. 2018;42(6):445–449.
- WHO (World Health Organization) Oral Health Surveys: Basic Methods. 5th ed. WHO; Monts, France: 2013. pp. 42–47.
- Assaf AV, Meneghim Mde C, Zanin L, et al. Assessment of different methods for diagnosing dental caries in epidemiological surveys. Community Dent Oral Epidemiol. 2004;32(6):418–425.
- Seow WK. Clinical diagnosis of enamel defects: pitfalls and practical guidelines. Int Dent J. 1997;47(3):173–182.
- Chen ZF, Darvell BW, Leung VW. Validation of ion chromatography for human salivary anionic analysis. Arch Oral Biol. 2004;49(11):855–862.
- Dilhari A, Sampath A, Gunasekara C, et al. Evaluation of the impact of six different DNA extraction methods for the representation of the microbial community associated with human chronic wound infections using a gel-based DNA profiling method. AMB Express. 2017;7(1):179.
- Teng F, Darveekaran Nair SS, Zhu P, et al. Impact of DNA extraction method and targeted 16S-rRNA hypervariable region on oral microbiota profiling. Sci Rep. 2018;8(1):16321.
- Jing G, Sun Z, Wang H, et al. Parallel-META 3: comprehensive taxonomical and functional analysis platform for efficient comparison of microbial communities. Sci Rep. 2017;7(1):40371.
- McDonald D, Price MN, Goodrich J, et al. An improved Greengenes taxonomy with explicit ranks for ecological and evolutionary analyses of bacteria and archaea. Isme J. 2012;6(3):610–618.
- Su X, Xu J, Ning K. Meta-Storms: efficient search for similar microbial communities based on a novel indexing scheme and similarity score for metagenomic data. Bioinformatics. 2012;28(19):2493–2501.
- Park SN, Lim YK, Kook JK. Development of quantitative real-time PCR primers for detecting 42 oral bacterial species. Arch Microbiol. 2013;195(7):473–482.
- Jing G, Liu L, Wang Z, et al. Microbiome search engine 2: a platform for taxonomic and functional search of global microbiomes on the whole-microbiome level. mSystems. 2021;6(1). DOI:https://doi.org/10.1128/mSystems.00943-20.
- Al-Hebshi NN, Baraniya D, Chen T, et al. Metagenome sequencing-based strain-level and functional characterization of supragingival microbiome associated with dental caries in children. J Oral Microbiol. 2019;11(1):1557986.
- He J, Tu Q, Ge Y, et al. Taxonomic and functional analyses of the supragingival microbiome from caries-affected and caries-free hosts. Microb Ecol. 2018;75(2):543–554. .
- Chen W, Jiang Q, Yan G, et al. The oral microbiome and salivary proteins influence caries in children aged 6 to 8 years. BMC Oral Health. 2020;20(1):295.
- Johansson I, Witkowska E, Kaveh B, et al. The microbiome in populations with a low and high prevalence of caries. J Dent Res. 2016;95(1):80–86.
- Leone CW, Oppenheim FG. Physical and chemical aspects of saliva as indicators of risk for dental caries in humans. J Dent Educ. 2001;65(10):1054–1062.
- Dawes C, Wong DTW. Role of saliva and salivary diagnostics in the advancement of oral health. J Dent Res. 2019;98(2):133–141.
- Gross EL, Beall CJ, Kutsch SR, et al. Beyond Streptococcus mutans: dental caries onset linked to multiple species by 16S rRNA community analysis. PLoS One. 2012;7(10):e47722.
- Li Y, Ge Y, Saxena D, et al. Genetic profiling of the oral microbiota associated with severe early-childhood caries. J Clin Microbiol. 2007;45(1):81–87.
- Belstrom D, Fiehn NE, Nielsen CH, et al. Altered bacterial profiles in saliva from adults with caries lesions: a case-cohort study. Caries Res. 2014;48(5):368–375.
- Becker MR, Paster BJ, Leys EJ, et al. Molecular analysis of bacterial species associated with childhood caries. J Clin Microbiol. 2002;40(3):1001–1009.
- Van Houte J. Role of micro-organisms in caries etiology. J Dent Res. 1994;73(3):672–681.
- Kianoush N, Adler CJ, Nguyen KA, et al. Bacterial profile of dentine caries and the impact of pH on bacterial population diversity. PLoS One. 2014;9(3):e92940.
- Kressirer CA, Chen T, Lake Harriman K, et al. Functional profiles of coronal and dentin caries in children. J Oral Microbiol. 2018;10(1):1495976.
- Takahashi N. Oral microbiome metabolism: from “Who are they?” to “What are they doing?”. J Dent Res. 2015;94(12):1628–1637.
- Yasunaga H, Takeshita T, Shibata Y, et al. Exploration of bacterial species associated with the salivary microbiome of individuals with a low susceptibility to dental caries. Clin Oral Investig. 2017;21(8):2399–2406.
- Kreth J, Merritt J, Shi W, et al. Competition and coexistence between Streptococcus mutans and Streptococcus sanguinis in the dental biofilm. J Bacteriol. 2005;187(21):7193–7203.
- Doel JJ, Hector MP, Amirtham CV, et al. Protective effect of salivary nitrate and microbial nitrate reductase activity against caries. Eur J Oral Sci. 2004;112(5):424–428.
- Radcliffe CE, Akram NC, Hurrell F, et al. Effects of nitrite and nitrate on the growth and acidogenicity of Streptococcus mutans. J Dent. 2002;30(7–8):325–331.
- Zaura E, Twetman S. Critical appraisal of oral pre- and probiotics for caries prevention and care. Caries Res. 2019;53(5):514–526.
- Karshan M. Ammonia, urea and dental caries. Alpha Omegan. 1946;40:17–20.
- LeGeros RZ. Calcium phosphates in oral biology and medicine. Monogr Oral Sci. 1991;15:1–201.
- Lakomaa EL, Rytomaa I. Mineral composition of enamel and dentin of primary and permanent teeth in Finland. Scand J Dent Res. 1977;85(2):89–95.
- De Sousa ET, Lima-Holanda AT, Nobre-Dos-Santos M. Changes in the salivary electrolytic dynamic after sucrose exposure in children with early childhood caries. Sci Rep. 2020;10(1):4146.
- Lenton S, Nylander T, Teixeira SC, et al. A review of the biology of calcium phosphate sequestration with special reference to milk. Dairy Sci Technol. 2015;95(1):3–14.
- Duggal MS, Chawla HS, Curzon ME. A study of the relationship between trace elements in saliva and dental caries in children. Arch Oral Biol. 1991;36(12):881–884.
- Hara AT, Zero DT. The caries environment: saliva, pellicle, diet, and hard tissue ultrastructure. Dent Clin North Am. 2010;54(3):455–467.
- Kahharova D, Brandt BW, Buijs MJ, et al. Maturation of the oral microbiome in caries-free toddlers: a longitudinal study. J Dent Res. 2020;99(2):159–167. .
- Mason MR, Nagaraja HN, Camerlengo T, et al. Deep sequencing identifies ethnicity-specific bacterial signatures in the oral microbiome (vol 8, e77287, 2013). PLoS One. 2014;9(6):e99933.
- Hurley E, Barrett MPJ, Kinirons M, et al. Comparison of the salivary and dentinal microbiome of children with severe-early childhood caries to the salivary microbiome of caries-free children. BMC Oral Health. 2019;19(1). DOI:https://doi.org/10.1186/s12903-018-0693-1
- Jiang S, Gao XL, Jin LJ, et al. Salivary microbiome diversity in caries-free and caries-affected children. Int J Mol Sci. 2016;17(12):1978.
- Yang F, Zeng XW, Ning K, et al. Saliva microbiomes distinguish caries-active from healthy human populations. Isme J. 2012;6(1):1–10. .
- Fejerskov O. Concepts of dental caries and their consequences for understanding the disease. Community Dent Oral Epidemiol. 1997;25(1):5–12.
- Featherstone JD. The continuum of dental caries–evidence for a dynamic disease process. J Dent Res. 2004;83(Spec No C):C39–42.
- Gonzalez-Cabezas C. The chemistry of caries: remineralization and demineralization events with direct clinical relevance. Dent Clin North Am. 2010;54(3):469–478.
- Engevik MA, Versalovic J. Biochemical features of beneficial microbes: foundations for therapeutic microbiology. Microbiol Spectr. 2017;5(5). DOI:https://doi.org/10.1128/microbiolspec.BAD-0012-2016
- Nie S, Henley WH, Miller SE, et al. An automated integrated platform for rapid and sensitive multiplexed protein profiling using human saliva samples. Lab Chip. 2014;14(6):1087–1098. .