
 ?Mathematical formulae have been encoded as MathML and are displayed in this HTML version using MathJax in order to improve their display. Uncheck the box to turn MathJax off. This feature requires Javascript. Click on a formula to zoom.
ABSTRACT
Purpose: The microbiome is considered an environmental factor that contributes to the progression of several neurodegenerative diseases. However, the association between microbiome and glaucoma remains unclear. This study investigated the features of the oral microbiome in patients with glaucoma and analyzed the microbiome biomarker candidates using a machine learning approach to predict the severity of glaucoma.
Methods: The taxonomic composition of the oral microbiome was obtained using 16S rRNA gene sequencing, operational taxonomic unit analysis, and diversity analysis. The differentially expressed gene (DEG) analysis was performed to determine the taxonomic differences between the microbiomes of patients with glaucoma and the control participants. Multinomial logistic regression and association rule mining analysis using machine learning were performed to identify the microbiome biomarker related to glaucoma severity.
Results: DEG analysis of the oral microbiome of patients with glaucoma revealed significant depletion of Lactococcus (P = 3.71e−31), whereas Faecalibacterium was enriched (P = 9.19e−14). The candidate rules generated from the oral microbiome, including Lactococcus, showed 96% accuracy for association with glaucoma.
Conclusions: Our findings indicate microbiome biomarkers for glaucoma severity with high accuracy. The relatively low oral Lactococcus in the glaucoma population suggests that microbial dysbiosis could play an important role in the pathophysiology of glaucoma.
Introduction
Glaucoma is a progressive optic neuropathy characterized by the degeneration of the retinal ganglion cells and their axons, with a corresponding visual field defect [Citation1]. Intraocular pressure (IOP) is a major risk factor for glaucoma development. A high IOP exerts tremendous stress and strain on the lamina cribrosa, consequently blocking the axoplasmic flow [Citation2]. However, glaucomatous axon loss also occurs in individuals with normal IOP, and the risk of glaucoma development might differ even in individuals with the same IOP; thus, glaucoma should be assessed as a complex neurodegenerative disease. Candidate factors associated with glaucoma pathogenesis include aging, inflammation [Citation3], and immune responses, including heat shock proteins or local inflammatory responses [Citation4–8]. As progressive retinal ganglion cell loss is a pathophysiological feature in patients, glaucoma shares signs and symptoms with other neurodegenerative diseases, including Alzheimer’s disease [Citation9]. A population-based cohort study reported a significant association of glaucoma with Alzheimer’s disease, suggesting a potential link between neurodegenerative brain diseases and retinal neurodegenerative diseases [Citation10,Citation11].
Technological advances in next-generation sequencing (NGS) and bioinformatics tools have identified an association of human microbiota with neurodegenerative diseases and autoimmunity. The altered human microbiome, or microbial dysbiosis, can contribute to the pathogenesis of several diseases [Citation12]. Although the ocular microbiome is related to eye diseases, non-ocular microbiome such as an oral microbiome could influence the pathogenesis of eye disease [Citation3,Citation6,Citation13,Citation14]. The microbiota-gut-brain axis involves a cross-talk between the gut and microbiota; enteric bacteria enters the circulation and crosses the blood-brain barrier, or to penetrates the brain via the vagus nerve [Citation15,Citation16]. Since the oral microbiome is a part of the gut microbiome family and 5% of oral species are found in the intestine, the microbiome-gut-retinal axis may have clinical importance. A previous study that investigated the relationship between microbiota and glaucoma reported high oral bacterial loads, such as Streptococcus species, in patients with glaucoma [Citation7]. To date, only a few studies have investigated the influence of the gut microbiome on glaucoma. Therefore, this study aimed to investigate the differences in the oral microbiome in patients with glaucoma based on the microbiota-gut-retinal axis, and identify the candidate microbiome biomarkers related to glaucoma pathogenesis and severity using machine learning prediction models.
Material and methods
Participants
This multicentric study was conducted by researchers from Veterans Health Service (VHS) Medical Center, Daegu Veterans Hospital, Pusan National University Yangsan Hospital, and Pusan National University Hospital. The study protocol was approved by the Institutional Review Board of each participating center. The study was performed in accordance with the tenets of the Declaration of Helsinki and written informed consent was obtained from all participants before their enrollment.
During the study period, the research team enrolled patients with glaucoma who satisfied the inclusion criteria. Glaucoma was defined as having glaucomatous optic neuropathy, such as rim thinning, notching, retinal nerve fiber layer (RNFL) defect, or glaucomatous visual field defects. The control group was defined as participants with 1) a visual acuity of 20/40 or better; and/or those without 2) a glaucomatous optic nerve head or RNFL defect, visual field defect, or other retinal diseases; or 3) a history of IOP-lowering treatment. Participants with a history of ocular surgery (except uncomplicated cataract surgery), history of ocular trauma, or other diseases affecting the visual field (e.g. diabetic retinopathy) were excluded. Participants with a dental issue, those with probiotics use within the last 1 month, those with upper respiratory infection symptoms within the last two weeks, and those taking antibiotics or using topical antibiotic eye drops within the last one month were additionally excluded.
Sample collection and DNA extraction
The oral microbiome was collected by swabbing the right and left buccal surfaces and under the tongue four times using the Gene kit (Daeil pharm company, Korea) after washing the oral cavity with clean drinking water. Metagenomic DNA was individually extracted from swabs using the GeneAll ExgeneTM Blood/Clinic/Cell SV mini kit (GeneAll, Seoul, Korea) according to the manufacturer’s instructions. The DNA was stored at −80°C following DNA extraction, and the quantity and quality of the isolated DNA were measured using Trinean Dropsense 96 (Unchained Labs, Pleasanton, CA, USA) and PicoGreen (Thermo Fisher Scientific, Waltham, MA, USA).
Sequencing of 16S rRNA gene amplicon
A 16S rRNA sequencing library was generated according to the 16S metagenomic sequencing library preparation protocol (Illumina, San Diego, CA, USA), targeting the V3 and V4 hypervariable regions of the 16S rRNA gene, which were selected based on the results reported previously [Citation17]. The KAPA HiFi HotStart ReadyMix (Kapa Biosystems, Wilmington, MA, USA) and Agencourt AMPure XP system (Beckman Coulter Genomics, Brea, CA, USA) were used for polymerase chain reaction (PCR) amplification and amplicon purification, respectively. The Illumina adapter overhang nucleotide sequences were added to the gene-specific sequences. The following full-length primer sequences were used to target these adapters:
16S Amplicon PCR Forward Primer:
5ʹ TCGTCGGCAGCGTCAGATGTGTATAAGAGACAGCCTACGGGNGGCWGCAG
16S 3ʹ
Amplicon PCR Reverse Primer
5ʹ GTCTCGTGGGCTCGGAGATGTGTATAAGAGACAGGACTACHVGGGTATCTAATCC 3ʹ
After magnetic bead-based purification of the PCR products, a second PCR with a limited cycle was performed using primers from the Nextera XT Index Kit (Illumina). Subsequently, the purified PCR products were visualized using gel electrophoresis and quantified with a Qubit dsDNA HS Assay Kit (Thermo Fisher Scientific) on a Qubit 3.0 fluorometer. The samples were pooled and assayed using Agilent 2100 bioanalyzer (Agilent) for pre-sequencing quality analysis. The previously generated sequencing libraries were quantified by qPCR using the CFX96 Real-Time System (Bio-Rad, Hercules, CA, USA). After normalization, the libraries were sequenced on the MiSeq system (Illumina) with 300 bp paired-end reads.
Pre-processing
The adaptor sequences were removed from the original paired-end reads using CutAdapt v1.11. Next, merged reads were generated using the adaptor-trimmed paired-end reads using FLASH v1.2.11. The low-quality merged reads were filtered according to the following criteria: reads that had ≥2 ambiguous nucleotides, reads with average quality score <20, and reads with length <300 bp after trimming of low-quality bases. Finally, potential chimeric reads were removed using UCHIME v4.2.40 [Citation18].
Calculation of Operational Taxonomic Units (OTUs) and diversity analysis
The pre-processed reads from each sample were used to calculate the number of OTUs, which were determined by clustering the sequences from each sample with a 97% sequence identity cut-off using QIIME software (v.1.9.0, www.quiime.org) [Citation19,Citation20]. The taxonomic abundance was counted with Ribosomal Database Project (RDP) Classifier v1.1, with a confidence threshold of 0.8 derived from the pre-processed reads of each sample [Citation21]. The microbial composition in the samples was normalized using the value calculated by a division between the taxonomic abundance count and the number of pre-processed reads for each sample. Consensus sequences were clustered using cd-hit v4.6 using the following parameters – identify, >99%; and coverage, >80% – and then, aligned with the reference sequences from the National Center for Biotechnology Information (NCBI) database using the Megablast algorithm. Finally, taxonomic profiling was performed for the assembled genome using NCBI taxonomy information. The alpha-diversity for observed OTUs and Shannon index within the samples were calculated. Principal component analysis (PCoA) was performed using the result from the beta-diversity for the glaucoma and control groups, as well as for subgroup analysis.
Machine learning-based identification of microbiome biomarker for glaucoma severity
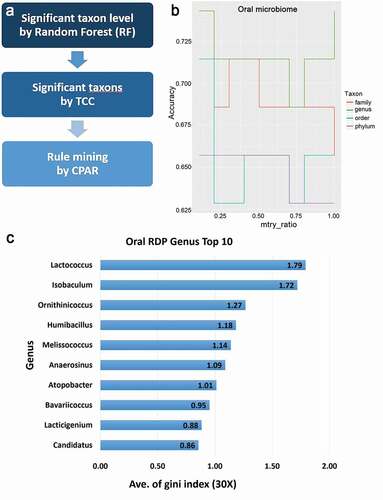
Machine learning-based identification of glaucoma biomarkers consisted of three steps: significant taxon level identification by Random Forest (RF), identification of a significant taxon by Tag Count Comparison (TCC), and rule mining of the microbiome. RF model-based machine learning was performed with the R software (R Foundation for Statistical Computing, Vienna, Austria) using ‘ranger’ package [Citation22]. Within each run, the number of trees (num.tree) was set to build the RF model [Citation23–25]. The number of variables/taxa that could be selected in each splitting node (mtry) was set to a range of one-tenth of the maximum taxon number at each taxonomic level. The Gini index evaluated the importance of each taxon, and the prediction accuracy was determined by . Hundred runs were performed for each mtry parameter within each taxonomic hierarchy. We calculated the significant taxa using TCC (http://bioconductor.org/), which provides functions for differential expression analysis of genes (DEG) with normalization and multi-group comparison [Citation25]. With TCC analysis, significant oral microbiome differences were analyzed in the glaucoma group, compared to the control group, and in the primary open-angle glaucoma (POAG) subgroups, compared to the control group.
Before rule mining, a multinomial logistic regression (MLR) was performed to analyze the significance of the identified microbiome biomarker in patients with glaucoma based on the clinical factors, such as age, baseline IOP level, RNFL thickness (assessed using optical coherence tomography [OCT]), and mean deviation value in the Humphrey visual field. Patients aged <60 years comprised the younger age group, and those ≥60 years comprised the older age group. The baseline IOP cut-off was 20 mmHg; normal baseline IOP, <20 mmHg; and high baseline IOP, ≥20 mmHg. Although arbitrary, this value is acceptable for statistical processing since the IOP criterion for normal-tension glaucoma is based on a cut-off of 21 mmHg, and the mean IOP of Asians is 1–2 mmHg lower than the other ethnicities. For glaucoma severity, the glaucoma group was divided into ≥80 μm and <80 μm subgroups based on the RNFL thickness. For functional glaucoma severity, the glaucoma group was stratified according to Anderson’s glaucoma stage criteria: ≥−6.0 dB, −6.0 to −12.0 dB, and <−12.0 dB.
The classification based on the predictive association rules (CPAR) algorithm was used to generate a complete ruleset [Citation24]. This algorithm, which uses information metrics to generate rules, is more suited for bioinformatics applications than conventional support-confidence based measures for market basket data analysis [Citation26]. The Laplace accuracy evaluated the accuracy of the CPAR-derived rules. Using rule r, the Laplace accuracy is defined as below:
where m, number of target groups; Ntotal, total number of examples that satisfy the body of the rules; and Ng, number of examples that belong to the predicted target group. Only the POAG subgroup was used for subgroup analysis using MLR and CPAR because of insufficient sample size in secondary glaucoma (SG) group.
Data analyses
All the data analyses were performed using the R Statistical Package, Version 3.6.2 (R Foundation for Statistical Computing, Vienna, Austria). Statistical significance was set at P < 0.05. For multiple comparison tests in DEG analysis, the false discovery rate was controlled using the Benjamini–Hochberg step-up procedure [Citation27,Citation28].
Results
Patient characteristics and metagenomic data
Ninety-six patients with glaucoma and 25 controls were recruited from March 2019 to December 2019. The glaucoma group had 62 POAG and 34 SG patients (SG cases were mostly uveitic glaucoma). There was no difference in age and sex between patients with glaucoma and the normal participants (). In the glaucoma groups, the baseline IOP was 18.49 mmHg, which was higher than that (13.76 mmHg) of the normal participants. RNFL thickness, a structural indicator of glaucoma, was low in glaucoma patients, and the visual field index, a functional indicator, was moderately advanced glaucoma. The number of the average lead counts/sample of the control group was higher than that of the glaucoma group (P = 0.038). Results of machine learning using the RF method showed that genus level identification was significant in 193 mtry (accuracy, 0.5714–0.7429) than those identified based on family, order, and phylum, and Lactococcus had the highest Gini indices (, ).
Table 1. Demographic and baseline characteristics of glaucoma subjects
Table 2. Gini index for accuracy condition in genus levels using random forest machine learning
Figure 1. Metagenome analysis using machine learning and statistical models
Diversity analysis in glaucoma patients and control subjects
On comparisons of the alpha-diversity of oral microbiome between glaucomatous and control subjects, the observed OTUs (P = 0.003 and P = 0.011, respectively) and the Shannon index (P = 6.1e−6 and P = 3.6e−5, respectively; ) were significantly higher in the control participants than that in the glaucoma group and glaucoma subgroups. PCoA of beta-diversity for the oral microbiome showed that the microbial clusters in the glaucoma and control groups differed in their taxonomy (). On subgroup analysis, the microbial clusters in POAG and SG subgroups were similar, but that in the control group was different. The beta-distance calculated from the RDP classifier showed significant differences, but the beta-distance from the NCBI method was not different between the glaucoma and control groups (P < 2.2e−16, P = 0.52, respectively; ), whereas the beta-distance of subgroup analysis showed a significant difference in the oral microbiome (P < 2.2e−16).
Figure 2. Comparison of alpha-diversity in glaucoma patients as compared with the control subjects
Figure 3. Differences in the oral microbiome of glaucoma patients compared with control subjects using principal component analysis for beta-diversity
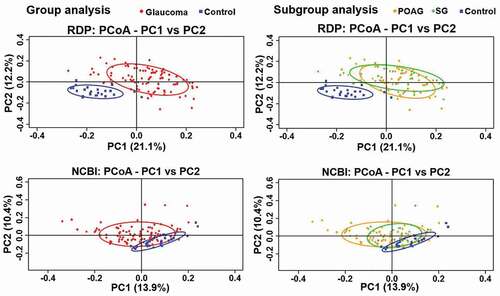
Figure 4. Beta-Diversity differences in the microbiome of glaucoma patients and control subjects

DEG analysis in glaucoma group and subgroup
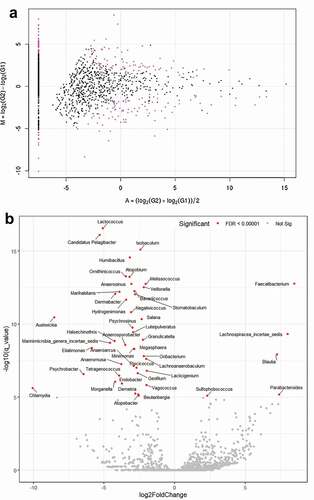
For TCC-based taxon significance analysis, the MA plot revealed the different quantities of some species and the DEG analysis showed various taxa such as Lactococcus and Atopobium were significantly depleted (P = 3.71e−31, P = 6.69e−21, respectively), whereas Faecalibacterium was enriched in the glaucoma group (P = 9.19e−14) compared with control participants (, Supplementary Table S1). On subgroup analysis, the volcano plot of the oral microbiome showed that Lactococcus, Candidatus Pelagibacter, and Isobaculum were significantly depleted P = 1.67e−20, P = 9.37e−20, and P = 1.43e−18, respectively, whereas Faecalibacterium and Lachnospiracea incertae sedis were enriched (P = 7.21e−16 and P = 6.02e−12, respectively) in the POAG subgroup compared with the control group ( and Supplementary Table S2).
Figure 5. MA and volcano plots generated using analysis with tag count comparison for oral microbiome of glaucoma patients and control subjects
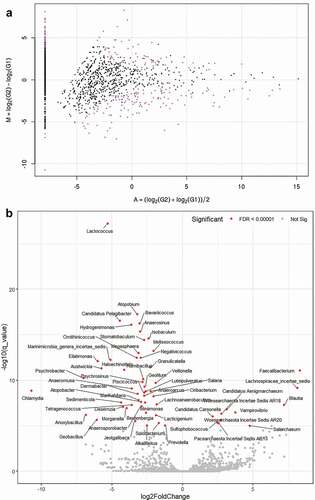
Figure 6. MA and volcano plots generated using subgroup analysis with tag count comparison for oral microbiome in the POAG subgroups compared with the control group
MLR and association rules mining analysis for biomarkers of glaucoma
The Lactococcus, Candidatus Pelagibacter, and Atopobium were the significant taxa for factors age and baseline IOP. In addition, they were significantly associated with glaucoma severity based on RNFL thickness and visual field index (). Association rule generated by CPAR showed two ‘glaucoma’ rules and four ‘normal’ rules generated with a high accuracy in the 0.9–0.96 range (). ‘Glaucoma’ rule 1 is the most accurate, which states that if the microbial composition is Atopobium ≤0.347, Candidatus Pelagibacter ≤0.001, Endobacter ≤0.015, and Lactococcus ≤0.013, the sample patients is glaucomatous (accuracy, 96.0%). Similarly, ‘glaucoma’ rule 2 states that if the composition is Lactococcus, ≤0.013, the patient is ‘glaucoma’ (accuracy, 90.0%). Contrarily, ‘normal’ rule 1 states that if the composition is Candidatus Pelagibacter, 0.001–0.014 and Lactococcus, 0.013–0.889, the patient is ‘normal’ (accuracy, 92.0%).
Table 3. Multinomial logistic regression analysis of factors related taxon in glaucoma group compared with control subjects
Table 4. Association rules generated by association rule mining for glaucoma using oral microbiome data
MLR and association rules mining analysis for biomarkers of POAG
In patients with POAG aged <60 years, Lactococcus was the significant taxon, whereas Lactococcus, Candidatus Pelagibacter, and Atopobium were the significant taxa in patients with POAG aged ≥60 years (). In the POAG group with baseline IOP <20 mmHg, Lactococcus, Candidatus Pelagibacter, and Atopobium were the significant taxa, whereas Lactococcus and Atopobium were the significant taxa in the POAG group with baseline IOP≥20 mmHg (). According to glaucoma severity based on RNFL thickness and visual field index in the POAG group, Lactococcus, Candidatus Pelagibacter, and Atopobium were the significant taxa. CPAR-derived association rule shows one ‘POAG’ rule and four ‘normal’ rules derived with high accuracy (). The ‘POAG’ rule 1 states that if the composition is Atopobium, ≤0.433; Candidatus Pelagibacter, ≤0.001; Endobacter, ≤0.015; and Lactococcus, ≤0.015, the patient has POAG (accuracy, 93.0%). The ‘normal’ rule 1 states that if the composition is Candidatus Pelagibacter, 0.001–0.014, the patients is ‘normal’ (accuracy, 93.0%).
Table 5. Multinomial logistic regression analysis of factors related taxon in primary open-angle glaucoma
Table 6. Association rules generated by association rule mining for primary open-angle glaucoma
Discussion
In this study, we demonstrated that the oral microbiome in patients with glaucoma was different from that of the elderly without glaucoma, and identified candidate microbiome biomarkers for glaucoma severity with high accuracy using machine learning. Our study findings are consistent with those of previous studies in that we suggested a possible relationship between microbiome and glaucoma [Citation3–5,Citation7,Citation29]. This relationship can be interpreted in several ways. As an immunity problem, the microbiome acts as a possible antigen, which may activate T-helper cell development and increased the production of antibodies. The trabecular meshwork cells can recognize the bacterial antigen, a pathogen-associated molecular pattern, such as the toll-like receptor, to generate imbalanced signaling of inflammation [Citation30]. Although this mechanism is not fully understood, it is considered that this cascade results in the anterior chamber-associated immune deviation, which induces immune cell activation as well as homing to the ocular region [Citation29].
A previous study on the association of glaucoma and the oral microbiome has shown that altered commensal microbiome induces changes in cytokine signaling and complement activation [Citation7]. In addition, one possible mechanism by which the microbiome could aid the management of glaucoma is by modulating brain-derived neurotrophic factor levels, as shown in an animal model [Citation31]. From the perspective of neuroprotection, microbiome research suggests that the pathogenesis of glaucoma may be identified. According to the study by Astafurov et al., oral bacterial load, such as of Streptococcus spp., in glaucoma cases was increased compared with the control [Citation7]. However, in our study, the bacterial diversity was not significantly high in glaucoma patients, but there was a significant difference in the composition of the bacteria, such as Faecalibacterium, which was overexpressed in patients with glaucoma. Faecalibacterium modulated the butyrate metabolite in the gut, which was known to be related to anti-inflammatory effect [Citation32]. Mental health disease such as major depression negatively correlated with Faecalibacterium, which was different in Alzheimer's disease and Parkinson’s disease [Citation32]. However, it should be judged in consideration of the overall microbiome composition. Additionally, another study on the intestinal microbiota profile and POAG showed that Megamonas and Bacteroides load was decreased in POAG [Citation33]. The study found negative correlations between visual acuity and Blautia and between the mean deviation of visual field and Faecalibacterium, and a positive correlation between RNFL thickness and Streptococcus. This study also showed that the gut microbiome might differ between glaucoma and control subjects, which is consistent with the results of our study, although taxa expression level was different due to differences in the targeted gut microbiome.
The reduced Lactococcus load in the oral microbiome suggests that dysbiosis in the microbiota could play a role in the pathophysiology of glaucoma and can be used as a surrogate marker for glaucoma. It may be due to competition with other taxa in the oral microbiome or decreased antimicrobial activity of H2O2 produced by downregulation of the lactic acid bacteria. Gastrointestinal permeability is altered depending on diet and microbiota. In this regard, diet enriched with a high sugar content may cause a decrease in the number of beneficial microbes [Citation34], which may directly or indirectly affect the development of glaucoma. The carbohydrate ingestion in POAG patients showed systemic autonomic dysregulation [Citation35], whereas ketogenic diets and modified gut microbiome and permeability may play a role in neuroprotection in glaucoma patients [Citation36,Citation37].
Several similarities may exist in glaucoma and neurodegenerative disease, as the optic nerve is a part of the central nerve system [Citation38,Citation39]. Hence, the microbiome study of Parkinson’s disease and Alzheimer’s disease may provide new insights into glaucoma research, suggesting that microbial dysbiosis can induce or exacerbate the disease via toxic effects from direct invasion or epigenetic changes [Citation40]. One example of commensal pathogenic bacteria is H. Pylori, which has been associated with the risk of several neurodegenerative diseases, including Parkinson’s disease, Alzheimer’s disease, and POAG [Citation41–43].
A major strength of our study is the inclusion of a relatively large number of glaucoma samples from multiple centers using metagenomic analysis. In addition, our study used recently developed bioinformatics technology and machine learning for analysis. However, there are several limitations to this study. First, it was difficult to determine causality in this study; we could not determine whether the microbiome biomarker alone is a bystander or culprit. This study is worthwhile as an early study to suggest biomarkers that could be related to the identification of the severity of glaucoma. Additional verification is needed using cell-based and animal model studies for mechanisms. The validation study by PCR would provide for more reliable results, although the NGS technology has improved. Another limitation was the small sample size of the control group compared to that of glaucoma patients. A large number of control subjects (over 50 control subjects) and other replication cohorts will be required for further validation. The sample size for metagenomics research is usually 30; as such, our sample size was not very small. However, larger-scale prospective studies in the future are necessary to support our study results. This study was conducted as a multi-center study, and it could potentially be biased by the inclusion of people living at various locations of Korea. The microbiome may vary according to different time points and physical conditions. The repeatability of microbiome results can be established by obtaining different samples from the same individuals. Finally, the taxa preferentially selected for analysis were limited by the computing resources for machine learning modeling.
In conclusion, the oral microbiome in patients with glaucoma was different from that in control participants that indicated disturbing environmental influences on the pathogenesis of glaucoma via the microbiota-gut-retina axis. Our findings highlight the identification of microbiome biomarkers for glaucoma severity with high accuracy. The reduced Lactococcus count in the oral cavity suggests that dysbiosis in microbiota could play a role in the pathogenesis of glaucoma.
Ethical approval
The study protocol was approved by the Institutional Review Board (IRB) of each participating center—Veterans Health Service Medical Center, Korea (IRB No. 2018-12-015 and IRB No. 2020-06-025) Pusan National University Hospital (IRB No. H-1904-001-077); Daegu Veterans Health Service Medical Center (IRB No. 2019-001); and Pusan National University Yangsan Hospital (IRB No.05-2019-022).
Informed consent
Written informed consent was obtained from all subjects before their enrollment in the study.
Financial disclosure
This study was supported by a VHS Medical Center Research Grant, Republic of Korea (grant number: VHSMC 19043)
Conflicts of interest
The authors have no conflicts of interest to declare.
Supplemental Material
Download Zip (246.4 KB)Acknowledgments
We thank Theragen Bio for providing technical support for genome sequencing and metagenome analysis.
Disclosure statement
No potential conflict of interest was reported by the author(s).
Supplementary material
Supplemental data for this article can be accessed here.
Correction Statement
This article has been republished with minor changes. These changes do not impact the academic content of the article.
Additional information
Funding
References
- Quigley HA. Glaucoma. Lancet. 2011;377(9774):1367–14.
- Fechtner RD, Khouri AS. Evolving global risk assessment of ocular hypertension to glaucoma. Curr Opin Ophthalmol. 2007;18(2):104–109.
- Nayyar A, Gindina S, Barron A, et al. Do epigenetic changes caused by commensal microbiota contribute to development of ocular disease? A review of evidence. Hum Genomics. 2020;14(1):11.
- Chen H, Cho KS, Vu THK, et al. Commensal microflora-induced T cell responses mediate progressive neurodegeneration in glaucoma. Nat Commun. 2018;9(1):3209.
- Polla D, Astafurov K, Hawy E, et al. A pilot study to evaluate the oral microbiome and dental health in primary open-Angle glaucoma. J Glaucoma. 2017;26(4):320–327.
- Gupta A. Harnessing the microbiome in glaucoma and uveitis. Med Hypotheses. 2015;85(5):699–700.
- Astafurov K, Elhawy E, Ren L, et al. Oral microbiome link to neurodegeneration in glaucoma. PLoS One. 2014;9(9):e104416.
- Wax MB, Tezel G, Saito I, et al. Anti-Ro/SS-A positivity and heat shock protein antibodies in patients with normal-pressure glaucoma. Am J Ophthalmol. 1998;125(2):145–157.
- Almasieh M, Wilson AM, Morquette B, et al. The molecular basis of retinal ganglion cell death in glaucoma. Prog Retin Eye Res. 2012;31:152–181.
- Ramirez AI, de Hoz R, Salobrar-Garcia E, et al. The role of Microglia in retinal neurodegeneration: Alzheimer’s disease, Parkinson, and glaucoma. Front Aging Neurosci. 2017;9:214.
- Lin IC, Wang YH, Wang TJ, et al. Glaucoma, Alzheimer’s disease, and Parkinson’s disease: an 8-year population-based follow-up study. PLoS One. 2014;9(10):e108938.
- Qin J, Li R, Raes J, et al. A human gut microbial gene catalogue established by metagenomic sequencing. Nature. 2010;464(7285):59–65.
- Lu LJ, Liu J. Human microbiota and ophthalmic disease. Yale J Biol Med. 2016;89:325–330.
- Lin P. Importance of the intestinal microbiota in ocular inflammatory diseases: a review. Clin Exp Ophthalmol. 2019;47(3):418–422.
- Sandhu KV, Sherwin E, Schellekens H, et al. Feeding the microbiota-gut-brain axis: diet, microbiome, and neuropsychiatry. Transl Res. 2017;179:223–244.
- van de Wouw M, Schellekens H, Dinan TG, et al. Microbiota-Gut-Brain axis: modulator of host metabolism and appetite. J Nutr. 2017;147(5):727–745.
- Klindworth A, Pruesse E, Schweer T, et al. Evaluation of general 16S ribosomal RNA gene PCR primers for classical and next-generation sequencing-based diversity studies. Nucleic Acids Res. 2013;41(1):e1.
- Edgar RC, Haas BJ, Clemente JC, et al. UCHIME improves sensitivity and speed of chimera detection. Bioinformatics. 2011;27(16):2194–2200.
- Bolyen E, Rideout JR, Dillon MR, et al. Reproducible, interactive, scalable and extensible microbiome data science using QIIME 2. Nat Biotechnol. 2019;37(8):852–857.
- Lopez-Garcia A, Pineda-Quiroga C, Atxaerandio R, et al. Comparison of Mothur and QIIME for the analysis of rumen microbiota composition based on 16S rRNA amplicon sequences. Front Microbiol. 2018;9:3010.
- Cole JR, Wang Q, Fish JA, et al. Ribosomal Database Project: data and tools for high throughput rRNA analysis. Nucleic Acids Res. 2014;42:D633–42.
- Wright M, Ziegler A. ranger: a fast implementation of random forests for high dimensional data in C++ and RJ stat. Softw. 1–17 2017;77.
- Chang HX, Haudenshield JS, Bowen CR, et al. Metagenome-Wide association study and machine learning prediction of bulk soil microbiome and crop productivity. Front Microbiol. 2017;8:519.
- Yin X, Cpar: HJ Classification based on predictive association rules. Proceedings of the 2003 SIAM International Conference on Data Mining: San Francisco, CA: SIAM; 2003. p. 331–335.
- Sun J, Nishiyama T, Shimizu K, et al. TCC: an R package for comparing tag count data with robust normalization strategies. BMC Bioinformatics. 2013;14(1):219.
- Agrawal R, Imieliński T, Swami A Mining association rules between sets of items in large databases. Proceedings of the 1993 ACM SIGMOD international conference on Management of data; Washington D.C. USA; 1993. p. 207–216.
- Benjamini YHY. Controlling the false discovery rate: a practical and powerful approach to multiple testing. J R Stat Soc Series B. 1995;57:289–300.
- Hochberg Y, Benjamini Y. More powerful procedures for multiple significance testing. Stat Med. 1990;9(7):811–818.
- Chaiwiang N, Poyomtip T. Microbial dysbiosis and microbiota-gut-retina axis: the lesson from brain neurodegenerative diseases to primary open-angle glaucoma pathogenesis of autoimmunity. Acta Microbiol Immunol Hung. 2019;66(4):541–558.
- Poyomtip T. Roles of Toll-Like receptor 4 for cellular pathogenesis in primary open-Angle glaucoma: a potential therapeutic strategy. J Microbiol Immunol Infect. 2019;52(2):201–206.
- Martin KR, Quigley HA, Zack DJ, et al. Gene therapy with brain-derived neurotrophic factor as a protection: retinal ganglion cells in a rat glaucoma model. Invest Ophthalmol Vis Sci. 2003;44(10):4357–4365.
- Leylabadlo HE, Ghotaslou R, Feizabadi MM, et al. The critical role of faecalibacterium prausnitzii in human health: an overview. Microb Pathog. 2020;149:104344.
- Gong H, Zhang S, Li Q, et al. Gut microbiota compositional profile and serum metabolic phenotype in patients with primary open-angle glaucoma. Exp Eye Res. 2020;191:107921.
- Beilharz JE, Kaakoush NO, Maniam J, et al. The effect of short-term exposure to energy-matched diets enriched in fat or sugar on memory, gut microbiota and markers of brain inflammation and plasticity. Brain Behav Immun. 2016;57:304–313.
- Cao L, Graham SL, Pilowsky PM. Carbohydrate ingestion induces differential autonomic dysregulation in normal-tension glaucoma and primary open angle glaucoma. PLoS One. 2018;13(6):e0198432.
- Ma D, Wang AC, Parikh I, et al. Ketogenic diet enhances neurovascular function with altered gut microbiome in young healthy mice. Sci Rep. 2018;8(1):6670.
- Zarnowski T, Tulidowicz-Bielak M, Kosior-Jarecka E, et al. A ketogenic diet may offer neuroprotection in glaucoma and mitochondrial diseases of the optic nerve. Med Hypothesis Discov Innov Ophthalmol. 2012;1:45–49.
- Gupta N, Yucel YH. Glaucoma as a neurodegenerative disease. Curr Opin Ophthalmol. 2007;18(2):110–114.
- Danesh-Meyer HV, Levin LA. Glaucoma as a neurodegenerative disease. J Neuroophthalmol. 2015;35(Suppl 1):S22–8.
- Spielman LJ, Gibson DL, Klegeris A. Unhealthy gut, unhealthy brain: the role of the intestinal microbiota in neurodegenerative diseases. Neurochem Int. 2018;120:149–163.
- Kountouras J, Zavos C, Zeglinas C, et al. Helicobacter pylori–Related impact on glaucoma pathophysiology. Invest Ophthalmol Vis Sci. 2015;56(13):8029–8030.
- Dardiotis E, Tsouris Z, Mentis AA, et al. H. pylori and Parkinson’s disease: meta-analyses including clinical severity. Clin Neurol Neurosurg. 2018;175:16–24.
- Fani L, Wolters FJ, Ikram MK, et al. Helicobacter pylori and the risk of dementia: a population-based study. Alzheimers Dement. 2018;14(10):1377–1382.