
ABSTRACT
Background
Streptococcus mutans is a major pathogen responsible for dental caries. Arginine is a promising potential caries preventive agent which can inhibit the growth of S. mutans. However, the mechanism whereby arginine inhibits S. mutans growth remains unclear.
Aim
To assess the impact of arginine-induced metabolomic perturbations on S. mutans under biofilm conditions.
Methods
We identified 5,933 and 7,413 ions in positive (ESI+) and negative (ESI-) electrospray ion modes, respectively, with a total of 11.05% and 11.58% differential ions subsequently detected in two respective modes. Further analyses of these metabolites led to identification of 8 and 22 metabolic pathways that were affected by arginine treatment in ESI+ and ESI- modes.,
Results
Once or twice daily treatments of S. mutans biofilms with arginine resulted in reductions in biofilm biomass. Significant reductions in EPS production were observed following twice daily arginine treatments. Identified metabolites that were significantly differentially abundant following arginine treatment were associated with glycolysis metabolism, amino sugar and nucleotide sugar metabolism, and peptidoglycan synthesis.
Conclusions
Arginine can reduce S. mutans biofilm growth and acid production by inhibiting glycolysis, amino sugar and nucleotide sugar metabolism, and peptidoglycan synthesis.
Background
Dental caries is a persistent oral health burden throughout the globe, affecting individuals of all ages. Approximately 60%-90% of children are affected by dental caries according to reports from The World Health Organization (WHO). In published data from 2005 to 2008, the prevalence of dental caries among children aged 5–15 in the Eastern Mediterranean Region was 65%, 61%, and 70% in individuals that were 5, 12 and 15 years old [Citation1]. The prevalence of dental caries was 50% among Polish individuals aged 35–44 in analyses conducted in 1998, 2002 and 2010 [Citation2]. In addition, rates of dental caries in individuals 60 years or older ranged from 25% in Australia to 99% in South Africa from 2016 to 2020 [Citation3]. The results of the 3rd and 4th National Oral Health Survey suggest that the incidence of dental caries affecting deciduous teeth has risen over the past decade, with early childhood caries (ECC) rates having risen from 66.0% to 71.9%, with the mean numbers of decayed, missing and filled teeth having increased from 2.71 to 4.23 [Citation4]. Dental caries of the permanent teeth is also one of the 10 most prevalent forms of disease affecting human quality of life [Citation5,Citation6]. Hence, identifying effective prevention or treatment strategies is therefore vital in order to improve the lives of affected patients.
Dental caries development is closely linked to fermentable carbohydrates metabolism. In response to the intermittent intake of dietary fermentable carbohydrates, which bacteria ultilize as a rich source of fermentable sugars, species such as streptococci and Actinomyces produce lactic acid, resulting in a drop in biofilm pH [Citation7,Citation8]. In dental caries, low pH drives the selection and enrichment of acidogenic and aciduric bacteria in oral biofilms [Citation8]. Streptococcus mutans is a key acidogenic/aciduric microbe capable of driving the development of dental caries. The metabolic processing of sucrose and other carbohydrates by S. mutans can result in the production of exopolysaccharide (EPS) and acid end products such as lactate [Citation9,Citation10]. EPS, in turn, promotes the formation of a biofilm that can protect bacteria from harm, while acid end products can dissolve the enamel in order to facilitate caries development [Citation9,Citation11]. There is a positive correlation between S. mutans detection in dental plaque and the clinical prevalence of dental caries [Citation12]. Relative to those in individuals with dental caries, commensals such as Streptococcus gordonii in caries-free individuals are homeostasis-favoring, exhibiting an alcalogenic potential, and are present at high levels in caries-free individuals [Citation13]. Identifying effective approaches to promote the expansion of commensal microbes with a homeostasis-favoring potential in caries-free individuals may be a valuable approach to prevent S. mutans-driven biofilm formation and dental caries.
Previous studies have demonstrated that L-arginine can regulate the development of cariogenic biofilms via arginolytic bacteria [Citation14–16]. Arginolytic bacteria such as S. gordonii are capable of processing arginine through the arginine deiminase pathway (ADS) to yield ammonia, which in turn facilitates the neutralization of glycolytic acids and increase the pH within oral biofilms [Citation17]. Arginine is also capable of impairing S. mutans adhesion and biofilm development, but arginine alone has limited impact on the growth of planktonic bacteria [Citation16–19]. Arginine can also synergize with fluoride and is not associated with any specific adverse side effects when used to treat early coronal and root caries in combination with fluoride [Citation20]. Arginine metabolism promotes biofilm pH homeostasis, whereas fluoride is thought to enhance the resistance of tooth minerals to low pH and reduce acid production by oral biofilms [Citation20,Citation21]. Arginine, therefore, represents a valuable tool for the control of dental caries.
Metabolomic dysregulation has previously been detected in hosts treated with specific drugs in response to pathogen infections [Citation22,Citation23]. How arginine alters metabolic activities in S. mutans has rarely been studied [Citation24,Citation25]. Herein, we conduct the first analysis to our knowledge exploring metabolic changes associated with the arginine treatment of S. mutans biofilms via a liquid chromatography-tandem mass spectroscopy (LC-MS/MS)-based metabolomics approach, highlighting the potential value of this treatment strategy as a means of controlling dental caries.
Material and methods
Biofilm model establishment for biomass and exopolysaccharide analyses
S. mutans UA159 (ATCC700610) was cultured in brain heart infusion (BHI) broth overnight at 37°C in a 5% CO2 aerobic incubator. Bacteria were then centrifuged for 5 min at 8,000 g, washed twice with 0.9% saline, and resuspended in fresh BHI containing 1% sucrose at 107 CFU/mL [Citation26]. To develop a biofilm model, 200 μL of these cells were added per well of a 96-well plate and were incubated as above. Preparations of L-arginine (USA, Sigma-aldrich, A5131, CAS1119-34-2; 0.75%, 1.5%, 3%, and 8% in filter-sterilized water) were added, followed by washing with 0.9% saline. Samples in the control group were treated with the same volume of 0.9% saline. Bacteria were treated with arginine either one or two times. For one-time treatment, arginine was added at the 8 h time point, while for two-time treatment, arginine was added at the 8 and 20 h time points. Treatments were maintained for 10 min. Control samples were replaced with fresh BHI+sucrose at corresponding time points as appropriate.
Assessment of biofilm biomass, EPS production, and pH values
We utilized a modified crystal violet (CV) staining protocol to evaluate biofilm biomass [Citation27]. At appropriate time points, biofilms were washed twice with 0.9% saline, after which they were stained for 15 min using 0.1% CV (100 μL/well). After staining, biofilms were again washed twice with saline and were solubilized using 100% ethanol. A 100 μL volume of each sample was then transferred into a newly prepared 96-well plate, and absorbance at 570 nm was quantified for triplicate samples. Congo red (CR) staining was used to evaluate EPS production [Citation28]. Following appropriate incubation periods, biofilms were washed using 0.9% saline, and each well was stained with a mixture of BHI (100 μL) and CR (0.5 mM; 50 μL). After staining, media from each well was centrifuged for 5 min at 10,000 g. Supernatants were then transferred to microtiter plates and absorbance at 490 nm was then evaluated for triplicate samples. Optical density (OD) values were used to measure EPS production as follows: EPS production = OD blank control-OD supernatant. Supernatant pH values for treated biofilms were tested with a pH microelectrode (Sartorius, Germany) [Citation29].
Biofilm preparation for metabolomics analyses
A 1,000 µL cell sample (107 CFU/mL in fresh BHI + 1% sucrose) was added per well of a 24-well plate to facilitate biofilm development, with plates being incubated at 37°C in a 5% CO2 aerobic incubator. Biofilm samples were either treated with 1,000 µL 0.9% saline (control) or were directly treated with 1,000 µL 1.5% (w/v) arginine for 10 min at the 8 and 20 h time points. Following these two exposures, the biofilm culture was maintained until the 24 h time point, at which time aliquots of biofilm samples (100 μL) were combined for 1 min with 300 μL methanol. A TissueLyser was then used to homogenize these samples for 5 min at 50 Hz. Samples were then stored for 2 h at −20°C, after which they were spun for 15 min at 25,000 g at 4°C prior to metabolomic analysis. Samples were prepared in sextuplicate.
LC-MS/MS-based metabolomics detection
A 2777 C ultraperformance liquid chromatography (UPLC) system (Waters, UK) was used for chromatographic separation, with reverse-phase separation being conducted with an ACQUITY UPLC HSS T3 column (Waters; 100 mm × 2.1 mm, 1.8 μm). Columns were maintained at 50°C with a 0.4 mL/min flow rate and a mobile phase composed of water and 0.1% formic acid (A) and methanol and 0.1% formic acid (B). Gradient elution conditions were as follows: 0–2 min, 100% A; 2–11 min, 0% B-100% B; 11–13 min, 100% B; 13–15 min, 0%A-100% A. The injection volume for each sample was 5 µL. A high-resolution tandem mass spectrometer Xevo G2 XS QTOF (Waters) was used for detecting metabolites in column eluates. Q-TOF operation was conducted in ESI+ and ESI- modes. Capillary and sampling cone voltages for ESI+ and ESI- modes were, respectively, 3.0 kV/40.0 V and 2.0 kV/40.0 V. MS data were acquired in the Centroid MSE mode, with a 0.2 s scan time and a 40–1,200 Da TOF mass range. All precursors were fragmented using 20–40 eV, with a 0.2 s scan time. Mass accuracy was calibrated by acquiring an LE signal every 3 s. The stability of these data acquisition analyses was evaluated by acquiring a QC sample after every 10 sample acquisitions. QC samples were prepared by mixing 10 µL from each prepared sample prior to analysis. This pooled QC sample enabled the production of a mean profile offering insight into all metabolites present within analyzed samples.
Data processing and analysis
All metabolomic data were imported into Progenesis QI (v2.2, Waters), which was used to detect, align, group and normalize peaks. Retention time (RT)-m/z data pairs were utilized to identify ion intensities for detected peaks. The metaX software [Citation30] was used to further process normalized peaks. Any metabolite that had a relative standard deviation (RSD) of >30% in pooled QC samples was removed from this analysis. Instrument stability and separation between groups were evaluated via PCA and PLS-DA, respectively. PCA was conducted using the prcomp function in R. The Q2 and R2 values were utilized as a means of evaluating PLS-DA model performance and quality. Data were converted into a log2 format, and were scaled via the Pareto method prior to PLS-DA modeling. We additionally used metaX to assess the variable importance in the projection (VIP) threshold of the first two PLS-DA model principal components. Metabolites that were differentially abundant between untreated and arginine-treated biofilm samples were identified via VIP with a threshold > 1 in the PLS-DA model, fold-change ≥1.20 or ≤0.8333 and corrected p values (q value) < 0.05. All the data were submitted to the MetaboLights under study MTBLS3020.
Metabolite annotation and pathway analysis
The identified metabolites that were differentially abundant in this study were mapped onto Kyoto Encyclopedia of Genes and Genomes (KEGG, http://www.genome.jp/kegg/) reference pathways. Those pathways that were significantly enriched for these metabolites were identified based on a false discovery rate-adjusted hypergeometric test statistic (p < 0.05).
Gene expression analysis
Eleven genes (glmU, murA, murZ, murB, murC, murD, murE, murF, ldh, pykF, and scrA) associated with key metabolic analyses were selected for expression analyses. The 24 h biofilm preparation time point used for this experiment was consistent with that employed for metabolomics analyses, and a biofilm sample was also collected immediately after the second arginine treatment (at 20 h) in group 3. Total RNA was extracted from these samples using the miRNeasy Mini Kit (Qiagen, Germany) according to the manufacturer’s instructions, and was then reverse transcribed into cDNA using the PrimeScript™ RT reagent Kit (TAKARA Cat RR037A). Primers for RT-PCR and endogenous control (16S rRNA) sequences were designed using the Primer 5.0 software (Table 1 of Appendix). RT- PCR was performed using a 20 μL Power 2× SYBR RT- PCR premixture (Takara TB Green® Premix Ex Taq™ II (Tli RNaseH Plus)) containing 10 µL of 2× SYBR Premix Ex TaqII, 1 µL each of forward and reverse primers, 1 µL of cDNA, and 7 µL of RNase-free H2O. The amplification program settings were as follows: 95°C for 30 s; 40 cycles of 95°C for 5 s and 53°C for 25 s. At the end of the reaction, a melting curve was generated.
Statistical analyses
Biofilm biomass, EPS production, pH values and gene expression levels were analyzed using the IBM SPSS 20.0 (IBM, Armonk, NY). The Shapiro–Wilk test was used to determine whether the data were normally distributed. T-tests were used for data conforming to the normal distribution, while Mann-Whitney U tests were otherwise used. p< 0.05 was considered statistically significant.
Results
Assessment of the impact of arginine on biofilm biomass and EPS production
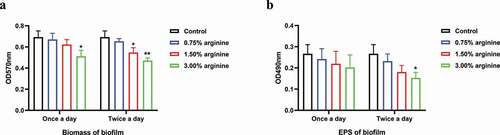
We found that S. mutans biofilm treatment with 3% arginine at a single time point was associated with a significant reduction in biofilm biomass relative to untreated control samples by approximately 0.739-fold (p = 0.016). In addition, we found that treating these biofilms twice per day with 1.5% and 3.0% arginine resulted in a significant reduction in biofilm biomass relative to control by approximately 0.789- and 0.680-fold, respectively (p = 0.011 and 0.001, respectively) (). No significant differences in EPS production were observed in any samples treated once per day with arginine (p = 0.361), whereas twice daily 3% arginine treatment was associated with a reduction in EPS synthesis relative to control samples by approximately 0.574-fold (p = 0.015; ). The pH values did not vary significantly between control groups and samples treated with 0.75%, 1.5%, and 3% arginine twice a day (p = 0.833) (4.23 ± 0.09, 4.24 ± 0.07, 4.27 ± 0.05, 4.27 ± 0.04, and 4.25 ± 0.06 for these groups, respectively).
Figure 1. Assessment of S. mutans biofilm biomass and EPS production after 24 h. (a) Biofilm biomass and (b) EPS production by S. mutans treated with arginine (0%, 0.75%, 1.50%, or 3.00%) for 10 min one time (8 h) or two times (8 h and 20 h) were evaluated. Treatment groups were compared to control (0%) groups. *p < 0.05; **p < 0.01.
Metabolic profile summaries
Identification of differentially abundant ions
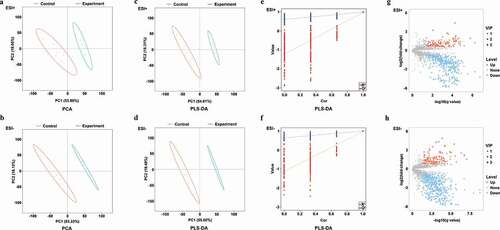
Arginine-treated and control samples were clearly separated from one another on PCA plots ( and b) and in partial least squares-discriminate analysis (PLS-DA) ( and d), indicating clear metabolomic differences between these two groups. The goodness of fit (R2) and predictive ability (Q2) of the PLS-DA model were additionally evaluated, with 200 permutation tests having been performed as shown in (ESI+ model, R2 = 0.993, Q2 = 0.970) and 2 f (ESI-, R2 = 0.997, Q2 = 0.976). A total of 11.05% (566/5,124) and 11.58% (655/5,654) of ions identified in ESI+ and ESI-, respectively, were found to be differentially abundant, with more ions being downregulated rather than upregulated. In the ESI+ mode, 2.81% (144/5,124) and 8.24% (422/5,124) of ions were up- and down-regulated in the treatment group, respectively, (). In the ESI- mode, 2.85% (161/5,654) and 8.74% (494/5,654) of ions were up- and down-regulated in the treatment group, respectively ().
Figure 2. PCA, PLS-DA plots, and differentially abundant ions identified in ESI+ and ESI- modes for treatment and control group samples. (a-b) PCA plots for ESI+ and ESI- modes; (c-d) PLS-DA plots for ESI+ and ESI- modes; (e-f) Validation plots were obtained from 200 permutation tests in (c) ESI+ (R2 = 0.993 and Q2 = 0.970) and (d) ESI- (R2 = 0.997 and Q2 = 0.976) modes; (g) Differentially abundant ions identified in the ESI+ mode; (h) Differentially abundant ions identified in the ESI- mode.
Assessment of metabolic pathways associated with differentially abundant ions
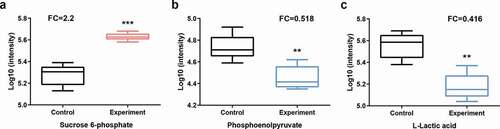
We identified 8 and 22 metabolic pathways that were significantly affected by arginine treatment in ESI+ and ESI- modes, respectively (). The most significantly affected pathways included the peptidoglycan biosynthesis and vancomycin resistance pathways, which had both low p-values and high pathway impact scores. Metabolites including N-acetylglucosamine (GlcNAc)-6-P, uridine diphosphate (UDP)-GlcNAc, UDP-GlcNAc-enopyruvate, UDP-MurNAc, UDP-MurNAc-L-Ala, UDP-MurNAc-L-Ala-γ-D-Glu, UDP-MurNAc-L-Ala-γ-D-Glu-L-Lys, and UDP-MurNAc-L-Ala-γ-D-Glu-L-Lys-D-Ala-D-Ala associated with amino sugar and nucleotide sugar metabolism (SMU00520) and peptidoglycan biosynthesis (SMU00550) were significantly down-regulated in the arginine treatment group by approximately 0.574-, 0.364-, 0.265-, 0.586-, 0.099-, 0.567-, 0.345-, and 0.384-fold, respectively (). Glycolysis (SMU00010), fructose metabolism (SMU00500), and starch and sucrose metabolism (SMU00051) pathways were also assessed and contained multiple differentially abundant metabolites, although the enrichment was not significant (p > 0.05). Three differentially abundant metabolites were associated with these pathways, including sucrose-6-phosphate (sucrose-6-P), phosphoenolpyruvate, and L-lactic acid. The upstream metabolite sucrose-6-P was upregulated (2.209-fold), whereas the downstream phosphoenolpyruvate and L-lactic acid metabolites were downregulated (0.518 and 0.416-fold, respectively) in the treatment group samples ().
Figure 3. Pathways that were enriched for differentially abundant metabolites. (a-b) The number of involved metabolites (p< 0.05) in a specific pathway; (c-d) Enriched pathways for these metabolites (p < 0.05). Lower p values and higher pathway impact factors indicate a more significant pathway impact.
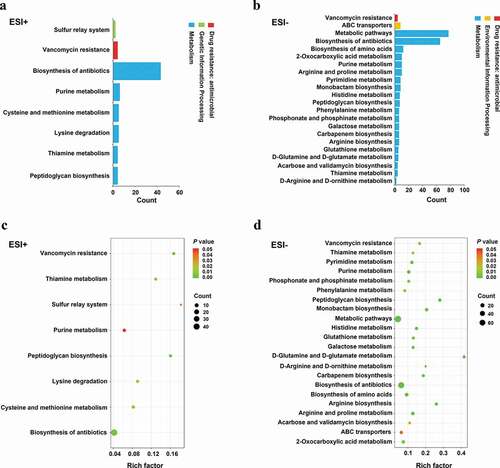
Figure 4. Amino sugar and nucleotide sugar metabolism and peptidoglycan synthesis in S. mutans.
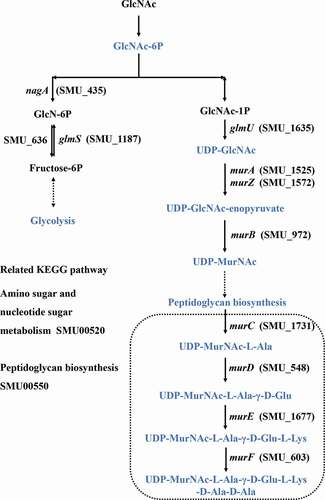
Figure 5. Statistical assessment of differentially expressed metabolites in pathways listed in . P = phosphate.
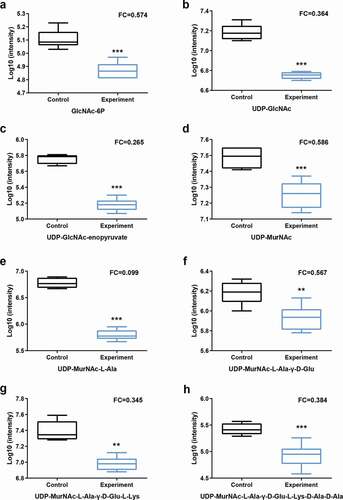
Figure 6. Sucrose uptake and utilization in S. mutans.
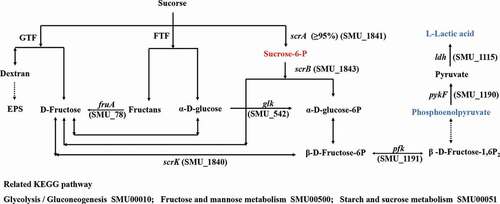
Figure 7. Statistical assessment of differentially expressed metabolites in pathways listed in . P = phosphate.
Evaluation of metabolic pathway-related gene expression
The relative expression levels of glmU, murA, murZ, murB, murC, murD, murE, murF, ldh, pykF, and scrA in metabolic pathways related to the differentially abundant metabolites listed in were analyzed. To explore the expression changes in the expression of these genes in the biofilm after arginine intervention, we analyzed biofilm samples immediately after arginine treatment at the 20 h time point. There were therefore three sample groups in these experiments: a 24 h biofilm model (control, experiment-1) and a 20 h biofilm model (experiment 2). The expression levels of glmU, murF, and pykF associated with the production of UDP-GlcNAc, UDP-MurNAc-L-Ala-γ-D-Glu-L-Lys-D-Ala-D-Ala, and phosphoenolpyruvate were downregulated after arginine intervention, respectively. However, no significant differences were observed between Exp-1 and Exp-2 groups (). The expression levels of murC were decreased in the Exp-2 group immediately following arginine intervention at the 20 h time point. No significant difference was detected in the levels of murA, murZ, murB, murD, murE, or ldh expression.
Figure 8. Gene expression analysis related to differentially expressed metabolites in pathways listed in . Control and Exp-1 represent the 24 h biofilm model without and with arginine intervention, respectively. Exp-2 represents the biofilm model treated with arginine a second time (20 h). The expression level of glmU in the control was defined as 1. *p < 0.05; **p < 0.01.
Discussion
LC-MS/MS based metabolomics technologies have made metabolomics analyses far more feasible, enabling the comprehensive assessment of metabolites present in eukaryotes and prokaryotes under a range of different conditions [Citation31–34]. A previous study showed metabolite changes of dental plaque after treatment with toothpaste containing 1.5% arginine [Citation21]. Dental plaque is a complex environment, which contains many microorganisms. It is a difficult problemto understand the mechanism of arginine on microorganism of dental caries. Considering that S. mutans plays an important role in the occurrence of dental caries and 1.5% arginine significantly inhibits the biofilm of S. mutans, we strove to explore the potential mechanism of arginine inhibiting S. mutans and specifically to match the results to the KEGG database of S. mutans. The expression levels of genes related to differential metabolites in the target pathway were evaluated as well. Both of our studies can potentially add value to existing knowledge on the anti-caries effect of arginine. We found that the metabolites associated with glycolysis metabolism, amino sugar and nucleotide sugar metabolism, and peptidoglycan synthesis were significantly differentially abundant after arginine treatment.
Previous work has demonstrated that 1.5% arginine treatment can effectively inhibit S. mutans growth while enhancing S. gordonii growth when these two bacteria are grown in a mixed biofilm from 19–53 h. S. gordonii can further inhibit S. mutans growth owing to its ability to produce hydrogen peroxide and ammonia, which can neutralize the acidic environment [Citation16]. When oral microbes are exposed to 1.5% arginine for extended periods of time, this can significantly increase plaque pH as well as the viability of cariogenic bacterial species [Citation35]. In addition, fluoride combined with arginine can achieve more effective anticaries effect compared to fluoride alone. Relative to either agent in isolation, combination NaF (125 ppm) and arginine (2.5%) treatment significantly impacted S. mutans but reportedly enriched Streptococcus sanguinis in a multispecies biofilm [Citation14,Citation16]. In the present study, rather than constantly treating biofilm samples with arginine, we treated them with 1.5% arginine two times (at 8 and 20 h) to better simulate a context wherein someone might use mouthwash twice per day. We found that treatment with 3% arginine one time or with 1.5% arginine two times was sufficient to significantly impair S. mutans biofilm formation. As such, we conducted a metabolomics analysis wherein we compared metabolites found in untreated S. mutans biofilms to those found in biofilms treated with 1.5% arginine two times.
Sucrose has proven to be the most cariogenic carbohydrate that S. mutans can metabolize and is commonly used in S. mutans biofilm studies [Citation36,Citation37]. We incorporated 1% sucrose into the BHI broth to prepare S. mutans biofilms in the present study. Sucrose is a β2,1-linked disaccharide composed of glucose and fructose. It is a substrate of glucosyltransferase (GTF), which can metabolize it into glucans and fructose. Extracellular glucans contribute to EPS accumulation [Citation38]. EPS, in turn, functions as a scaffold that helps to support biofilm formation [Citation38]. We detected no significant differences in glucan levels when comparing untreated and arginine-treated biofilms in our metabolomics analysis, which is consistent with the observed changes in EPS levels in our CR assay. However, we did find that arginine-treated samples exhibited lower biomass than did control samples, which may be a result of changes in the relative abundance of other components of the extracellular matrix that contribute to biofilm formation, such as extracellular DNA or lipoteichoic acids [Citation39,Citation40].
The S. mutans scrA and scrB genes encode the IIScr involved in the phosphoenolpyruvate-dependent sucrose phosphotransferase system (PTS) and sucrose-6-phosphate hydrolase, respectively [Citation41]. IIScr is responsible for more than 95% of the sucrose uptake by cells, after which it is metabolized into sucrose-6-phosphate. The remaining sucrose is believed to be metabolized extracellularly by GTF and fructosyltransferase (FTF) [Citation38]. Sucrose-6-phosphate can then be hydrolyzed to fructose and glucose-6-phosphate by sucrose-6-phosphate hydrolase [Citation42]. We observed that downstream metabolites associated with the glycolysis such as phosphoenolpyruvate and L-lactic acid were strongly downregulated in samples treated with arginine, although the upregulation of some metabolites in this pathway such as sucrose-6-phosphate was also observed.
N-acetyl-D-glucosamine (GlcNAc) is an amino sugar that is used as a source of carbon and nitrogen by many bacteria in order to fuel their growth. In S. mutans, PTS facilitates GlcNAc internalization, thereby supporting glycolysis pathway activity [Citation43]. Upon internalization, GlcNAc is converted to GlcNAc-6-phosphate (GlcNAc-6-P), which is in turn converted by GlcNAc-6-P deacetylase (encoded by nagA) into GlcN-6-P followed by subsequent GlcN-6-P deaminase (nagB) mediated isomerization into fructose-6-P [Citation44]. S. mutans can also synthesize GlcN-6-P from F-6-P using glutamine-fructose-6-phosphate aminotransferase (glmS) and glutamine, thereby providing essential elements that can be utilized for peptidoglycan biosynthesis in the absence of environmental GlcNAc availability [Citation43,Citation45]. Peptidoglycan is an essential bacterial cell wall component that helps to protect the integrity of cells while functioning as a scaffold that can anchor other proteins in place. When peptidoglycan layer assembly is disrupted, this causes the cell wall to weaken and can result in bacterial lysis [Citation46–48]. Arginine has also been shown to inhibit S. mutans growth and biofilm formation [Citation14,Citation16,Citation18]. Herein, we found that extracellular GlcNAc was limited and glycolysis was inhibited, with the majority of internalized GlcNAc therefore being converted into components involved in cell wall synthesis. Metabolites such as GlcNAc-6P, UDP-GlcNAc, UDP-GlcNAc-enopyruvate, and UDP-MurNAc were thus significantly downregulated in arginine-treated samples. This suggests that arginine treatment can significantly weaken S. mutans cell walls, thereby causing lysis of these bacteria. We also found that metabolites associated with vancomycin resistance were significantly impacted by arginine treatment, consistent with the notion that cell wall assembly is a key target of glycopeptide antibiotics [Citation49]. The expression levels of 11 genes related to these differentially abundant metabolites were subsequently evaluated. As multiple melting peaks pertaining to the scrA gene were detected, its expression levels were not analyzed. Three genes exhibited significant changes in expression that were consistent with differentially abundant metabolite production. Other analyzed genes did not exhibit significant changes in expression, suggesting there may be other genes involved in the regulation of these ions, warranting further study in the future.
This study evaluated metabolic changes in S. mutans under biofilm conditions in response to arginine treatment. However, limitation inherent to the pH meter used in the present study prevented us from measuring the biofilm pH. In addition, S. mutans alone does not fully recapitulate the cariogenic environment present within oral biofilms. We focused on the effect of arginine alone on the metabolomic perturbation of S. mutans biofilms without the inclusion of other agents such as fluoride. Additional experiments should be designed and performed to explore that.
Conclusions
In conclusion, under the conditions of the present study, this untargeted LC-MS/MS-based metabolomics assessment of S. mutans revealed that arginine treatment alters S. mutans metabolism by inhibiting glycolysis, amino sugar and nucleotide sugar metabolism, and peptidoglycan synthesis. This inhibitory activity resulted in reductions in S. mutans biofilm biomass and acid production. These findings advance our current understanding of the metabolic response of S. mutans to arginine.
Availability of data and materials
The data can be obtained upon request to the corresponding author. Metabolomic data generated for this study are available at the MetaboLights under study MTBLS3020.
Supplemental Material
Download TIFF Image (17 MB)Disclosure statement
No potential conflict of interest was reported by the author(s).
Supplemental data
Supplemental data for this article can be accessed here
Additional information
Funding
References
- Kale S, Kakodkar P, Shetiya S, et al. Prevalence of dental caries among children aged 5–15 years from 9 countries in the Eastern Mediterranean Region: a meta-analysis. East Mediterr Health J. 2020;26(6):726–13.
- Gaszynska E, Wierzbicka M, Kaleta D, et al. Thirty years of evolution of oral health behaviors in the working-age poles. Int J Occup Med Environ Health. 2014;27(5):774–784.
- Chan AKY, Tamrakar M, Jiang CM, et al. A systematic review on caries status of older adults. Int J Environ Res Public Health. 2021;18(20):10662.
- Du MQ, Li Z, Jiang H, et al. Dental caries status and its associated factors among 3- to 5-year-old children in China: a national survey. Chin J Dent Res. 2018;21:167–179.
- Disease GBD, Injury I, Prevalence C. Global, regional, and national incidence, prevalence, and years lived with disability for 328 diseases and injuries for 195 countries, 1990-2016: a systematic analysis for the global burden of disease study 2016. Lancet. 2017;390:1211–1259.
- Haag DG, Peres KG, Balasubramanian M, et al. Oral conditions and health-related quality of life: a systematic review. J Dent Res. 2017;96(8):864–874.
- de Soet JJ, Nyvad B, Kilian M. Strain-related acid production by oral streptococci. Caries Res. 2000;34(6):486–490.
- Burne RA, Marquis RE. Alkali production by oral bacteria and protection against dental caries. FEMS Microbiol Lett. 2000;193(1):1–6.
- Matsui R, Cvitkovitch D. Acid tolerance mechanisms utilized by Streptococcus mutans. Future Microbiol. 2010;5:403–417.
- Lei L, Yang Y, Mao M, et al. Modulation of Biofilm Exopolysaccharides by the Streptococcus mutans vicX gene. Front Microbiol. 2015;6:1432.
- Koo H, Falsetta ML, Klein MI. The exopolysaccharide matrix: a virulence determinant of cariogenic biofilm. J Dent Res. 2013;92:1065–1073.
- Saraithong P, Pattanaporn K, Chen Z, et al. Streptococcus mutans and Streptococcus sobrinus colonization and caries experience in 3- and 5-year-old Thai children. Clin Oral Investig. 2015;19:1955–1964.
- Agnello M, Marques J, Cen L, et al. Microbiome associated with severe caries in Canadian first nations children. J Dent Res. 2017;96:1378–1385.
- Zheng X, Cheng X, Wang L, et al. Combinatorial effects of arginine and fluoride on oral bacteria. J Dent Res. 2015;94:344–353.
- Nascimento MM, Browngardt C, Xiaohui X, et al. The effect of arginine on oral biofilm communities. Mol Oral Microbiol. 2014;29:45–54.
- He J, Hwang G, Liu Y, et al. l-arginine modifies the exopolysaccharide matrix and thwarts Streptococcus mutans outgrowth within mixed-species Oral Biofilms. J Bacteriol. 2016;198:2651–2661.
- Gordan VV, Garvan CW, Ottenga ME, et al. Could alkali production be considered an approach for caries control? Caries Res. 2010;44:547–554.
- Sharma S, Lavender S, Woo J, et al. Nanoscale characterization of effect of L-arginine on Streptococcus mutans biofilm adhesion by atomic force microscopy. Microbiology. 2014;160:1466–1473.
- Huang X, Zhang K, Deng M, et al. Effect of arginine on the growth and biofilm formation of oral bacteria. Arch Oral Biol. 2017;82:256–262.
- Li J, Huang Z, Mei L, et al. Anti-caries effect of arginine-containing formulations in vivo: a systematic review and meta-analysis. Caries Res. 2015;49:606–617.
- Nascimento MM, Alvarez AJ, Huang X, et al. Metabolic profile of supragingival plaque exposed to Arginine and Fluoride. J Dent Res. 2019;98:1245–1252.
- Zhou CX, Gan Y, Elsheikha HM, et al. Sulfadiazine sodium ameliorates the metabolomic perturbation in mice infected with Toxoplasma gondii. Antimicrob Agents Chemother. 2019;63DOI:.
- Elmassry MM, Mudaliar NS, Colmer-Hamood JA, et al. New markers for sepsis caused by Pseudomonas aeruginosa during burn infection. Metabolomics. 2020;16:40.
- Huang X, Browngardt CM, Jiang M, et al. Diversity in antagonistic interactions between commensal oral Streptococci and Streptococcus mutans. Caries Res. 2018;52(1–20):88–101.
- Yu H, Ganas P, Schwendicke F. Environment-specific probiotic supernatants modify the metabolic activity and survival of Streptococcus mutans in vitro. Front Microbiol. 2020;11:1447.
- Liu S, Tao Y, Yu L, et al. Analysis of small RNAs in Streptococcus mutans under acid stress-a new insight for caries research. Int J Mol Sci. 2016;17(9):1529.
- Fernandes RA, Monteiro DR, Arias LS, et al. Biofilm formation by Candida albicans and Streptococcus mutans in the presence of farnesol: a quantitative evaluation. Biofouling. 2016;32:329–338.
- Misba L, Khan AU. Enhanced photodynamic therapy using light fractionation against Streptococcus mutans biofilm: type I and type II mechanism. Future Microbiol. 2018;13:437–454.
- Zhou Y, Millhouse E, Shaw T, et al. Evaluating Streptococcus mutans strain dependent characteristics in a polymicrobial Biofilm community. Front Microbiol. 2018;9:1498.
- Wen B, Mei Z, Zeng C, et al. metaX: a flexible and comprehensive software for processing metabolomics data. BMC Bioinformatics. 2017;18:183.
- Zhou CX, Zhou DH, Elsheikha HM, et al. Global metabolomic profiling of mice brains following experimental infection with the Cyst-forming Toxoplasma gondii. PloS One. 2015;10:e0139635.
- Zeng C, Wen B, Hou G, et al. Lipidomics profiling reveals the role of glycerophospholipid metabolism in psoriasis. GigaScience. 2017;6:1–11.
- Zhou Y, Zhang X, Chen R, et al. Serum amino acid metabolic profiles of ankylosing spondylitis by targeted metabolomics analysis. Clin Rheumatol. 2020;39(8):2325–2336.
- Sieniawska E, Sawicki R, Golus J, et al. Untargetted metabolomic exploration of the Mycobacterium tuberculosis stress response to cinnamon essential oil. Biomolecules. 2020;10(3):357.
- Ledder RG, Mistry H, Sreenivasan PK, et al. Arginine exposure decreases acidogenesis in long-term oral Biofilm microcosms. mSphere. 2017;2.DOI:
- Kajfasz JK, Katrak C, Ganguly T, et al. Manganese uptake, mediated by SloABC and MntH, is essential for the fitness of Streptococcus mutans. mSphere. 2020;5(1DOI:).
- El-Ezmerli NF, Gregory RL. Effect of nicotine on biofilm formation of Streptococcus mutans isolates from smoking and non-smoking subjects. J Oral Microbiol. 2019;11(1):1662275.
- Lemos JA, Palmer SR, Zeng L, et al. The biology of Streptococcus mutans. Microbiol Spectr. 2019;7(1DOI:).
- Florez Salamanca EJ, Klein MI. Extracellular matrix influence in Streptococcus mutans gene expression in a cariogenic biofilm. Mol Oral Microbiol. 2018;33:181–193.
- Castillo Pedraza MC, Novais TF, Faustoferri RC, et al. Extracellular DNA and lipoteichoic acids interact with exopolysaccharides in the extracellular matrix of Streptococcus mutans biofilms. Biofouling. 2017;33:722–740.
- Sato Y, Poy F, Jacobson GR, et al. Characterization and sequence analysis of the scrA gene encoding enzyme IIScr of the Streptococcus mutans phosphoenolpyruvate-dependent sucrose phosphotransferase system. J Bacteriol. 1989;171:263–271.
- Hiratsuka K, Wang B, Sato Y, et al. Regulation of sucrose-6-phosphate hydrolase activity in Streptococcus mutans: characterization of the scrR gene. Infect Immun. 1998;66:3736–3743.
- Zeng L, Burne RA, Silhavy TJ. NagR differentially regulates the expression of the glmS and nagAB genes required for amino sugar metabolism by Streptococcus mutans. J Bacteriol. 2015;197:3533–3544.
- Kawada-Matsuo M, Mazda Y, Oogai Y, et al. GlmS and NagB regulate amino sugar metabolism in opposing directions and affect Streptococcus mutans virulence. PloS One. 2012;7:e33382.
- Kawada-Matsuo M, Oogai Y, Komatsuzawa H. Sugar allocation to metabolic pathways is tightly regulated and affects the virulence of Streptococcus mutans. Genes (Basel). 2016;8:11.
- Lovering AL, Safadi SS, Strynadka NC. Structural perspective of peptidoglycan biosynthesis and assembly. Annu Rev Biochem. 2012;81:451–478.
- Vollmer W, Blanot D, de Pedro MA. Peptidoglycan structure and architecture. FEMS Microbiol Rev. 2008;32:149–167.
- Santiso R, Tamayo M, Gosalvez J, et al. A rapid in situ procedure for determination of bacterial susceptibility or resistance to antibiotics that inhibit peptidoglycan biosynthesis. BMC Microbiol. 2011;11:191.
- Walsh C. Molecular mechanisms that confer antibacterial drug resistance. Nature. 2000;406:775–781.
Appendix
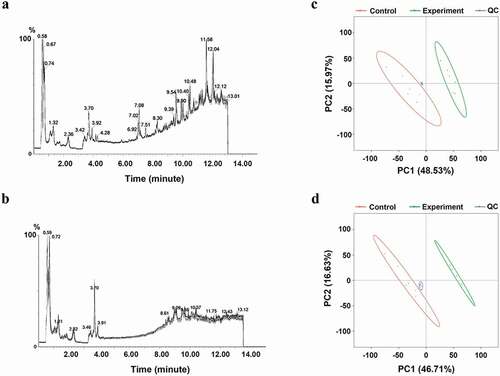
Figure A1. Total ion chromatograms and PCA plots for QC samples. (a-b) Total ion chromatograms for QC samples pooled from experimental (n = 6) and control (n = 6) samples exhibited overlap; (c-d) PCA plots for QC, treatment, and control samples, with QC samples being clustered and separated from other samples.
Table 1. Primers used in real-time RT-PCR assay.