
ABSTRACT
Background
Oral lichen planus (OLP) is a common oral mucosal disease, clinically categorized into erosive OLP (EOLP) and non-erosive OLP (NEOLP) based on symptoms, but its pathogenic mechanism remains unclear. This study aims to explore the relationship between OLP and the oral microbiome.
Methods
We collected oral mucosal samples from 49 patients and 10 healthy individuals and conducted 16S rRNA and ITS gene sequencing to explore the oral fungal and bacterial communities.
Results
We observed significantly lower α diversity of fungi in the EOLP group, with Candida being significantly enriched as the main dominant genus. In the NEOLP group, Aspergillaceae were significantly enriched. The EOLP group showed significant enrichment of Aggregatibacter and Lactobacillus, but the relative abundance of Streptococcus was notably lower than in the other two groups. In the NEOLP group, two species including Prevotella intermedia were significantly enriched. The microbial co-occurrence and co-exclusion networks display distinct characteristics across the three groups, with Lactobacillus assuming a significant bridging role in the ELOP group.
Conclusions
Our study indicates that EOLP and NEOLP experience varying degrees of dysbiosis at both the fungal and bacterial levels. Therefore, the pathogenic mechanisms and interactive relationships of these microbiota associated with OLP merit further in-depth investigation.
Key messages
The microbial community in the oral lesions of EOLP patients exhibits highly distinctive features, both in terms of bacteria and fungi.
In NEOLP patients, the overall bacterial composition does not exhibit significant differences compared to the healthy population, but P. intermedia and Aspergillaceae are notably enriched.
Introduction
Oral lichen planus (OLP) is a chronic inflammatory disease that occurs in the oral mucosa, with a global incidence rate of 0.49–1.43%, making it one of the most common oral mucosal diseases [Citation1–3]. This disease often persists chronically, with recurrent pain and is difficult to cure completely, severely affecting the patient’s quality of life. Furthermore, patients with OLP are at an elevated risk for malignant transformation, such as oral squamous cell carcinoma (OSCC) [Citation4]. Classically, OLP can be divided into two subtypes based on symptoms: erosive OLP (EOLP) and non-erosive OLP (NEOLP) [Citation3,Citation5]. NEOLP is clinically characterized by the presence of white streaks known as Wickham’s striae, white plaques, and erythematous lesions. On the other hand, EOLP typically presents with multiple painful erosions and ulcerations that lack well-defined borders and have a necrotic base [Citation3,Citation5]. Notably, NEOLP is often asymptomatic and typically responds well to topical therapies involving corticosteroids or calcineurin inhibitors. By contrast, the therapy of EOLP is extremely tricky. Topical treatments are generally ineffective, and systemic therapies are usually required [Citation6].
The pathogenesis of OLP is still unclear. Presently, it is hypothesized that T cells play a role in the pathogenesis of OLP. It is speculated that OLP may be caused by unknown exogenous antigens, autoantigens, or superantigens inducing inflammatory reactions in oral epithelial cells, leading to apoptosis of basal epithelial keratinocytes and chronic inflammation [Citation7,Citation8]. However, the exact pathogenesis and mechanism of OLP still need to be elucidated.
Although the pathogenesis of OLP is complex, research has shown that improving oral hygiene and controlling dental plaque can ameliorate the lesions of OLP [Citation9]. Treatment with chlorhexidine and antibiotics can lead to lesion regression and greatly alleviate symptoms [Citation9–11]. This suggests that the oral microbiota plays an important role in the pathogenesis or exacerbation of OLP. Recent studies have indicated that dysbiosis of the oral microbiota may be closely related to OLP [Citation12–14]. The mucosal microbiota composition and saliva microbiota of OLP patients appear to be altered, and there are differences between the affected and unaffected sites of the same patient [Citation12–14]. Moreover, it has been reported that certain species of bacteria can invade the lamina propria, epithelial cells or T cells by destroying the epithelial barrier, leading to the production of specific T cell chemokines [Citation15].
With the continuous deepening of microbiome research, increasing evidence suggests that the disruption of the composition of the oral microbiota, which are in close contact with the human body, may be an important factor in promoting local immune imbalance [Citation16]. Presently, research has revealed that the oral microbial community might be implicated in the pathogenic mechanisms of oral mucosal disease [Citation17,Citation18]. A balanced microbial consortium plays an absolutely pivotal role within the host immune system, whereas microbial dysbiosis emerges as a driving factor behind immune-related disorders. For instance, disruptions in the intricate symbiotic microbial community within the gastrointestinal tract and oral cavity orchestrate adjustments in both innate and adaptive immune responses, leading to immune-mediated maladies such as inflammatory bowel diseases and periodontitis [Citation19,Citation20]. The augmentation in the quantity or activity of pathogenic microbial consortia has been empirically demonstrated to induce immune system dysregulation or trigger inflammation [Citation19,Citation20].
With the development of amplicon sequencing technologies, there have been preliminary studies on the association between OLP and oral microbial communities [Citation12,Citation21,Citation22]. However, the final conclusions have shown significant variations. In an effort to address these issues, we employed swabs to collect microbial communities from the mucosa at the site of lesions (to minimize interference from unrelated oral microbial communities, as compared to saliva). Furthermore, we subdivided a larger sample of OLP patients into two phenotypes, and conducted simultaneous analyses of both bacterial and fungal components within the microbial community based on amplicon sequencing. Through these methods, we aim to systematically and comprehensively analyze the relationship between the structure and interactions of oral mucosal microbial communities and the occurrence of EOLP and NEOLP.
Materials and methods
Study subjects and sample collection
This study recruited patients diagnosed with reticular NEOLP (n = 27) and EOLP (n = 22) according to the clinical classification and diagnostic criteria defined by the World Health Organization (). Additionally, 10 healthy controls matching in gender and age were recruited from Stomatological of Hospital Hebei Medical University. Demographic information was collected, and oral examinations were conducted. A semi-quantitative scoring system [Citation23] consistent with the location, area, and presence of OLP lesions was used to assess the clinical scores and severity of OLP. All participants included in this study had not undergone OLP treatment for at least two months and were instructed to avoid eating two hours prior to oral sampling. Individuals with other oral diseases (such as periodontal disease or dental caries) or systemic diseases were excluded. To reflect the structural differences in the overall oral microbiome, a non-invasive method was employed to gently collect samples from the lesion areas of each participant using a sterile, disposable oral swab between 8:00 AM and 11:00 AM. For the healthy control group, samples were collected from the buccal mucosa. Each collection lasted approximately 10 seconds, and the samples were placed in sterile DNA-free conical tubes. All samples were transported to the laboratory on ice within 2 hours and stored at −80°C before further processing. All procedures were conducted following approved guidelines.
Table 1. Demographics and clinical parameters of the study population. *:Pearson chi-square test. **:one-way ANOVA.
DNA extraction and PCR amplification
Total genome DNA from samples was extracted using a DNA extraction Kit (Magen, Cat. No. D6356–02). The V3-V4 regions of the 16S rRNA gene were sequenced using primers 341F-CCTAYGGRBGCASCAG and 806 R-GGGACTACNNGGTTATTAAT, as previously described [Citation24]. The ITS1 region of the ITS genes was amplified using primers ITS1-1F-F-CTTGGTCATTTAGAGGAAGTAA and ITS1-1F-R-GCTGCGTTCTTCATCGATGC, as previously described [Citation25]. The PCR reactions were conducted using 15 µL of Phusion® High-Fidelity PCR Master Mix (New England Biolabs), 2 µM each of forward and reverse primers, and approximately 10 ng of template DNA. The thermal cycling protocol included an initial denaturation step at 98°C for 1 min, followed by 30 cycles of denaturation at 98°C for 10 s, annealing at 50°C for 30 s, and elongation at 72°C for 30 s. A final extension step was performed at 72°C for 5 min. For gel electrophoresis detection, an equal volume of 1XTAE buffer was mixed with the PCR products. Subsequently, electrophoresis was conducted on a 2% agarose gel. The equidensity mixture of PCR products was then purified using the Qiagen Gel Extraction Kit (Qiagen, Germany).
Illumina NovaSeq sequencing
Sequencing libraries were prepared using the TruSeq® DNA PCR-Free Sample Preparation Kit (Illumina, USA) according to the manufacturer’s instructions, and index codes were incorporated. The quality of the library was evaluated using the Qubit@ 2.0 Fluorometer (Thermo Scientific). Finally, the library underwent sequencing on an Illumina NovaSeq platform, producing 250 bp paired-end reads.
Sequencing data analysis and visualization
Raw data FASTQ files were imported into the format which could be operated by QIIME2 system [Citation26] using qiime tools import program. Demultiplexed sequences from each sample were quality filtered and trimmed, de-noised, merged, and then the chimeric sequences were identified and removed using the QIIME2 dada2 plugin to obtain the feature table of amplicon sequence variant (ASV) [Citation27]. The QIIME2 feature-classifier plugin was then used to align ASV sequences to the Silva (V138) database for 16S rRNA and UNITE (V8.2) for ITS gene to generate the taxonomy table [Citation28]. Diversity metrics were calculated using the core-diversity plugin within QIIME2. Differential analysis of ASVs and microbiota at various taxonomic levels, as well as the Constrained Principal Coordinate Analysis (CPCoA), were conducted using EasyAmplicon (V1.20) [Citation29]. The ternary plot generated with the R package ggtern (V3.4.2). Linear discriminant analysis effect size (LEfSe) (http://huttenhower.sph.harvard.edu/galaxy.) was utilized for comparison of microbiome composition. The potential functional profiles of microbial communities, specifically the KEGG Orthology (KO) functional profiles, were predicted using PICRUSt2 [Citation30]. The predicted pathway abundances were then subjected to comparative analysis between groups using R package ggstatsplot (V0.12). Random Forest model analysis was conducted using the R package randomForest (V4.7–1.1), and ROC curves were generated with the R package pROC (V1.18.5). Microbial co-occurrence network analysis was performed using the R package ggClusterNet. This analysis was based on Spearman correlation coefficients, with edges selected if |R| ≥ 0.6 and p < 0.05, and the model identification utilized the fast greedy algorithm.
Results
Microbial profile of healthy control and patients diagnosed with NELOP and EOLP
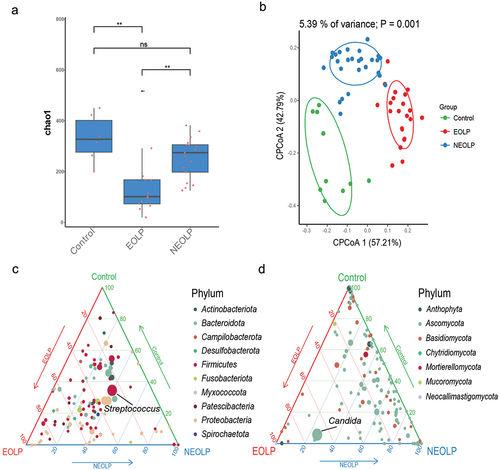
In order to investigate the distinctive oral microbiota structural characteristics among various OLP patients and the healthy control, we subjected our collected samples to amplicon sequencing. Specifically, we conducted 16S rRNA sequencing on a total of 59 samples (Control = 10, EOLP = 22, NEOLP = 27) and ITS gene sequencing on 36 samples (Control = 6, EOLP = 13, NEOLP = 17). After the filtration of the 16S rRNA sequencing data, an average of 48,199 non-chimeric tags were generated per sample, identifying a total of 16,483 ASVs. The α diversity, as indicated by the Chao1 index, exhibited a significant elevation in the EOLP group compared to NEOLP, although no marked difference was observed in comparison to the control group. Notably, the β diversity, as illustrated in CPCoA based on Bray-Curtis distances (), revealed a significant dissimilarity in microbial compositions among the three groups (p = 0.001). Ternary plot was constructed at the genus level to illustrate the distinctions in dominant species among the three groups and to depict the proportions of various species. Streptococcus, belonging to the Firmicutes, displayed the highest average relative abundance, with the NEOLP group exhibiting a slightly higher proportion than the other two groups (). Following the filtration of ITS gene sequencing data, an average of 55,101 non-chimeric tags were obtained per sample, which identified a total of 5,213 ASVs. In contrast to the 16S rRNA data, β diversity among the three groups exhibited no significant differences. The α diversity, as assessed by the Chao1 index, demonstrated a notably lower value in the ELOP group compared to the other two groups (). This discrepancy primarily stemmed from the reduced fungal diversity within the ELOP group, where Candida displayed a considerably elevated relative abundance (58.4%), thus becoming the dominant taxon ().
Figure 1. Diversity and composition of bacterial and fungal microbiota. (a) Box plot depicting the α diversity of fungi based on ITS gene data. **indicates pvalue < 0.01. (b) CPCoA analysis of bacteria based on 16S rRNA data and Bray-Curtis distance. (c, d) Ternary plots illustrating the distribution of bacterial and fungal genera at the genus level, where each circle represents a genus, circle size corresponds to the relative abundance of the respective genus, and colors represent phyla as indicated in the legend, with coordinates indicating the percentage of genera in the corresponding group.
Differential analysis and enrichment analysis of bacterial communities
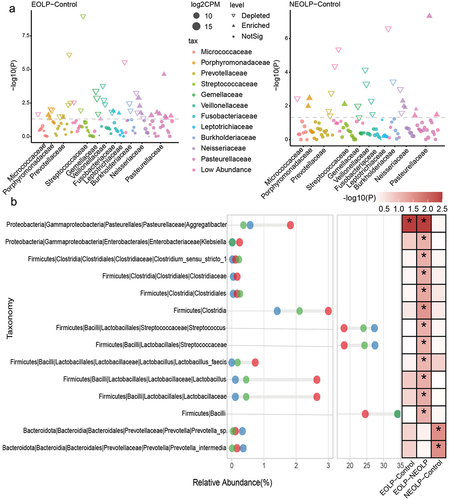
As depicted in , differential analysis of the ASVs identified through 16S rRNA sequencing, based on the edgeR software, revealed that in comparison to the Control group, the ELOP group exhibited significant enrichment of multiple ASVs belonging to Pasteurellaceae. Conversely, the NELOP group demonstrated significant enrichment of Streptococcaceae, Porphyromonadaceae, and Neisseriaceae.Subsequently, we calculated relative abundances at various taxonomic levels, ranging from phylum to species. A Wilcoxon test was conducted for differential analysis. The results, as illustrated in , showcased that EOLP group displayed notably higher relative abundances in Aggregatibacter, Clostridia and Lactobacillus compared to the other groups. It’s important to note that while the p-values for Lactobacillus in the EOLP versus Control comparison were greater than 0.05, they exhibited an LDA score greater than 2 in LEfSe analysis (Supplementary table S1). In the case of NEOLP group, two species belonged to Prevotella were notably enriched, and the relative abundances of Streptococcaceae and Streptococcus were significantly higher than those in the EOLP group and slightly higher than the Control group. The Control group also showed significant enrichment of multiple species.
Figure 2. Differential analysis of bacterial taxonomic levels and ASVs. (a) Differential analysis of ASVs. The horizontal axis represents the phylum corresponding to the ASVs, and the vertical axis represents -log10(P), where results from edgeR analysis with p < 0.05 and fdr < 0.1 are considered significantly different. (b) Differential analysis of bacterial taxonomic levels from phylum to species. Red, blue, and green circles represent EOLP, NEOLP, and Control groups, respectively, with the horizontal axis indicating relative abundance. The heatmap on the right shows differential analysis between pairs, where colors correspond to -log10(P), and *indicates significance with Wilcoxon test p < 0.05 and fdr < 0.1.
Differential analysis and enrichment analysis of fungal communities
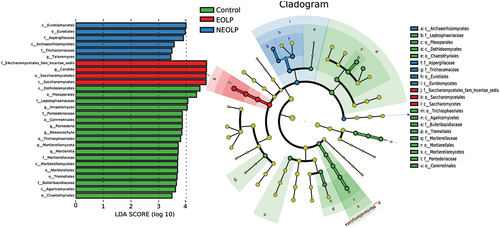
According to the LEfSe analysis results based on relative abundances from the phylum to the genus of fungi, EOLP group exhibited significant enrichment in Candida and Saccharomycetes (). When considering the preceding microbial distribution data (), it becomes evident that, in comparison to the other two groups, EOLP group featured a reduced diversity of fungal species, with Candida emerging as the predominant fungal genus. On the other hand, NEOLP group was primarily characterized by significant enrichment in Aspergillaceae and Talaromyces. In contrast, the Control group exhibited numerous significantly enriched genera, highlighting its higher diversity. These results underscore the highly significant distinctions in fungal composition between different OLP phenotypes and the Control group.
Figure 3. Differential analysis at various taxonomic levels for fungi based on LEfSe. The horizontal axis on the bar chart on the left represents the significance of differences, measured by the Linear Discriminant Analysis (LDA) score. Biomarkers with an LDA score exceeding 2 are considered statistically significant. The right graph represents the evolutionary branch. Colored nodes from the center to the periphery represent marked phylum(p), class(c), order(o), family(f), and genus(g) differences detected among EOLP (red), NEOLP (blue) and Control (green) groups. Only phylum to family levels were labeled and annotated on the right side of the cladogram.
KEGG function prediction analysis
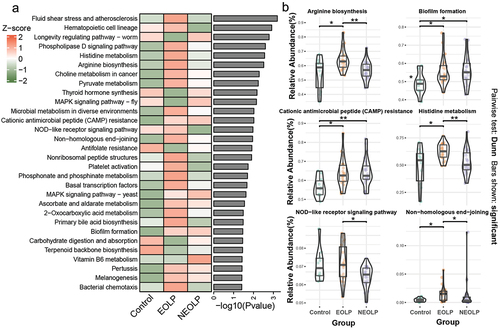
We employed the PICRUSt2 software to predict the functional potential of the bacterial communities. Subsequently, we employed the Kruskal-Wallis test to assess the significance of differences among the three groups, and visualized the top 30 significantly different pathways using a heatmap (). The results indicated that EOLP and NEOLP group, in comparison to the Control group, exhibited varying degrees of distinction in microbial metabolism, resistance, biofilm formation, biosynthesis, and degradation, among others. For instance, concerning the relative abundances in pathways such as ‘Biofilm formation’ and ‘Cationic antimicrobial peptide (CAMP) resistance’ both EOLP and NEOLP group exhibited significantly higher values than the Control group (p.adjusted <0.05). Additionally, within the ‘NOD-like receptor signaling pathway’, EOLP group showed a significantly higher relative abundance than NEOLP, although no notable difference was observed between ELOP and the Control group ().
Figure 4. KEGG functional prediction and differential analysis. (a) The heatmap illustrating the top 30 significantly different pathways sorted by p-values from the Kruskal-Wallis test, with relative abundances normalized using z-score. (b) Boxplots and violin plots of pathways. The y-axis represents relative abundance, and the graph only annotates the differential comparison groups with p.Adjust <0.05.
Random forest analysis
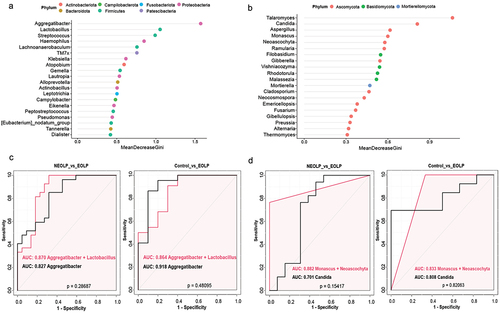
The random forest, a machine learning method, was employed to further identify key species that can distinguish between NEOLP, EOLP, and the Control group. Utilizing the R package randomForest, we conducted an analysis on the relative abundances at the genus level and generated dot plots for the top 20 genera based on MeanDecreaseGini ()). Generally, a higher MeanDecreaseGini value for a feature indicates a greater contribution to the overall performance of the random forest. The results indicated that, among bacteria, Aggregatibacter exhibited the highest value, followed by Lactobacillus and Streptococcus. Subsequently, we conducted ROC curve analysis for top 5 genera and pairwise combinations to assess their discriminative ability for different phenotypes, as detailed in the Supplementary table S2 and . When comparing EOLP with the Control group, Aggregatibacter achieved an AUC value of 0.918, indicating excellent discrimination between the two groups. Comparatively, it also performed well against the NEOLP group, with the best performance observed when combining the relative abundance of Aggregatibacter and Lactobacillus (AUC = 0.870). No bacterial genus could effectively distinguish NEOLP from the Control group, with Haemophilus showing the best performance (AUC = 0.689). In the case of fungi, the random forest model indicated that Talaromyces demonstrated the highest MeanDecreaseGini value, followed by Candida (). We also performed ROC curve analysis using the same approach, as illustrated in . In the comparison between EOLP and NEOLP, the combined relative abundance of Monascus and Neoascochyta exhibited the highest AUC (0.882). Similarly, in the comparison between EOLP and the control group, this combination also showed a high AUC (0.833).
Figure 5. Random Forest and ROC curve analysis. (a, b) Top 20 genera ranked by MeanDecreaseGini based on the Random Forest model, with color mapping to phyla in the legend, a for bacteria, B for fungi. (c, d) ROC curves for bacteria and fungi, where the red curve represents a combination of two genera, and the black curve represents a single genus.
Microbial co-occurrence and co-exclusion network analysis
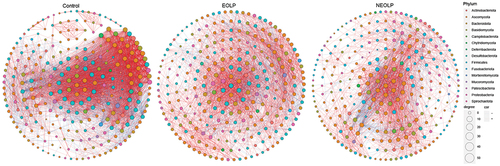
To further explore the differences in bacterial-fungal interactions between OLP patients and the healthy population, we calculated the spearman correlation coefficients based on the relative abundance of genera. Subsequently, we compared the correlations between the top 20 fungi and bacteria in terms of their average relative abundance among the three groups ( and Supplementary table S3). Overall, there were noticeably more genera exhibiting high correlations between bacteria and fungi in the Control group. Additionally, many differences could be observed in detail. In the EOLP group, Actinobacillus exhibited a strong negative correlation with Candida, while showing a strong positive correlation with Aspergillus. However, such pronounced correlations were not observed in the other two groups. In the NEOLP group, Rothia displayed a strong positive correlation with Malassezia, contrasting with the other two groups. Additionally, the correlations of Aggregatibacter with several fungal genera, such as Longiostiolum, showed significant differences among the three groups. Both Lactobacillus and Muribaculaceae exhibited strong correlations with multiple fungal genera in all three groups. Subsequently, we filtered data with |R| > 0.6 and p < 0.05 to construct co-occurrence and co-exclusion networks ( and Supplementary table S4). The results showed similar node numbers in the three networks, but the network of Control group had 4356 edges, significantly higher than those of the NEOLP and EOLP groups, which had only 1923 and 2461 edges, respectively (Figure S1). Additionally, the clustering coefficient of the Control group’s network was noticeably higher than that of the other groups. Regarding network modularity, EOLP had the highest value of 0.45, followed by NEOLP at 0.36, and Control at 0.27. In the network of EOLP, the node Lactobacillus exhibited the highest betweenness, with a relatively high degree value of 53, indicating its pivotal role in the network. Dorea and Phialemoniopsis showed the highest betweenness in the NEOLP group. In the Control group’s network, the node Candida displayed relatively high betweenness, whereas this situation was not observed in the other groups.
Figure 6. Spearman correlation analysis between abundant fungal and bacterial genera across samples. Only the top 20 genera in terms of relative abundance for both bacteria and fungi are displayed, with blue rectangle frames highlighting the pairs with significant differences among the three groups.
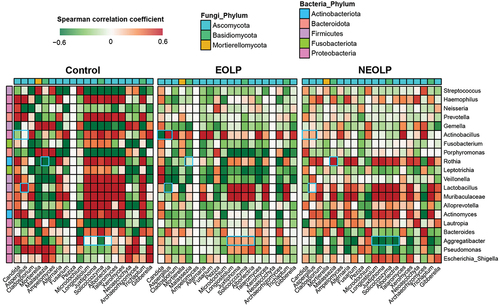
Figure 7. Bacterial and fungal co-occurrence and co-exclusion network. Based on relative abundance, spearman correlation coefficients were computed, and relationships with |R|≥0.6 and p < 0.05 were selected to construct the correlation network.
Discussion
This study reveals that the α diversity of the oral fungal community in EOLP patients is significantly lower than that in the NEOLP group and the healthy control group. Conversely, bacterial diversity shows an opposite trend. Specifically, the bacterial diversity in the EOLP group is significantly higher than that in the NEOLP group, and although it does not differ significantly from the Control group, the α diversity mean is slightly higher than that of the Control group. This trend in the variation of bacterial and fungal diversity is largely consistent with the results of the study by Li et al. [Citation31], as well as with similar trends observed in certain intestinal diseases [Citation32]. However, it is diametrically opposite to the trends in microbial diversity observed in some mucosal diseases [Citation21,Citation33]. Based on the relative abundance data at the genus level and the LEfSe results, the significant reduction in oral fungal diversity in OLP patients is primarily attributed to a substantial increase in the relative abundance of Candida, especially pronounced in the ELOP group, where Candida becomes the dominant genus. However, a research by Hong et al. [Citation34] indicates a detection rate of only 18.87% and 18.75% for Candida albicans in the oral mucosa of EOLP and NEOLP patients, respectively, suggesting that OLP may not be solely attributed to a single species of infection.We propose that the compromised epithelium in the oral cavity of OLP patients may create favorable conditions for the colonization of Candida on mucosal surfaces, thereby exacerbating the condition. Although it cannot be definitively stated whether Candida is a primary cause of OLP, the relative abundance of Candida is closely associated with the progression and phenotypes of OLP. Moreover, the relative abundance of Aspergillaceae in the NEOLP group is significantly higher than in the other two groups. The main genus, Aspergillus, is also an opportunistic fungal pathogen often associated with various infections and inflammatory diseases [Citation35,Citation36], including gingivitis [Citation37]. There is a noticeable difference in the ratio of Candida and Aspergillus combinations between EOLP and NEOLP, and this distinction may be linked to the diverse clinical manifestations of OLP. Additionally, it should be noted that the alteration in fungal diversity is closely correlated with the composition and structure of the bacterial community. Studies by Peleg et al. [Citation38] suggest that anaerobic bacteria often inhibit the growth of fungi, implying that the significant increase in specific fungi may be due to an imbalance in certain bacteria, leading to changes in the oral environment that are more conducive to the infection of pathogenic fungi such as Candida.
By comparing bacterial relative abundance across multiple taxonomic levels, EOLP manifests various distinctive features. Firstly, Aggregatibacter is significantly enriched compared to the other two groups. Aggregatibacter includes various pathogenic bacteria such as Aggregatibacter actinomycetemcomitans, which is equipped with several potent virulence factors capable of inducing cell death, inflammation, or evasion. The diverse virulence properties of this bacterium contribute to its pathogenicity, particularly in the context of early and rapidly progressive forms of periodontal disease [Citation39]. Previous research has suggested that pathogenic bacteria associated with periodontal disease may also be involved in or exacerbate the pathogenic processes of OLP. Studies by Ertugrul et al. [Citation40] found that OLP patients are more susceptible to infection by bacteria such as Aggregatibacter actinomycetemcomitans, Porphyromonas gingivalis, Prevotella intermedia, Tannerella forsythia, and Treponema denticola compared to healthy individuals. These bacteria are potentially associated with periodontal disease. Therefore, the colonization and proportion of Aggregatibacter within the microbial community may be closely associated with the occurrence of EOLP.
Furthermore, the relative abundance of Lactobacillus is significantly higher than in the other two groups. Lactobacillus is typically associated with the normal microbial community in the oral cavity. In the bacteriome-mycobiome network of the EOLP group, Lactobacillus exhibits a remarkably high betweenness and degree, indicating that Lactobacillus serves as a key or bridging node in the network, playing a crucial role in the connectivity and interactions in the microbial ecosystem of the ELOP oral mucosa. Lactobacillus may interact with other microbial communities through antibacterial activities [Citation41], induction of antifungal immunity [Citation42], and modulation of the microenvironment of the oral mucosa by its metabolic products. The significant enrichment of Candida can create an anaerobic environment favorable for Lactobacillus and Lactobacillus may produce more lactic acid as a carbon source for Candida.
Finally, the relative abundance of Streptococcus in the EOLP group was significantly lower than in the NEOLP group and slightly lower than in the control group. Previous research has indicated that the relative abundance of Streptococcus is significantly higher in healthy individuals compared to OLP patients [Citation14,Citation15,Citation31]. This suggests that the ecological niche of normal bacterial communities belonging to Streptococcus in the oral mucosa of EOLP patients may have been displaced by other bacteria with increased abundance, such as Aggregatibacter and Lactobacillus. In contrast to previous research findings, we observed a significant difference in the relative abundance of Streptococcus between EOLP and NEOLP group, which may be attributed to factors such as sample size and variations in sampling methods. Overall, the bacterial community structure in NEOLP more closely resembles that of the Control group, with a significantly lower degree of disruption compared to the EOLP group. This aligns with the clinical manifestation that NEOLP tends to present milder symptoms than EOLP. We propose that the oral mucosa of NEOLP patients may not have developed an aggregation of various pathogenic bacteria and still retains a substantial portion of microbial community associated with health.
However, in the NEOLP group, we still observed a significant enrichment of a small number of pathogenic bacteria, including Prevotella intermedia. P. intermedia is a crucial pathogen associated with periodontal disease [Citation43], playing a significant role in biofilm formation [Citation44]. It is a key factor triggering periodontitis [Citation45] and can stimulate the release of pro-inflammatory cytokines, proteases, and matrix metalloproteinases, thereby promoting the development of periodontal inflammation [Citation46]. Moreover, P. intermedia is believed to possess a virulent mechanism capable of effectively incapacitating and causing the death of neutrophils, thus protecting other pathogens and facilitating the establishment of persistent infections [Citation47]. In another study, it was found that the detection rate of P. intermedia in the oral cavity of patients with both OLP and periodontal disease was significantly higher than in those with only periodontal disease [Citation48]. Recently, P. intermedia has been found to potentially inhibit the expression of tumor suppressors, alter the tumor microenvironment, and promote the progression of OSCC [Citation49]. These studies suggest a potential correlation between P. intermedia and the pathogenic mechanisms of NEOLP. It is noteworthy that the results of predicting bacterial community functions using PICRUSt2 indicate a significantly higher abundance of functional pathways related to biofilm formation in both EOLP and NEOLP compared to the Control group. Biofilm serves as a gathering place for various microorganisms, including bacteria and fungi, providing a foundation for sustained infection and inflammatory responses. It should be noted, however, that PICRUSt2, which is based on 16S rRNA sequencing data, cannot directly identify pathways but rather predicts them through the composition of microbial communities. Therefore, its functional prediction accuracy is generally lower than that of metagenomics, which can directly measure gene-related data.
Through random forest analysis, we identified the top 3 genera in bacteria, ranked by MeanDecreaseGini, as Aggregatibacter, Lactobacillus, and Streptococcus. ROC curve analysis indicated that Aggregatibacter effectively distinguishes EOLP from the other two groups, with an AUC of 0.827 compared to NEOLP and an AUC of 0.918 compared to the control group. This is highly consistent with the results of differential analyses. Regarding fungi, the most contributive genera were Talaromyces, followed by Candida. The LEfSe analysis revealed a significant enrichment of Talaromyces in the NEOLP group, making it the top-performing biomarker in distinguishing NEOLP, with AUC values of 0.796 and 0.775 in comparisons with EOLP and the control group, respectively. Although Talaromyces marneffei may cause infections in non-immunocompromised individuals [Citation50], Talaromyces is rarely reported in oral-related diseases, suggesting that it may not be a common oral pathogen and its relationship with the pathogenic mechanism of NEOLP deserves further in-depth research.
Network analysis reveals that the Control group exhibits significantly more edges and higher clustering coefficient and average path length, indicating that microbial communities in the oral mucosa of healthy individuals form tightly-knit community structures with higher global connectivity. This is further validated by the analysis of the top 20 genera correlations, where the Control group shows a greater number of strongly correlated pairs between bacteria and fungi. In contrast, the EOLP group’s network has the lowest average path length and centralization of closeness but has a higher modularity compared to the other groups. This suggests that the microbial communities in the EOLP group tend to form smaller community modules with tightly interconnected internal relationships. On the other hand, the NEOLP group has the most nodes in the network but the fewest edges, indicating lower internal connectivity among microbial communities compared to the other two groups.
This study still has certain limitations that need to be addressed in future research. Firstly, the sample size needs to be further increased, particularly for the healthy control group, to enhance statistical power and thereby render the conclusions more robust. Secondly, all samples in this study were recruited from a single hospital, which may introduce selection bias and limit the generalizability of the findings to other populations. Including participants from multiple centers or regions could improve the external validity of the study, making the sample more representative. Lastly, 16S rRNA and ITS gene sequencing provide taxonomic information only at the genus level. Supplementing with higher resolution metagenomic sequencing techniques could validate the study results and allow for more in-depth exploration at the species and gene levels.
Conclusion
The microbial community in the oral lesions of EOLP patients exhibits highly distinctive features, both in terms of bacteria and fungi. Random forest and ROC curve analyses indicate that Aggregatibacter is a promising biomarker for distinguishing EOLP from the other two groups. In NEOLP patients, the overall bacterial composition does not exhibit significant differences compared to the healthy population. However, some bacteria, such as P. intermedia, are significantly enriched. Moreover, distinct features are observed in fungi, where the relative abundance of Candida falls between the ELOP and Control groups, while Aspergillaceae is notably enriched. The microbial co-occurrence and co-exclusion networks display distinct patterns across the three groups, with Lactobacillus assuming a pivotal role in the ELOP group. These findings suggest that the differing microbial structures in EOLP and NEOLP may be closely linked to clinical phenotypes and pathogenic mechanisms. Further in-depth research is warranted to explore the enriched bacteria and fungi, as well as their interactions within the entire microbial community.
Ethical approval
This study was approved by the Medical Ethics Committee of Hospital of Stomatology, Hebei Medical University (NO. [2021] 090). Informed written consent was obtained from all participants after an explanation of the nature of the study, as approved by the Medical Ethics Committee of Hospital of Stomatology, Hebei Medical University.
Supplementary table S3.pdf
Download PDF (77 KB)Supplementary table S4.pdf
Download PDF (832.7 KB)Supplementary table S2.pdf
Download PDF (50.1 KB)Supplementary table S1.pdf
Download PDF (130.3 KB)Disclosure statement
No potential conflict of interest was reported by the author(s).
Data availability statement
All the ITS gene and 16S rRNA sequencing data were deposited at NCBI under accession number SRP473179.
Supplementary material
Supplemental data for this article can be accessed online at https://doi.org/10.1080/20002297.2024.2374639.
Additional information
Funding
References
- Gonzalez-Moles MA, Warnakulasuriya S, Gonzalez-Ruiz I, et al. Worldwide prevalence of oral lichen planus: A systematic review and meta-analysis. Oral Dis. 2021;27(4):813–13. doi: 10.1111/odi.13323
- Li C, Tang X, Zheng X, et al. Global prevalence and incidence estimates of oral lichen planus: a systematic review and meta-analysis. JAMA Dermatol. 2020;156(2):172–181. doi: 10.1001/jamadermatol.2019.3797
- Ujiie H, Rosmarin D, Schon MP, et al. Unmet medical needs in chronic, non-communicable inflammatory skin diseases. Front Med. 2022;9:875492. doi: 10.3389/fmed.2022.875492
- Gonzalez-Moles MA, Ruiz-Avila I, Gonzalez-Ruiz L, et al. Malignant transformation risk of oral lichen planus: A systematic review and comprehensive meta-analysis. Oral Oncol. 2019;96:121–130. doi: 10.1016/j.oraloncology.2019.07.012
- Solimani F, Forchhammer S, Schloegl A, et al. Lichen planus - A clinical guide. J Dtsch Dermatol Ges. 2021;19(6):864–882. doi: 10.1111/ddg.14565
- Solimani F, Pollmann R, Schmidt T, et al. Therapeutic Targeting of Th17/Tc17 cells leads to clinical improvement of lichen planus. Front Immunol. 2019;10:1808. doi: 10.3389/fimmu.2019.01808
- El-Howati A, Thornhill MH, Colley HE, et al. Immune mechanisms in oral lichen planus. Oral Dis. 2023;29(4):1400–1415. doi: 10.1111/odi.14142.
- Carrozzo M, Porter S, Mercadante V, et al. Oral lichen planus: A disease or a spectrum of tissue reactions? Types, causes, diagnostic algorhythms, prognosis, management strategies. Periodontol 2000. 2019;80(1):105–125. doi: 10.1111/prd.12260
- Salgado DS, Jeremias F, Capela MV, et al. Plaque control improves the painful symptoms of oral lichen planus gingival lesions. A short-term study. J Oral Pathol Med. 2013;42(10):728–732. doi: 10.1111/jop.12093
- Backman K, Jontell M. Microbial-associated oral lichenoid reactions. Oral Dis. 2007;13(4):402–406. doi: 10.1111/j.1601-0825.2006.01312.x
- Carbone M, Conrotto D, Carrozzo M, et al. Topical corticosteroids in association with miconazole and chlorhexidine in the long-term management of atrophic-erosive oral lichen planus: a placebo-controlled and comparative study between clobetasol and fluocinonide. Oral Dis. 1999;5(1):44–49. doi: 10.1111/j.1601-0825.1999.tb00063.x
- Deng S, Xu Y, Wang X, et al. Study on the role of salivary flora and nf-kappab inflammatory signal pathway in oral lichen planus. Inflammation. 2020;43(3):994–1008. doi: 10.1007/s10753-020-01185-1
- Du GH, Wang YF, Chen JJ, et al. Potential association between Fusobacterium nucleatum enrichment on oral mucosal surface and oral lichen planus. Oral Dis. 2020;26(1):122–130. doi: 10.1111/odi.13232
- He Y, Gong D, Shi C, et al. Dysbiosis of oral buccal mucosa microbiota in patients with oral lichen planus. Oral Dis. 2017;23(5):674–682. doi: 10.1111/odi.12657
- Choi YS, Kim Y, Yoon HJ, et al. The presence of bacteria within tissue provides insights into the pathogenesis of oral lichen planus. Sci Rep. 2016;6(1):29186. doi: 10.1038/srep29186
- Honda K, Littman DR. The microbiota in adaptive immune homeostasis and disease. Nature. 2016;535(7610):75–84. doi: 10.1038/nature18848
- Hijazi K, Morrison RW, Mukhopadhya I, et al. Oral bacterial diversity is inversely correlated with mucosal inflammation. Oral Dis. 2020;26(7):1566–1575. doi: 10.1111/odi.13420
- Lee YH, Chung SW, Auh QS, et al. Progress in oral microbiome related to oral and systemic diseases: an update. Diagnostics (Basel). 2021;11(7):1283. doi: 10.3390/diagnostics11071283
- Galimanas V, Hall MW, Singh N, et al. Bacterial community composition of chronic periodontitis and novel oral sampling sites for detecting disease indicators. Microbiome. 2014;2(1):32. doi: 10.1186/2049-2618-2-32
- Sartor RB, Wu GD. Roles for intestinal bacteria, viruses, and fungi in pathogenesis of inflammatory bowel diseases and therapeutic approaches. Gastroenterology. 2017;152(2):327–39 e4. doi: 10.1053/j.gastro.2016.10.012
- Lynde CW, Andriessen A, Bertucci V, et al. The skin microbiome in atopic dermatitis and its relationship to emollients. J Cutan Med Surg. 2016;20(1):21–28. doi: 10.1177/1203475415605498
- Chen J, Liu K, Sun X, et al. Microbiome landscape of lesions and adjacent normal mucosal areas in oral lichen planus patient. Front Microbiol. 2022;13:992065. doi: 10.3389/fmicb.2022.992065
- Piboonniyom SO, Treister N, Pitiphat W, et al. Scoring system for monitoring oral lichenoid lesions: a preliminary study. Oral Surg, Oral Med Oral Pathol Oral Radiol Endod. 2005;99(6):696–703. doi: 10.1016/j.tripleo.2004.07.013
- Caporaso JG, Lauber CL, Walters WA, et al. Global patterns of 16S rRNA diversity at a depth of millions of sequences per sample. Proc Natl Acad Sci USA. 2011;108 (Suppl 1):4516–4522. doi: 10.1073/pnas.1000080107
- Ghannoum MA, Jurevic RJ, Mukherjee PK, et al. Characterization of the oral fungal microbiome (mycobiome) in healthy individuals. PLOS Pathog. 2010;6(1):e1000713. doi: 10.1371/journal.ppat.1000713
- Bolyen E, Rideout JR, Dillon MR, et al. Reproducible, interactive, scalable and extensible microbiome data science using QIIME 2. Nat Biotechnol. 2019;37(8):852–857. doi: 10.1038/s41587-019-0209-9
- Callahan BJ, McMurdie PJ, Rosen MJ, et al. DADA2: High-resolution sample inference from Illumina amplicon data. Nat Methods. 2016;13(7):581–583. doi: 10.1038/nmeth.3869
- Bokulich NA, Kaehler BD, Rideout JR, et al. Optimizing taxonomic classification of marker-gene amplicon sequences with QIIME 2’s q2-feature-classifier plugin. Microbiome. 2018;6(1):90. doi: 10.1186/s40168-018-0470-z
- Liu YX, Qin Y, Chen T, et al. A practical guide to amplicon and metagenomic analysis of microbiome data. Protein Cell. 2021;12(5):315–330. doi: 10.1007/s13238-020-00724-8
- Douglas GM, Maffei VJ, Zaneveld JR, et al. PICRUSt2 for prediction of metagenome functions. Nat Biotechnol. 2020;38(6):685–688. doi: 10.1038/s41587-020-0548-6
- Li Y, Wang K, Zhang B, et al. Salivary mycobiome dysbiosis and its potential impact on bacteriome shifts and host immunity in oral lichen planus. Int J Oral Sci. 2019;11(2):13. doi: 10.1038/s41368-019-0045-2
- Hoarau G, Mukherjee PK, Gower-Rousseau C, et al. Bacteriome and mycobiome interactions underscore microbial dysbiosis in familial Crohn’s disease. mBio. 2016;7(5). doi: 10.1128/mBio.01250-16
- Alekseyenko AV, Perez-Perez GI, De Souza A, et al. Community differentiation of the cutaneous microbiota in psoriasis. Microbiome. 2013;1(1):31. doi: 10.1186/2049-2618-1-31
- He H, Xia X, Yang H, et al. A pilot study: a possible implication of Candida as an etiologically endogenous pathogen for oral lichen planus. BMC Oral Health. 2020;20(1):72. doi: 10.1186/s12903-020-1042-8
- Vennewald I, Klemm E. Otomycosis: Diagnosis and treatment. Clin Dermatol. 2010;28(2):202–211. doi: 10.1016/j.clindermatol.2009.12.003
- Gomes CC, Pinto LC, Victor FL, et al. Aspergillus in endodontic infection near the maxillary sinus. Braz J Otorhinolaryngol. 2015;81(5):527–532. doi: 10.1016/j.bjorl.2015.07.013
- Peters BA, Wu J, Hayes RB, et al. The oral fungal mycobiome: characteristics and relation to periodontitis in a pilot study. BMC Microbiol. 2017;17(1):157. doi: 10.1186/s12866-017-1064-9
- Peleg AY, Hogan DA, Mylonakis E. Medically important bacterial-fungal interactions. Nat Rev Microbiol. 2010;8(5):340–349. doi: 10.1038/nrmicro2313
- Belibasakis GN, Maula T, Bao K, et al. Virulence and Pathogenicity Properties of Aggregatibacter actinomycetemcomitans. Pathogens. 2019;8(4):222. doi: 10.3390/pathogens8040222
- Chen J, Feng J, Chen X, et al. Immunoexpression of interleukin-22 and interleukin-23 in oral and cutaneous lichen planus lesions: a preliminary study. Mediators Inflamm. 2013;2013:801974. doi: 10.1155/2013/801974
- Nguyen T, Brody H, Radaic A, et al. Probiotics for periodontal health-Current molecular findings. Periodontol 2000. 2021;87(1):254–267. doi: 10.1111/prd.12382
- Bozena DK, Iwona D, Ilona K. The mycobiome - a friendly cross-talk between fungal colonizers and their host. Ann Parasitol. 2016;62(3):175–184. doi: 10.17420/ap6203.51
- Socransky SS, Haffajee AD, Cugini MA, et al. Microbial complexes in subgingival plaque. J Clin Periodontol. 1998;25(2):134–144. doi: 10.1111/j.1600-051X.1998.tb02419.x
- Deng ZL, Szafranski SP, Jarek M, et al. Dysbiosis in chronic periodontitis: key microbial players and interactions with the human host. Sci Rep. 2017;7(1):3703. doi: 10.1038/s41598-017-03804-8
- Socransky SS, Haffajee AD. Evidence of bacterial etiology: a historical perspective. Periodontol 2000. 1994;5(1):7–25. doi: 10.1111/j.1600-0757.1994.tb00016.x
- Guan SM, Shu L, Fu SM, et al. Prevotella intermedia upregulates MMP-1 and MMP-8 expression in human periodontal ligament cells. FEMS Microbiol Lett. 2009;299(2):214–222. doi: 10.1111/j.1574-6968.2009.01748.x
- Matsui A, Jin JO, Johnston CD, et al. Pathogenic bacterial species associated with endodontic infection evade innate immune control by disabling neutrophils. Infect Immun. 2014;82(10):4068–4079. doi: 10.1128/IAI.02256-14
- Ertugrul AS, Arslan U, Dursun R, et al. Periodontopathogen profile of healthy and oral lichen planus patients with gingivitis or periodontitis. Int J Oral Sci. 2013;5(2):92–97. doi: 10.1038/ijos.2013.30
- Zhou Y, Qin Y, Ma J, et al. Heat-killed prevotella intermedia promotes the progression of oral squamous cell carcinoma by inhibiting the expression of tumor suppressors and affecting the tumor microenvironment. Exp Hematol Oncol. 2024;13(1):33. doi: 10.1186/s40164-024-00500-y
- Chan JF, Lau SK, Yuen KY, et al. Talaromyces (penicillium) marneffei infection in non-HIV-infected patients. Emerg Microbes Infect. 2016;5(3):e19. doi: 10.1038/emi.2016.18