
ABSTRACT
Background
Oral microbes mediate the production of nitric oxide (NO) through the denitrification pathway. This study aimed to investigate the association between oral microbial nitrate metabolism and prognosis in acute ischemic stroke (AIS) patients.
Methods
This prospective, observational, single-center cohort study included 124 AIS patients admitted within 24 hours of symptom onset, with 24-hour ambulatory blood pressure data. Oral swabs were collected within 24 hours. Hypertensive AIS patients were stratified by the coefficient of variation (CV) of 24-hour systolic blood pressure. Microbial composition was analyzed using LEfSe and PICRUSt2 for bacterial and functional pathway identification.
Results
Significant differences in oral microbiota composition were observed between hypertensive AIS patients with varying CVs. Lower CV groups showed enrichment of nitrate-reducing bacteria and “Denitrification, nitrate => nitrogen” pathways. The TAX score of oral nitrate-reducing bacteria, derived from LASSO modeling, independently correlated with 90-day modified Rankin Scale scores, serving as an independent risk factor for poor prognosis. Mediation analyses suggested indirect that the TAX score not only directly influences outcomes but also indirectly affects them by modulating 24-hour systolic blood pressure CV.
Conclusions
AIS patients with comorbid hypertension and higher systolic blood pressure CV exhibited reduced oral nitrate-reducing bacteria, potentially worsening outcomes.
Introduction
Nitrate, a compound essential for various physiological functions, is present in the human body in multiple forms, including the oxidation of nitric oxide (NO) and ingested food and drinks [Citation1]. Nitrate is transported to the oral cavity via circulation and becomes enriched in this environment, where oral microbiota play a crucial role in converting nitrate to nitrite [Citation2–4]. Once nitrite is formed, it can be absorbed into the bloodstream and further converted to NO, a molecule with significant vasodilatory and anti-inflammatory properties [Citation3]. NO plays a vital role in maintaining vascular homeostasis by regulating blood vessel dilation and reducing inflammation, thereby contributing to the stabilization of blood pressure variability in humans [Citation5,Citation6]. Previous research has uncovered associations between NO signaling and cardiovascular diseases such as coronary heart disease and stroke [Citation7,Citation8]. These studies indirectly underscore the importance of NO in vascular maintenance and its potential implications for the treatment of cardiovascular diseases [Citation9,Citation10].
A possible mechanism linking oral microbiota to health is the nitrate (NO3-)-nitrite (NO2-)- NO pathway, which relies on oral bacteria to reduce NO3- to NO [Citation11]. Recent advancements in microbiological research have emphasized the pivotal role of oral microbiota in cardiocerebral vascular diseases, particularly concerning nitrate metabolism and the production of NO [Citation1,Citation12,Citation13]. Scientists are actively exploring methods to regulate NO levels by manipulating oral microbes to enhance nitrite production, thereby influencing NO concentration [Citation11,Citation14]. One notable discovery is the effect of antimicrobial mouthwash on the ability of the oral microbiota to metabolize nitrate, subsequently impacting blood pressure regulation, especially in individuals with hypertension. Studies have indicated that the use of antimicrobial mouthwash disrupts the natural equilibrium of the oral microbiota involved in nitrate reduction, leading to an increase in systolic blood pressure [Citation15]. Conversely, investigations into nitrate supplementation have revealed alterations in the composition of oral microbiota, resulting in lower blood pressure levels compared to the control groups [Citation11]. These findings underscore the potential therapeutic implications of targeting oral microbial communities to modulate nitrate metabolism, and consequently, blood pressure regulation.
Managing blood pressure after the onset of acute ischemic stroke (AIS) is crucial for improving patient prognosis. Recent research underscores the importance of addressing blood pressure variability in addition to controlling blood pressure levels. Studies have demonstrated that fluctuations in blood pressure after stroke onset significantly affect patient outcomes [Citation16–18].
Although commensal oral bacteria are recognized for their crucial role in converting dietary nitrate to nitrite [Citation19], there remains a significant gap in understanding their potential involvement in blood pressure regulation and their impact on outcomes in AIS patients. Research in this area is relatively scarce, and further investigations are warranted to elucidate the intricate mechanisms underlying the relationship between oral microbiota, blood pressure regulation, and clinical outcomes in patients with AIS. By comprehensively exploring these connections, researchers can potentially uncover novel therapeutic targets and strategies aimed at improving the prognosis and management of AIS, particularly those with underlying hypertension.
Methods
Ethics statement and participants
This study appears to be a prospective, observational, single-center study conducted at Guangzhou Southern Hospital. This study aimed to include AIS patients admitted between June 2020 and October 2021 who were then screened to establish an observational cohort based on specific inclusion and exclusion criteria. The inclusion criteria for the study were as follows: (1) age >18 years. (2) Admission within 24 hours of ischemic stroke onset. The exclusion criteria were as follows: (1) use of antibiotics, prebiotics, or probiotics within three months before admission. (2) Admission occurring more than 24 h after stroke onset. (3) Active infection within 2 weeks prior to admission. (4) History of oral and respiratory cancers or advanced cancers. (5) Failure to provide oral swab samples during hospitalization. (6) Use of immunosuppressants or history of systemic diseases such as cirrhosis, renal failure, and hematologic conditions. Oral swab specimens were collected from patients within 24 h of admission, and 24-hour ambulatory blood pressure was recorded. The study was approved by the Ethics Committee of Nanfang Hospital, Southern Medical University (NFEC-2020-169), and registered at http://clinicaltrials.gov (NCT04688138). Informed consent was obtained from all the patients or their legal representatives.
Oral sample collection
The sampling procedure involved noninvasive collection of samples from the oral mucosa and gingiva using sterile sampling swabs. These swabs were dipped in a small amount of sterile saline and used to scrape the left and right sides of the oral mucosa and gingiva three times each. After sampling, the swabs were gently removed and placed in sampling tubes, which were then capped. Three swabs were collected per patient. The collected specimens were immediately transferred to the laboratory. In the lab, the heads of the swabs were transferred to 2 ml sterile EP tubes in a fume hood, and the tails were discarded. The swabs were then placed in a − 80°C refrigerator for freezing and storage until further analysis. This method ensured the collection of oral microbiota samples in a sterile manner, preserving their integrity for subsequent analysis without causing discomfort or risk to patients.
16S rRNA sequencing and analysis
DNA was extracted from the oral swab samples using the Mabio® Bacterial DNA Extraction Mini Kit. The concentration and purity of the extracted DNA were measured using a NanoDrop One spectrophotometer (Thermo Fisher Scientific, MA, USA). To amplify different regions of the 16S rRNA gene (specifically V3-V4 regions), specific primers (338F and 806 R) with a 12bp barcode were utilized, and the NEBNext® Ultra™ II DNA Library Prep Kit for Illumina® (New England Biolabs, MA, USA) was used to generate sequencing libraries, with index codes added to facilitate sample identification. The quality of the library was assessed using a Qubit® 2.0 Fluorometer (Thermo Fisher Scientific, MA, USA). Subsequently, the library was sequenced on the Illumina Nova6000 platform, generating paired-end reads of 250bp each, a process performed by Guangdong Magigene Biotechnology Co., Ltd. in Guangzhou, China. Chimeric sequences were removed, and sequencing noise was detected using the DADA2 method. Sequences were then grouped into amplicon sequence variants (ASVs) with a 99% similarity threshold. Taxonomic classification of the sequences was accomplished using the q2-feature-classifier plugin, which utilized the vsearch alignment method and SILVA v132 database. For additional details on the 16S rRNA sequencing analysis, please refer to the supplementary material provided for the study.
Alpha diversity analyses were conducted, which included metrics such as Shannon index, Chao1 index, Simpson index, and observed species. The analyses were performed using an annotated ASV abundance table. To compare differences between groups, Mann-Whitney U tests were performed using statistical software R.
Additionally, beta diversity was calculated and graphically presented based on the ASV abundance table using the “vegan” package in R (version 2.6.4) for Principal Coordinates Analysis (PCoA). This allowed for the visualization of dissimilarities in microbial composition between different groups or conditions within the study cohort.
Linear discriminant analysis effect size (LEfSe) was conducted using the QIIME2 platform based on homogenized ASV abundance tables for each species class. A screening value of 3 was set for the LDA Score, meaning that only species with an LDA Score greater than 3 were considered significant and were further analyzed.
Prediction of functional pathway using PICRUSt2
The ASV abundance table was standardized using PICRUSt2 to mitigate the influence of the copy number of the 16S marker gene in the species genome. Subsequently, each ASV’s corresponding greengene ID was compared to the KEGG database, allowing for retrieval of KO, Pathway, and EC information. Functional category abundances were then calculated based on ASV abundance, yielding abundance tables for each sample at different classification levels for subsequent analyses [Citation20].
PICRUSt2 results were further enriched using the Reporter Score method to assess the enrichment status of pathways, modules, etc. Enrichment analysis of the PICRUSt2 results was conducted using the R software “ReporterScore” package (version 0.0.1.1), which is supported by the “PICRUSt2” software package (version 0.1.0).
The KO numbers corresponding to modules related to nitrate metabolism were obtained from the KEGG official website (https://www.kegg.jp/). The sum of the corresponding abundance values of all KO labels for each module of each specimen was separately calculated as the total score (n) of this module for that specimen. These scores were then converted into logs (n + 1). Multiple linear regression was used to assess the relationship between the total scores and clinical indices. The false discovery rate, computed using the Benjamini-Hochberg method, was used to interpret multiple hypothesis tests.
Statistical analyses
In this study, the LASSO (Least Absolute Shrinkage and Selection Operator) regression model was employed to select the most prognostic markers. This analysis was conducted using the R software and the “glmnet” package (version 4.1.8). The relative abundance of organisms was utilized as the original value, whereas KEGG abundance was log-transformed to log(n + 1) to meet the assumptions of the regression model.
Mediating effect refers to the influence of an independent variable (X) on a dependent variable (Y) through a mediating variable (M). The specific steps of the mediating effect analysis were as follows: (1) Total effects analysis: determination of the existence of the effect of the independent variable (X) on the dependent variable (Y). (2) Assessment of the effect of the independent variable (X) on the mediating variable (M). (3) Confirmation of the mediating variable (M) influencing the dependent variable (Y) while controlling for the independent variable (X). (4) Causal mediation analysis. This analysis was conducted using R software and the ‘mediation’ package (version 4.5.0) to explore the causal relationships between the variables and assess the mediating effects.
Data analysis was conducted using IBM SPSS Statistics for Windows version 26.0. The study population was characterized by demographic and clinical variables. Different types of data were expressed using appropriate summary statistics, and the mean (standard deviation) was used as measurement data that conformed to a normal distribution. Data that exhibited a skewed distribution are expressed as median (interquartile range). The numerical data are presented as percentages. Statistical significance was determined using the Kruskal – Wallis and Mann – Whitney U tests for non-parametric data. Univariate and multivariate logistic regression analyses were performed to identify risk factors for clinical outcomes. Odds ratios (ORs) and 95% confidence intervals (CIs) were calculated to quantify the association between potential risk factors and clinical outcomes.
Results
Clinical characteristics of AIS patients grouped based on history of hypertension
Between June 2020 and October 2021, we enrolled patients with AIS who were admitted within 24 h of symptom onset and had 24-hour ambulatory blood pressure data (Figure S1). To investigate the impact of a history of hypertension on oral bacteria in AIS patients, we initially categorized AIS patients into a hypertensive group and a non-hypertensive group based on their hypertension history. We then compared various conditions between the two groups, including age, sex, smoking and alcohol consumption history, previous stroke occurrence, comorbidities, disease severity, treatment modalities such as revascularization therapies and enteral nutritional therapy, stroke subtype, oral health status, and 90-day modified Rankin Scale (mRS) score. Following statistical analysis, we noted significant differences in the proportion of atrial fibrillation and stroke subtypes between the two groups. However, no statistical variance was detected in the remaining indicators ().
Table 1. Baseline table between none-hypertension group and hypertension group.
The diversity and composition of oral microbiota for AIS patients grouped based on history of hypertension
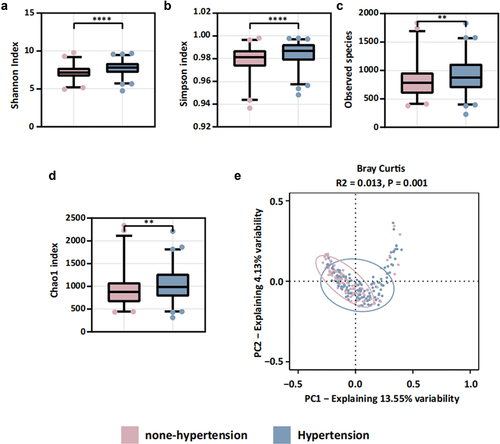
We observed statistically significant differences in alpha diversity measures (Shannon’s index, Simpson’s index, Chao1 index, and observed species) between the two groups (). Additionally, PCoA indicated disparities in beta diversity (). These findings strongly suggest that a history of hypertension influences oral microbiota composition in patients following an AIS event. Further subgroup analyses are warranted to explore the relationship between blood pressure variability and oral microbiota.
Figure 1. Oral microbiota diversity between none-hypertension group and hypertension group. (a-d) alpha diversity: (a) Shannon index, (b) Simpson index, (c) observed species, (d) Chao1 index; (e) beta diversity: PCoA result based on Bray Curtis.
Prediction of oral microbiota function in AIS patients grouped based on their history of hypertension
We conducted a functional prediction analysis using PICRUSt2. The hypertensive group exhibited higher potential across all five modular classifications: amino acid, energy, carbohydrate, cofactor and vitamin, and polysaccharide metabolism. Conversely, the non-hypertensive group showed higher potential, primarily in three modular classifications: gene set, exogenous substance biodegradation, and terpenoid and polyketide biosynthesis (Figure S2). Notably, no differences were observed in the nitrate metabolism module, specifically NO production, between the hypertensive and non-hypertensive groups. These findings suggest that a history of hypertension alone does not contribute to differences in nitrate metabolism-associated functions within the oral microbiota.
The association between blood pressure-related variables and the prognosis for AIS patients with a history of hypertension
We performed subgroup univariate logistic regression analyses to examine the consistency and significance of the 24-hour systolic and diastolic blood pressure mean, standard deviation (SD), and coefficient of variation (CV) on 90-day functional prognosis outcomes, stratified by whether patients had a history of comorbid hypertension (). The findings indicated that in the hypertensive group, both 24-hour systolic SD and 24-hour systolic CV were identified as significant risk factors for 90-day functional prognosis. In contrast, in the non-hypertensive group, only the 24-hour diastolic mean was statistically significant. It is important to note that the mean values were influenced by extreme values and did not adequately capture the data fluctuations.
Table 2. Univariate logistic regression analysis of 24-hour blood pressure indexes and 90-day functional prognosis in none-hypertension group and hypertension group.
Previous studies have suggested that oral microbiota can affect host blood pressure through nitrate metabolism, especially in populations with a history of hypertension [Citation21]. We observed differences in the oral microbiota composition between the two groups of patients based on their history of hypertension. Univariate logistic regression analysis indicated a significant association between 24-hour systolic blood pressure CV and prognosis in AIS patients with a history of hypertension. Consequently, subsequent investigations will focus on exploring the relationship between oral microbiota, 24-hour systolic blood pressure CV, and 90-day functional prognosis, specifically in AIS patients with a history of hypertension.
To group AIS patients with a history of hypertension based on 24-hour systolic blood pressure CV
We utilized a cutoff value of 9.19 for 24-hour post-admission systolic blood pressure CV, determined using restrictive cubic bars, to divide 80 AIS patients with a history of hypertension into two groups: one with a lower CV and the other with a higher CV (). Subsequently, we compared the clinical characteristics of the two groups. Among AIS patients with a history of hypertension, despite the division according to CV, there were no significant clinical index differences between the groups, except for variations in the type of antihypertensive drugs used ().
Figure 2. Associations between 24-hour systolic blood pressure CV and 90-d mRS using restricted cubic spline models. The risk of poor outcomes was relatively flat until around 9.19 of CV and then started to increase rapidly afterwards. OR, odds ratio; 95% CI, 95% confidence interval.
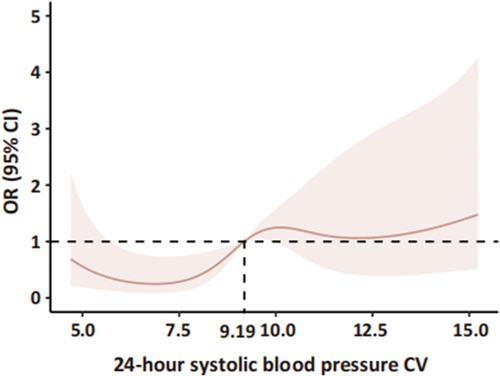
Table 3. Baseline table between lower CV group and higher CV group.
The differences in oral microbiota among patients exhibiting different 24-hour systolic blood pressure CV
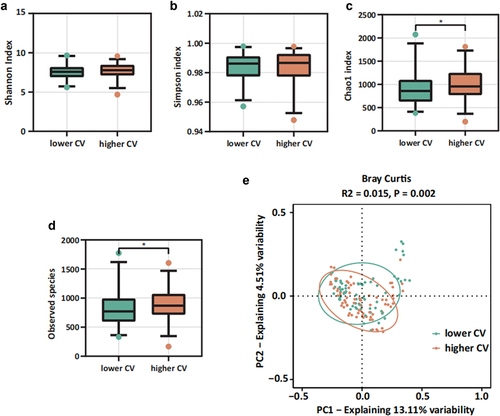
Our findings revealed statistically significant differences in both the Chao1 index and observed species within alpha diversity between the two groups (). Additionally, PCoA analysis indicated a notable difference in beta diversity between these groups. These results suggest that when categorized by CV, there was a significant variance in microbial diversity among the patient groups (). We also found that variables related to medical treatments can modulate the microbiota. Permutational multivariate analysis of variance (PERMANOVA) highlighted significant influences of different types of antihypertensive drugs on oral flora composition. Severe periodontitis, however, appeared to have a minor impact on microbial composition changes (Figure S4).
Figure 3. Oral microbiota diversity between lower CV group and higher CV group. (a-d) alpha diversity: (a) Shannon index, (b) Simpson index, (c) observed species, (d) Chao1 index; (e) beta diversity: PCoA result based on Bray Curtis.
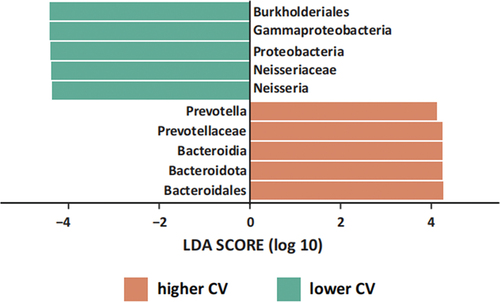
Furthermore, using LEfSe, we identified specific bacterial species that differed between the two groups (). Using an LDA cut-off value of 4.0, LEfSe analysis revealed a higher abundance of Proteobacteria, Gammaproteobacteria, Burkholderiales, Neisseriaceae, and Neisseria in the lower CV group. Conversely, the higher CV group exhibited increased levels of Bacteroidota, Bacteroidia, Bacteroidales, Prevotellaceae, and Prevotella. These distinct taxa may be associated with nitrate metabolism [Citation2], although further investigation is needed to establish the specific metabolic pathways that differ between the two groups.
Figure 4. Oral microbiota LEfSe analysis between lower CV group and higher CV group. Orange is the higher CV group, green is lower CV group. LDA = 4.
The denitrification pathway is closely related to 24-hour systolic blood pressure CV
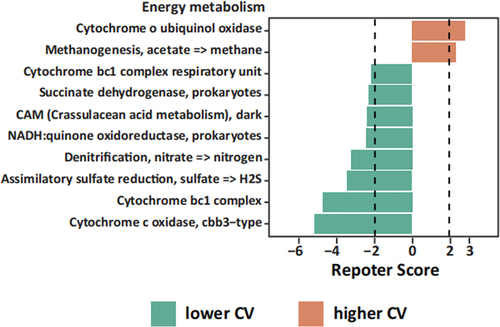
The functional predictions obtained from the PICRUSt2 analysis revealed that the lower CV group exhibited a higher potential across all four module classifications: amino acid metabolism, energy metabolism, carbohydrate metabolism, and cofactor and vitamin metabolism. On the other hand, the higher CV group demonstrated a higher relative potential, specifically in carbohydrate metabolism, compared to the other three module classifications (, S3). Notably, within the energy metabolism category, the module “Denitrification, nitrate => nitrogen” was enriched in the lower CV group (). Denitrification plays a crucial role in the oral microbiota by converting nitrate into gaseous nitrogen forms such as NO2- and NO. This finding aligns with the research hypothesis proposed in this study, suggesting that oral microbiota may produce NO through nitrate metabolism, potentially contributing to a reduction in blood pressure variability.
Figure 5. Energy metabolism of oral microbiota by PICRUSt2 analysis among lower CV group and higher CV group. Green, lower CV group; orange, higher CV group. Dashed lines indicate reporter score of ± 1.96, corresponding to 95% confidence in a normal distribution.
In addition to our focus on the nitrate reduction capacity (i.e. the nitrite production capacity of the oral microbiota, denitrification), which differed between the two groups, it is worth noting that some oral bacteria have the capability to further reduce salivary nitrite to ammonia (NH3). This process can influence the amount of salivary nitrite that is swallowed and absorbed into the circulatory system, ultimately affecting NO production [Citation1,Citation9]. Considering this, we further examined the modules associated with nitrate metabolism, namely “Dissimilatory nitrate reduction, nitrate => ammonia” (DNR), “Assimilatory nitrate reduction, nitrate => ammonia” (ANR), and “Denitrification, nitrate => nitrogen” (DN).
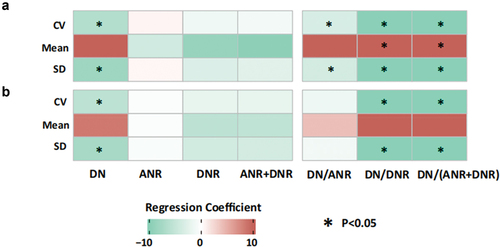
To assess the potential relationship between these modules and systolic blood pressure variability, we calculated the total gene abundance scores for DNR, ANR, and DN. Multiple linear regression was used to evaluate the correlation between these scores, SBP variability, and standard deviation. In the initial analysis, without adjusting for confounding factors, we identified significant negative correlations between DN, DN/ANR, DN/DNR, and DN/(ANR+DNR) with systolic blood pressure variability and standard deviation. Additionally, DN/DNR and DN/(ANR+DNR) were significantly positively correlated with the mean systolic blood pressure (). Indeed, even after adjusting for these confounding factors, we still observed significant negative correlations between DN, DN/ANR, DN/DNR, DN/(ANR+DNR), and systolic blood pressure CV and SD (). These findings suggest a potential association between nitrate metabolism, specifically denitrification, and blood pressure variability.
Figure 6. Results of linear regression analyses among the indexes of 24-hour systolic blood pressure and nitrate metabolic pathway scores. (a) Results of univariable linear regression analyses among the indexes of 24-hour systolic blood pressure and nitrate metabolic pathway scores, (b) results of univariable linear regression analyses among the indexes of 24-hour systolic blood pressure and nitrate metabolic pathway scores, adjusted by age, initial NIHSS and NLR. Red represents the positive correlation, while green represents the negative correlation. The depth of color represents the absolute value of the correlation coefficient. *represents the results with false discovery rates less than 0.05 calculated by the Benjamini-Hochberg method. DN: denitrification, nitrate => nitrogen. ANR: assimilatory nitrate reduction, nitrate => ammonia. DNR: dissimilatory nitrate reduction, nitrate => ammonia. CV: CV of 24-hour systolic blood pressure. Mean: mean value of 24-hour systolic blood pressure. SD: SD of 24-hour systolic blood pressure.
Establishment of TAX score and KEGG score based on the LASSO model
Next, we will explore the specific relationship between nitrate metabolism, particularly denitrification, and systolic blood pressure CV, as well as AIS prognosis. To delve deeper into this association, it would be beneficial to utilize relevant KEGG numbering and taxon construct scores. This approach can provide valuable insights into the underlying mechanisms. By considering these factors comprehensively, we can establish a clearer understanding of how NO production from nitrate metabolism influences both blood pressure variability and AIS prognosis.
We chose “Denitrification, nitrate => nitrogen” as the observation module and selected corresponding KEGG numbers, including K00368, K00370, K00371, K00374, K00376, K02305, K02567, K02568, K04561, and K15864. These numbers were used to establish the KEGG scores based on the LASSO model. In , the dashed line indicates the optimal value of one standard error using the minimum criterion, and according to the cross-validation method, the selected log (λ) is − 3.106, corresponding to a λ value of 0.045. The final KEGG scoring formula yielded four nonzero coefficients, with K00368, K00376, K02567, and K15864 incorporated into the final formula, as shown in .
Figure 7. Function prediction score (KEGG score) and taxonomic prediction score (TAX score). (a) The tuning index (λ) was selected in the LASSO model and receiver operating characteristic curve generation was carried out, and its AUC was plotted against log (λ). Dotted vertical lines depict the optimal λ values employing the minimum deviation and 1 standard error of the minimum deviation (λ-SE). The λ of 0.094, with log (λ) of − 2.362 was chosen as the optimal value. (b) Coefficients were plotted versus log (λ). The vertical line is shown at the optimal value; optimal λ yielded five non-zero coefficients. (c) The function prediction score (KEGG score) was based on a linear combination of four KEGG IDs and one constant. (d) The tuning index (λ) was selected in the LASSO model and receiver operating characteristic curve generation was carried out, and its AUC was plotted against log (λ). Dotted vertical lines depict the optimal λ values employing the minimum deviation and 1 standard error of the minimum deviation (λ-SE). The λ of 0.126, with log (λ) of − 2.071 was chosen as the optimal value. (e) Coefficients were plotted versus log (λ). The vertical line is shown at the optimal value; optimal λ yielded five non-zero coefficients. (f) The taxonomic prediction score (TAX score) was based on a linear combination of four bacteria genera and one constant.
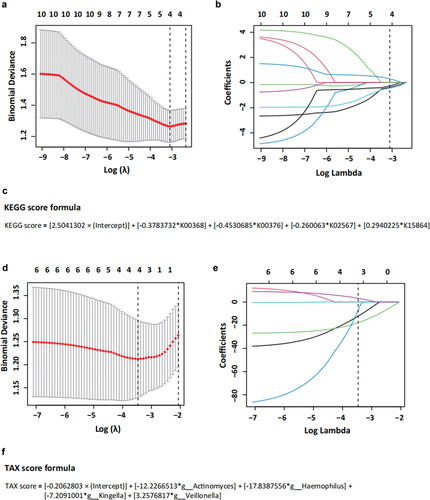
Based on findings from previous studies and the results of LEfSe and PICRUSt2 analyses, seven taxa associated with nitrate metabolism in the oral microbiota were selected to construct the TAX score. These taxa included Actinomyces, Corynebacterium, Haemophilus, Kingella, Neisseria, Rothia, and Veillonella. Utilizing the cross-validation method, a log (λ) of − 3.467 was chosen, corresponding to a λ value of 0.031 (). From this analysis, four nonzero coefficients were obtained using the final TAX score formula. Actinomyces, Haemophilus, Kingella, and Veillonella were included in the final formula, as shown in .
Associations between TAX score and clinical outcomes
To explore the association between different taxa, TAX score, KEGG score, and 90-day functional prognosis of AIS patients with a history of comorbid hypertension, logistic regression analysis was conducted. According to the results presented in , Bacteroidota, Bacteroidia, Bacteroidales, Prevotellaceae, Prevotella, TAX score, and KEGG score were found to be statistically significant in the univariate logistic regression analysis. Subsequently, multifactorial logistic regression analysis was performed. This analysis was adjusted for variables including age, NIHSS score upon admission, anti-hypertension drugs, neutrophil-to-lymphocyte ratio (NLR), and CV of systolic blood pressure within 24 hours. Within this multifaceted analysis, the TAX score remained a significant independent risk factor for 90-day functional prognosis in patients with AIS (OR = 6.657, 95% CI: 2.045–21.668, p = 0.002). This finding suggests that an increased abundance of oral nitrate-reducing bacteria is associated with an elevated risk of poor prognosis in patients with AIS, emphasizing the potential impact of the oral microbiota on stroke outcomes.
Table 4. Logistic regression analysis of bacteria, TAX score, KEGG score and 90-day functional prognosis in AIS patients with hypertension.
Mediating effect relationship between TAX score, 24-hour systolic blood pressure CV, and 90-day functional outcome
In the initial analysis without adjusting for confounders, it was observed that 24-hour systolic blood pressure CV served as a partial mediator in the relationship between the TAX score/KEGG score and 90-day functional outcome (TAX score: β = 0.044, p = 0.008; KEGG score: β = 0.087, p = 0.008) (). After adjusting for age and NIHSS score on admission, the partial mediating role of 24-hour systolic blood pressure CV in the relationship between TAX score and 90-day functional outcome persisted (). These findings suggest that oral nitrate-reducing bacteria, as indicated by the TAX score, directly influence clinical outcomes and indirectly affect them by modulating the 24-hour systolic blood pressure CV. This highlights the potential multifaceted role of the oral microbiota in cardiovascular health and functional prognosis following stroke.
Figure 8. Mediation analyses testing SBP CV within the first 24 hours after hospitalizing as mediators between TAX score/KEGG score and 90-day mRS score.
Figure 9. Mediation analyses testing SBP CV within the first 24 hours after hospitalizing as mediators between TAX score and 90-day mRS score. Model adjusted for age and initial NIHSS.
Discussion
The impact of nitrite depletion on the NO generating capacity of the oral microbiome has been suggested by several authors [Citation3,Citation11,Citation22], but few have explicitly tested the association of nitrite depletion with the outcome of AIS patients or attempted to operationalize the denitrification nitrite/NO generation capacity of the oral microbiome in AIS patients. In this prospective cohort study, we examined 124 patients and identified significant differences in oral microbiota composition between patients with hypertensive AIS and those without a history of hypertension. Further analysis focused on 80 hypertensive patients divided into two groups based on a cutoff value (CV ≤ 9.19 and > 9.19). LEfSe analysis revealed an enrichment of Neisseriaceae and Neisseria in the lower CV group, whereas Prevotellaceae and Prevotella were enriched in the higher CV group. Additionally, PICRUSt2 analysis indicated an enrichment of the ‘Denitrification, nitrate => nitrogen’ module in the lower CV group. By Multiple linear regression, we found significant negative correlations between DN, DN/ANR, DN/DNR, DN/(ANR+DNR) and systolic CV and SD. These findings suggest a potential association between nitrate metabolism, particularly denitrification, and blood pressure variability. The TAX scores were generated from the abundance of oral nitrate-reducing bacteria using the LASSO model. Multiple logistic regression analyses adjusted for confounding factors demonstrated that the TAX score remained independently associated with the 90-day mRS score status, which serves as an independent risk factor for poor clinical prognosis. This suggests a potential link between a reduction in oral nitrate-reducing bacteria and a poor prognosis. Furthermore, in subsequent mediated-effects analyses, adjusting for age and initial NIHSS score factors, the TAX score was found to influence outcomes not only directly but also indirectly by modulating the 24-hour systolic blood pressure CV.
The selection of AIS patients with a history of hypertension for subgroup analyses is supported by previous research suggesting variations in bacterial nitrate reductase gene levels or the relationship between nitrate-reducing bacteria and blood pressure across different populations [Citation23,Citation24]. Additionally, studies have demonstrated that in populations undergoing hypertension treatment, a three-day course of antibacterial mouthwash led to reduced nitrate reduction to nitrite in the oral cavity, accompanied by a slight increase in systolic blood pressure [Citation15]. This indicates that mouthwash altered the nitrate metabolism pathway, impacting NO production by the oral microbiota, coinciding with elevated systolic blood pressure. However, another study involving healthy young individuals found that although the abundance of nitrate-reducing bacteria decreased and nitrate-reducing capacity was significantly reduced one week after antimicrobial mouthwash use, there was no change in blood pressure [Citation25]. Interestingly, both studies showed that the presence or absence of a history of hypertension did not affect the alteration of oral bacterial microbiota composition by mouthwash, resulting in reduced nitrate metabolic activity in the oral cavity. However, those with a history of hypertension were more sensitive to decreases in NO2 − and NO concentrations, leading to more pronounced blood pressure changes.
Therefore, analyzing the functional metabolism of oral bacteria in AIS patients with a history of hypertension seems reasonable, especially considering the altered vascular properties associated with hypertension, warranting precise management and blood pressure monitoring in this population. This approach could provide valuable insights into the role of the oral microbiota in hypertension-related vascular dysfunction and aid in the development of targeted interventions for this subgroup.
Nitrate in the human body primarily stems from oxidation of NO and dietary intake. It enters the oral cavity via circulation and is concentrated for utilization by the oral microbiota [Citation26]. Notably, the nitrate metabolism-associated oral microbiota predominantly comprises Actinomyces, Corynebacterium, Haemophilus, Kingella, Neisseria, Rothia, and Veillonella, consistent with the taxa identified in our LEfSe analysis [Citation2]. In the functional analysis of PICRUSt2 within the hypertensive population, we observed an enrichment of the “Denitrification, nitrate => nitrogen (DN)” module in the lower CV group. Remarkably, the gene abundance of the DN pathway displayed a significant negative correlation with CV, indicating a higher abundance of nitrate-utilizing bacteria in the lower CV group, corroborating the findings from previous research. Supplementation with NO3- led to increased plasma NO2- concentration and lowered systemic blood pressure among older participants (70–79 years), whereas no significant effects were observed in the younger group (18–22 years). Intriguingly, higher levels of Rothia and Neisseria, along with reduced levels of Prevotella and Veillonella, correlated with greater increases in plasma NO2- following NO3- supplementation. These findings underscore the influence of dietary-induced changes in the oral microbial community on NO homeostasis and blood pressure regulation in vivo [Citation11].
Blood pressure variability plays a crucial role in organ perfusion, and its correlation with prognosis has been observed in various diseases [Citation27–33], including AIS [Citation34]. Studies have indicated that following intravenous thrombolysis, there is an increase in blood pressure variability within the first 24 h, which can contribute to early and severe bleeding conversion in intravenous thrombolysis patients, thereby elevating the risk of poor prognosis [Citation35]. Similarly, in patients undergoing endovascular therapy, higher blood pressure variability within the first 24 h has been associated with a poor prognosis at 90 days, with systolic blood pressure variability being particularly influential [Citation36]. Even in patients with AIS who do not receive intravenous thrombolysis or endovascular therapy, higher systolic and diastolic blood pressure variability has been linked to an increased risk of poor prognosis [Citation37]. These findings underscore the importance of recognizing blood pressure variability as a clinically relevant risk factor for prognosis in patients with AIS. Comprehensive management of blood pressure should involve not only controlling blood pressure levels, but also stabilizing blood pressure variability.
This study demonstrated the independent predictive value of the TAX score for 90-day functional prognosis in logistic regression analyses. Furthermore, through mediated effect analyses, it was demonstrated that oral nitrate-reducing bacteria not only directly influenced outcomes but also indirectly affected them by modulating the 24-hour systolic blood pressure CV. This novel finding illustrates the relationship between the oral microbiota, blood pressure dynamics, and prognosis in patients with AIS within the same population. This highlights the clinical significance of oral management and the dynamic monitoring of oral microbiota abundance in stroke populations. Moreover, it provides new insights into the development of biomarkers and prediction models. By understanding how the oral microbiota influences blood pressure variability and subsequently affects prognosis in AIS patients, healthcare providers can potentially intervene early to improve patient outcomes and quality of life. Overall, this study contributes to the growing body of evidence that emphasizes the importance of holistic approaches to stroke care, including considerations of oral health and its impact on systemic health outcomes.
In terms of oral and dental health, prior research has suggested that the nitrate reduction capacity of the oral microbiota is compromised in individuals with periodontitis [Citation38]. However, in our study population, we found no significant difference in the prevalence of periodontitis between groups. To further explore the role of periodontitis, we initially observed that severe periodontitis may have a minor impact on composition changes in AIS patients with hypertension (Figure S4). Additionally, we conducted a comparative analysis of changes in the relative abundance of periodontitis-associated bacteria. As detailed in Table S2, we found increased abundance of Tannerella forsythia, Porphyromonas gingivalis, Selenomonas sputigena, Treponema socranskii, and Peptostreptococcus spp. in AIS patients with hypertension. Moreover, the higher CV group exhibited elevated levels of Filifactor alocis, Tannerella forsythia, Treponema denticola, and Prevotella spp. In summary, these findings suggest that our initial assessment of periodontitis may have been oversimplified. Future studies should refine our understanding by considering the severity of periodontitis and its specific disease symptoms. This discovery underscores the importance of adopting a more holistic approach to oral care in patients with AIS, as effective clinical outcomes may require addressing oral health concerns beyond those related solely to oral and dental diseases. Integrating comprehensive oral care strategies into the management of AIS patients could potentially yield more favorable clinical prognoses.
Furthermore, regarding the sampling method, we opted for noninvasive oral swabs. This decision stems from several factors. First, patients with AIS typically receive antiplatelet or anticoagulation therapy, making invasive methods, such as scraping plaque from the area, potentially risky because of the likelihood of severe gingival bleeding. Second, during the initial 24 h following hospital admission, there is often a higher proportion of patients who may not be able to cooperate with autonomous saliva collection. Therefore, using oral swabs proved to be a more feasible and safer approach in this context.
This study had some limitations. First, acknowledging the single-center, small-sample nature of the study highlights the need for broader, multicenter studies with larger sample sizes to enhance the generalizability of the findings and increase statistical power. Second, the omission of saliva and blood samples for testing NO2- and NO3- concentrations represents a potential limitation in understanding nitrate metabolism and its association with blood pressure variability. Including these measurements could offer a more comprehensive understanding of the mechanisms underlying observed relationships. Third, the limited duration of data collection within the first 24 h after admission restricts the ability to capture dynamic changes in both oral microbiota and blood pressure variability over time. Collecting specimens and monitoring parameters at multiple time points could provide a more nuanced understanding of the temporal dynamics and potential causal relationships between oral microbiota changes and blood pressure variability. Lastly, the study’s focus on short-term outcomes within the initial 24 h post-admission precludes an assessment of the long-term effects of oral microbiota on blood pressure and subsequent prognosis. Extending the follow-up period could offer insight into the sustained impact of oral management interventions on patient outcomes.
Addressing these limitations in future studies could further elucidate the role of oral management and examination in patients with stroke, potentially leading to more effective prognostic models and interventions for improving patient outcomes.
Conclusions
The results of this study revealed that oral microbial gene abundance for denitrification was associated with altered 24-hour systolic blood pressure CV after stroke in patients with a history of comorbid hypertension. Additionally, oral nitrate-reducing taxa scores (TAX scores) were demonstrated to be independent risk factors for 90-day functional prognosis in patients in logistic regression analyses. Mediation effect analysis showed that 24-hour systolic blood pressure CV was a mediating effector between TAX scores and 90-day functional prognosis, demonstrating for the first time that oral nitrate-reducing bacteria affect the 90-day functional prognosis in patients with AIS by influencing systolic blood pressure variability.
Supplemental Materialclean.docx
Download MS Word (24.1 MB)Disclosure statement
No potential conflict of interest was reported by the author(s).
Supplementary material
Supplemental data for this article can be accessed online at https://doi.org/10.1080/20002297.2024.2382620
Additional information
Funding
References
- Morou-Bermúdez E, Torres-Colón JE, Bermúdez NS, et al. Pathways linking oral bacteria, nitric oxide metabolism, and health. J Dent Res. 2022;101(6):623–16. doi: 10.1177/00220345211064571
- Bryan NS, Burleigh MC, Easton C. The oral microbiome, nitric oxide and exercise performance. Nitric Oxide. 2022;125-126:23–30. doi: 10.1016/j.niox.2022.05.004
- Schlagenhauf U. On the role of dietary nitrate in the maintenance of systemic and oral health. Dent J (Basel). 2022;10(5):10. doi: 10.3390/dj10050084
- Jones AM, Vanhatalo A, Seals DR, et al. Dietary nitrate and nitric oxide metabolism: Mouth, circulation, skeletal muscle, and exercise performance. Med Sci Sports Exerc. 2021;53(2):280–294. doi: 10.1249/MSS.0000000000002470
- Haynes WG, Noon JP, Walker BR, et al. Inhibition of nitric oxide synthesis increases blood pressure in healthy humans. J Hypertens. 1993;11(12):1375–1380. doi: 10.1097/00004872-199312000-00009
- Umans JG, Levi R. Nitric oxide in the regulation of blood flow and arterial pressure. Annu Rev Physiol. 1995;57(1):771–790. doi: 10.1146/annurev.ph.57.030195.004011
- Emdin CA, Khera AV, Klarin D, et al. Phenotypic consequences of a genetic predisposition to enhanced nitric oxide signaling. Circulation. 2018;137(3):222–232. doi: 10.1161/CIRCULATIONAHA.117.028021
- Erdmann J, Stark K, Esslinger UB, et al. Dysfunctional nitric oxide signalling increases risk of myocardial infarction. Nature. 2013;504(7480):432–436. doi: 10.1038/nature12722
- Goh CE, Bohn B, Marotz C, et al. Nitrite generating and depleting capacity of the oral microbiome and cardiometabolic risk: results from ORIGINS. J Am Heart Assoc. 2022;11(10):e023038. doi: 10.1161/JAHA.121.023038
- Liu Y, Croft KD, Hodgson JM, et al. Mechanisms of the protective effects of nitrate and nitrite in cardiovascular and metabolic diseases. Nitric Oxide. 2020;96:35–43. doi: 10.1016/j.niox.2020.01.006
- Vanhatalo A, Blackwell JR, L’Heureux JE, et al. Nitrate-responsive oral microbiome modulates nitric oxide homeostasis and blood pressure in humans. Free Radical Biol & Med. 2018;124:21–30. doi: 10.1016/j.freeradbiomed.2018.05.078
- Li Y, Zhu M, Liu Y, et al. The oral microbiota and cardiometabolic health: a comprehensive review and emerging insights. Front Immunol. 2022;13:1010368. doi: 10.3389/fimmu.2022.1010368
- Paiva B, Laranjinha J, Rocha BS. Do oral and gut microbiota communicate through redox pathways? A novel asset of the nitrate-nitrite-NO pathway. FEBS Lett. 2024. doi: 10.1002/1873-3468.14859
- Koch CD, Gladwin MT, Freeman BA, et al. Enterosalivary nitrate metabolism and the microbiome: intersection of microbial metabolism, nitric oxide and diet in cardiac and pulmonary vascular health. Free Radical Biol & Med. 2017;105:48–67. doi: 10.1016/j.freeradbiomed.2016.12.015
- Bondonno CP, Liu AH, Croft KD, et al. Antibacterial mouthwash blunts oral nitrate reduction and increases blood pressure in treated hypertensive men and women. Am J Hypertens. 2015;28(5):572–575. doi: 10.1093/ajh/hpu192
- Castro P, Ferreira F, Nguyen CK, et al. Rapid assessment of blood pressure variability and outcome after successful thrombectomy. Stroke. 2021;52(9):e531–e35. doi: 10.1161/STROKEAHA.121.034291
- Bennett AE, Wilder MJ, McNally JS, et al. Increased blood pressure variability after endovascular thrombectomy for acute stroke is associated with worse clinical outcome. J Neurointerv Surg. 2018;10(9):823–827. doi: 10.1136/neurintsurg-2017-013473
- Kim TJ, Park HK, Kim JM, et al. Blood pressure variability and hemorrhagic transformation in patients with successful recanalization after endovascular recanalization therapy: a retrospective observational study. Ann Neurol. 2019;85(4):574–581. doi: 10.1002/ana.25434
- Grant MM, Jönsson D. Next generation sequencing discoveries of the nitrate-responsive oral microbiome and its effect on vascular responses. J Clin Med. 2019;8(8):1110. doi: 10.3390/jcm8081110
- Peng C, Chen Q, Tan S, et al. Generalized Reporter score-based enrichment analysis for omics data. bioRxiv. 2023:2023.10.13.562235.
- Willmott T, Ormesher L, McBain AJ, et al. Altered oral nitrate reduction and bacterial profiles in hypertensive women predict blood pressure lowering following acute dietary nitrate supplementation. Hypertension (Dallas, Tex : 1979). Hypertension. 2023;80(11):2397–2406. doi: 10.1161/HYPERTENSIONAHA.123.21263
- Bryan NS, Tribble G, Angelov N. Oral microbiome and nitric oxide: the missing link in the management of blood pressure. Curr Hypertens Rep. 2017;19(4):33. doi: 10.1007/s11906-017-0725-2
- Burleigh M, Liddle L, Muggeridge DJ, et al. Dietary nitrate supplementation alters the oral microbiome but does not improve the vascular responses to an acute nitrate dose. Nitric Oxide. 2019;89:54–63. doi: 10.1016/j.niox.2019.04.010
- Tribble GD, Angelov N, Weltman R, et al. Frequency of tongue cleaning impacts the human tongue microbiome composition and enterosalivary circulation of nitrate. Front Cell Infect Microbiol. 2019;9:39. doi: 10.3389/fcimb.2019.00039
- Ashworth A, Cutler C, Farnham G, et al. Dietary intake of inorganic nitrate in vegetarians and omnivores and its impact on blood pressure, resting metabolic rate and the oral microbiome. Free Radical Biol & Med. 2019;138:63–72. doi: 10.1016/j.freeradbiomed.2019.05.010
- Hezel MP, Weitzberg E. The oral microbiome and nitric oxide homoeostasis. Oral Dis. 2015;21(1):7–16. doi: 10.1111/odi.12157
- Wang G, Ma K, Ma Z, et al. Short-term blood pressure variability and outcomes in non-dialysis chronic kidney disease. Front Med (Lausanne). 2022;9:911205. doi: 10.3389/fmed.2022.911205
- Zhao Y, Yang L, Yu S, et al. Blood pressure variability and prognosis in hemodialysis patients: asystematic review and meta-analysis. Kidney diseases (Basel, Switzerland). 2021;7:411–424.
- de Heus Raa, Olde Rikkert MGM, Tully PJ, et al. Blood pressure variability and progression of clinical Alzheimer disease. Hypertension (Dallas, Tex : 1979). Hypertension. 2019;74(5):1172–1180. doi: 10.1161/HYPERTENSIONAHA.119.13664
- Yang L, Li J, Wei W, et al. Blood pressure variability and the progression of chronic kidney disease: a systematic review and meta-analysis. J Gen Intern Med. 2023;38(5):1272–1281. doi: 10.1007/s11606-022-08001-6
- Kario K, Hoshide S, Mizuno H, et al. Nighttime blood pressure phenotype and cardiovascular prognosis: practitioner-based nationwide JAMP study. Circulation. 2020;142(19):1810–1820. doi: 10.1161/CIRCULATIONAHA.120.049730
- Budiman-Mak E, Epstein N, Brennan M, et al. Systolic blood pressure variability and lower extremity amputation in a non-elderly population with diabetes. Diabetes Res Clin Pract. 2016;114:75–82. doi: 10.1016/j.diabres.2016.01.010
- Manning L, Hirakawa Y, Arima H, et al. Blood pressure variability and outcome after acute intracerebral haemorrhage: a post-hoc analysis of INTERACT2, a randomised controlled trial. The Lancet Neurol. 2014;13(4):364–373. doi: 10.1016/S1474-4422(14)70018-3
- Yong M, Kaste M. Association of characteristics of blood pressure profiles and stroke outcomes in the ECASS-II trial. Stroke. 2008;39(2):366–372. doi: 10.1161/STROKEAHA.107.492330
- Liu K, Yan S, Zhang S, et al. Systolic blood pressure variability is associated with severe hemorrhagic transformation in the early stage after thrombolysis. Transl Stroke Res. 2016;7(3):186–191. doi: 10.1007/s12975-016-0458-6
- Mistry EA, Mehta T, Mistry A, et al. Blood pressure variability and neurologic outcome after endovascular thrombectomy: a secondary analysis of the BEST study. Stroke. 2020;51(2):511–518. doi: 10.1161/STROKEAHA.119.027549
- Chen Y, Ma Y, Qin J, et al. Blood pressure variability predicts poor outcomes in acute stroke patients without thrombolysis: a systematic review and meta-analysis. J Neurol. 2023;271(3):1160–1169. doi: 10.1007/s00415-023-12054-w
- Rosier BT, Johnston W, Carda-Diéguez M, et al. Nitrate reduction capacity of the oral microbiota is impaired in periodontitis: potential implications for systemic nitric oxide availability. Int J Oral Sci. 2024;16(1):1. doi: 10.1038/s41368-023-00266-9