?Mathematical formulae have been encoded as MathML and are displayed in this HTML version using MathJax in order to improve their display. Uncheck the box to turn MathJax off. This feature requires Javascript. Click on a formula to zoom.
ABSTRACT
Reducing the standardised test score gap between ethnic minority and majority students remains a global challenge in education. Research on this matter is sparse in Nepal, where ethnic minorities comprise the country’s majority population but experience systemic oppression. We hypothesised that the lack of proportional teacher diversity has contributed to lower outcomes on standardised tests among ethnic minority students in Nepal. We collected data of eighth-grade students and their teachers from 10 secondary schools in two towns in Nepal through convenient and snowball samplings. Multiple linear regression was used to explore the relationship of teacher-student ethnicity matching and teachers’ ethnicity on students’ academic performance in science, mathematics, social studies, and the Nepali language using students’ exit examinations. Our analysis showed a statistically significant positive association between teacher-student ethnicity matching and students’ mathematics and social studies test scores, an ethnic advantage. In most cases, teachers from minority groups were associated with a significantly higher student-test-score than Brahmin teachers, who were in majority in teaching force. We recommend that policymakers, international education organisations, and researchers attend to teacher-student ethnicity matching and teachers’ ethnicity through strategic hiring and professional developments for teachers to redress educational disparities in Nepal.
Introduction
This study enriches the knowledge base on the importance of teacher-student ethnicity matching and teachers’ ethnic diversity in reducing the standardised test score gap among ethnic minority students. We examined the relationship of teacher-student ethnicity matching and teachers’ ethnicity on eighth-grade Nepali students’ test scores in science, mathematics, social studies, and the Nepali language (hereafter “Nepali” only) subjects by exploring the following research question: What is the relationship of teacher-student ethnicity matching and teachers’ ethnicity on students’ test scores in science, mathematics, social studies, and Nepali each separately?
Significance of the study
While plenty of research exists in situations outside Nepal, pointing to the advantage of teacher-student ethnicity matching on minority students’ school success, no study has explored such a relationship in Nepal. Internationally, scholars have pointed to the low learning outcomes among historically marginalised students, such as ethnic minorities and Indigenous people, compared to privileged students on the standardised tests (Ford, Citation2012; Pang, Citation2017; Yeh, Citation2016). In Nepal, researchers have explored only limited variables to examine the academic disparities among the marginalised students (see Joshi, Digari, & James, Citation2022; Neupane, Citation2017; Panthi & Belbase, Citation2017; Poudel, Thapalia, & Khanal, Citation2015). The lack of research exploring and examining a wider array of predictors, including the teacher-student matching and teachers’ ethnicity on test score outcomes has contributed to poor educational interventions. Thus, the present inquiry is a critical consideration for researchers, international education agencies, and policymakers engaged in the education sector in Nepal.
Nepal offers one of the best situations to examine the relevance of teacher-student ethnicity matching and teachers’ ethnicity due to the country’s ethnic diversity and ethnicity-based disparity in education. The country is a mosaic of 126 caste and ethnic groups with 123 vernaculars (Central Bureau of Statistics [CBS], Citation2012). In fact, ethnic minorities––circa two-thirds of the population––make up the country’s majority population but are largely disenfranchised.
In this study, “ethnicity” refers to both caste and ethnic groups classified in the Nepal Government’s official documents published by the Central Bureau of Statistics (CBS, Citation2012). “Caste” is a social stratification within the Indo-Nepali group and loosely extended to ethnic groups. Subedi (Citation2016b) argued that caste and ethnic identities could not be viewed in a linear perspective in Nepal: Aeons of interactions among religious, caste, and ethnic groups resulted in the “overlapping, blurring and hybridization of identities” (p. 320). Thus, it is difficult to set any demarcation line among castes and ethnicities in Nepal. Still, people are deeply tied to their ethnic and caste identities and often use those identities to differentiate each other in everyday life in the country.
Nepal’s ethnicities are divided into three broad groups: Indo-Nepali, Tibetan-Nepali, and Indigenous groups (Savada, Citation1991). According to CBS (Citation2012), they comprised of Chhetri (16.6%), Dalit (13.6%), Brahmin (12.18%), Magar (7.12%), Tharu (6.56%), Tamang (5.81%), Newar (4.99%), Muslim (4.39%), Yadav (3.98%), and Gurung (1.97). Chhetri, Dalit, Brahmin, Tharu, and Yadav fall into the Indo-Nepali group, while Tamang, Gurung, and Magar fall into the Tibetan-Nepali group. Newar, however, falls within none of the categories. Interestingly, Brahmin, Chhetri, and Dalit groups are dissected into Hill (the Northern mountains) and the Terai (the Southern plains) groups. Historically, the hill Brahmin and Chhetri groups have held political power and exclusively privileged status. In contrast, the rest of the ethnic groups have been marginalised through linguistic, cultural, religious, or other forms of domination, so they are referred to as ethnic minorities. Most ethnic minorities in Nepal live in extreme poverty and have low literacy levels (Subedi, Citation2016a). Among them, Dalits, whose identity can be labelled as both a caste and ethnic group, have been extremely disadvantaged (Khanal, Citation2014; Sob, Citation2012) and discriminated against for centuries. Historically, the only minority group benefitting from aligning with the dominant Brahmin and Chhetri groups has been Newar (Bennett, Dahal, & Govindasamy, Citation2008; Stash & Hannum, Citation2001).
In Nepal, ethnicity or background-based favouritism is a norm as ethnic groups seek to preserve thousands of years of local cultures, languages, and customs. However, it is important to note that ethnicity-related favouritism has been problematic. For instance, teachers and students from historically marginalised communities like Dalits have faced discrimination from teachers and students from privileged groups (Khanal, Citation2014). Relatedly, ethnic minority teachers represent only 38.4% in primary, 29.0% in lower secondary, 24.9% in secondary, and 22.6% in higher secondary schools despite their majority status in the total population count (Ministry of Education, Science and Technology [MoEST], Citation2018). Their underrepresentation among educators could in theory reduce the likelihood that ethnic minority students would benefit from background-based preference. These considerations and many others make ethnicity-based preference and its effect on the learning outcomes of marginalised students as critical issue to investigate.
Recently, as Nepal has reorganised its social, political, and economic structures to be more equitable (Nepal Law Society, Citation2015), and determined that educational outcomes among ethnic minorities are critical measures of progress. If ethnic minorities continue to lag in critical academic standards, their capacity to participate equally in the economy and politics will remain limited. Hence, ethnic matching has been explored as a potential solution to minimise educational inequalities and outcome gaps. One study has already shown the potential benefit of focusing on ethnicity-based achievement disparity. Poudel et al. (Citation2015) collected a nationally representative dataset through stratified random sampling and analysed the test scores of 44,067 eighth-grade students. The study’s analysis of variance revealed a considerable achievement gap among students of different ethnic backgrounds in science, mathematics, and Nepali. The difference in means among all the ethnic groups in the three subjects was statistically significant at a 99.9% confidence level (p ≤ .001). The study also showed a considerable difference in academic achievement in academic subjects among minority groups––Magar, Gurung, Tharu, Madhesi, and Tamang students (p ≤ .001). However, more research is warranted on the nature of achievement disparity among various ethnicities and castes in Nepal and the relationship to teacher-student ethnicity matching and teacher ethnicity.
Theoretical perspective
The researchers hypothesised that teachers from historically marginalised groups could serve as role models for students of similar backgrounds. Moreover, we were interested in exploring whether an ethnic advantage exists and if such a relationship was advantageous to enhancing students’ academic success in Nepal. We based our hypothesis on the findings of studies that reported the advantages of matching teachers and students from similar ethnic backgrounds. For instance, Glock and Kleen’s (Citation2019) study showed minority teachers exercised positive bias towards minority students when teachers’ self-efficacy was higher. Earlier, Cherng and Halpin (Citation2016) correlated minority students and minority teacher matching with higher preferences for minority teachers compared with White teachers. Prior to that, Hue and Kennedy (Citation2014) reported minority teachers in Hong Kong had positive attitudes towards and treatment of minority students, and argued that ethnic minority teachers had been instrumental in recognising students’ cultural diversity, reflecting on minority students’ behaviour and practices, and addressing the growing cosmopolitan needs of the society. Kleen, Bonefeld, Glock, and Dickhauser (Citation2019) confirmed that ethnic minority teachers of German backgrounds teaching in Turkey tended to show more positive in-group favouritism towards students of the same backgrounds. Finally, some studies showed a direct association between matching African American teachers and students, and improved academic performance in mathematics (Eddy & Easton-Brooks, Citation2011) and reading (Yarnell & Bohrnstedt, Citation2018) in the US.
Review of literature
Unfortunately, research regarding the relationship of teacher-student ethnicity matching and teachers’ ethnicity on students’ academic performance is insufficient, albeit existing studies have indicated meaningful outcomes. Several studies have explored issues other than the academic outcomes resulting from ethnically matched teachers and students. For instance, Howard (Citation2010) employed grounded theory to examine the impact of teacher diversity on various educational processes and student development. Among other things, the study concluded that minority teachers were valuable to raising minority students’ self-esteem and first language development.
On the other hand, Lindsay and Hart (Citation2017) explored the relationship between teacher diversity and disciplinary issues among culturally diverse students across different grade levels. The researchers used North Carolina’s 2007 to 2013 school year administrative data to understand how African American students’ disciplinary rates were affected by having teachers of the same culture. The researchers concluded that matching students with teachers of the same cultural background significantly decreased “the number of reported incidents for [African American] students, particularly for types of offenses that required more subjective evaluation” by teachers (p. 506). More recently, Egalite and Kisida’s (Citation2018) study revealed that students’ happiness, quality of communication, aspirations for college, and personal efforts were positively associated with teacher-student ethnicity matching with middle school matching achieving the largest effects. In sum, the highlighted studies note the positive contributions of minority teachers on minority students with similar cultural backgrounds, yet they explored social, behavioural, and emotional outcomes, largely neglecting the academic outcomes.
While additional research has been conducted on the relationship of ethnicity matching on student outcomes over the past decade, more research is needed in international contexts. Most studies have been carried out within US public schools and yielded some compelling but inconclusive results. For instance, using data from the Early Childhood Longitudinal Study, Eddy and Easton-Brooks (Citation2011) examined the long-term contributions of ethnicity matching on mathematics scores of African American students. Their study included 1200 African American students and concluded that teacher-student ethnic matching yielded a significant positive impact on African American students’ mathematics scores from kindergarten to fifth-grade. Although the authors did not conclude that African American teachers had been better teachers for students of the same background, they contended that ethnic matching was responsible for enhancing students’ academic performance.
Encouragingly, Yarnell and Bohrnstedt’s (Citation2018) was one of the latest studies that detailed the positive impact of teacher-student ethnicity matching but determined that it was moderated by gender. According to the study’s findings, African American male and female students scored higher in reading when matched by gender and race with African American teachers. Also, African American female students’ reading scores were enhanced when they were taught by female teachers of other minority racial backgrounds. Two recent reviews also evidenced positive consequences of teacher-student ethnicity matching from a broader perspective. First, a review by Driessen (Citation2015) examined 24 quantitative studies carried out in the US concerning the relationship between teacher-student ethnicity matching and students’ cognitive and non-cognitive achievement. Their review of literature showed that ethnic matching and higher concentration of diverse teachers contribute to more positive outcomes more so in subjective evaluations of students because of the “positive bias of the teachers toward students from their ethnic group” (p. 188). Second, Easton-Brooks’ (Citation2013) review reported that students’ performance was boosted regardless of their backgrounds when there was teacher-student ethnicity matching. For example, African American and Spanish-speaking students’ higher test scores in reading and mathematics at the elementary and middle school levels (fourth and sixth grades) were positively associated with the teacher-student ethnic relationship. Motamedi and Stevens (Citation2018) discussed the “cognitive, social, and emotional benefits” (p. 1) of having minority teachers for all students. Yet research is largely clustered within the US context, leaving a void in international education.
Conversely, teacher-student ethnicity matching has not always been associated with students’ academic achievement. Banerjee’s (Citation2018) quantitative study collected US Department of Education’s Early Childhood Longitudinal Survey’s nationally representative sample of more than 6,000 students who started kindergarten in 1998 and completed the third-grade in 2002 and found that there was no effect on students’ test scores in both mathematics and reading due to ethnoracial matching. However, in schools where the teacher diversity was high, Hispanic students’ growth in mathematics and reading was also high, and the inverse was true. Driessen’s (Citation2015) review of 24 studies from the US, too, aligned with Banerjee’s results as it did not find a significant association between teacher-student ethnicity matching and students’ scores in tests that required objective evaluation. Like in Banerjee (Citation2018), according to Driessen’s (Citation2015) study, only in schools where minority teachers’ presence was substantial, minority students benefited academically.
More recently, the usefulness of teacher-student ethnicity matching and teachers’ ethnic diversity has been widely realised, particularly to enhance minority students’ school performance, attitude, and behavioural development. One of the reasons for such emphasis is the positive attitude or bias of minority teachers towards minority students (Hue & Kennedy, Citation2014), which eventually benefits minority students. However, research is still emerging in the field, and there is no such definitive trajectory in this line of inquiry. Hence, it is hard to generalise all types of students and teachers of all cultural contexts from the existing body of scholarship. Another problem germane to the existing literature is that most research has been conducted in the US context, so the findings do not reflect the realities of minority students’ schooling internationally.
Materials and method
The current study used students’ science, mathematics, social studies, and Nepali test scores as dependent variables, while teacher-student ethnicity matching, and teachers’ ethnicity are predictor variables. The study used one dependent variable (DV) and two independent variables (IVs) for each subject. The IVs were all categorical variables and had two categories for teacher-student matching and four to seven categories for teachers’ ethnicity. Students’ test scores ranged between 0 and 100, where a higher score meant students performed better in the respective subject. As we were interested in understanding the relationship of teacher-student ethnicity matching and teachers’ ethnicity on students’ subject-wise performance, we explored whether students’ test scores had a relationship with the predictor variables. This study allowed us to analyse the relevance of teachers having the same ethnic background as students and teachers’ ethnic diversity in teaching.
Eighth-grade examinations in Nepal
The education system in Nepal includes early childhood, primary (grade 1–8), secondary (grade 9–12), and higher education (MoEST, Citation2018). Though education is not mandatory, children start primary education at five and complete eighth-grade at or before 14. There are mainly four levels of standardised examinations held at the end of the eighth, tenth, eleventh, and twelfth grades. While the eighth-grade examination is conducted by local governments, the latter three are controlled by the National Examinations Board (NEB). When this data was collected, eighth-grade examinations were controlled by District Education Offices within the MoEST. As eighth-grade is the final year of primary education, every student must pass it to qualify for enrolment in secondary school. The assessments are usually held in mid-March as the academic session in Nepal ends in the last week of March. Data for this study were drawn from the district-level examinations held during the 2016–2017 academic year.
Data collection
The researchers obtained data from 10 secondary schools in Nepal. The participating schools comprised four public and six private schools. The dataset included information, such as students’ test scores and ethnicity, and teachers’ ethnicity and subjects of teaching, among others. Respective schools determined the ethnicity of teachers and students based on the Nepal Government’s caste and ethnic classification (see CBS, Citation2012). To conceal the identity of participants, we did not collect any identifying information. Each school provided the requested participant information, which was compiled into a single dataset.
The selection of schools was made using the convenience and snowball sampling techniques. Initially, based upon the professional connections of the first author, two school principals were contacted. The principals had been English as a Foreign Language teacher-trainer colleagues of the first author at the Secondary Education Development Centre in Nepal. The principals suggested the remaining schools. In all schools from where the current data was gathered, teacher-participants taught student-participants for at least a year.
The selected schools were from two towns in Chitwan and Tanahun districts in Nepal. Because the towns were new settlements, the schools were representative of Nepal’s ethnic diversity and frequently received internal migrants. However, official reports indicated that the impact of the migration appeared to be too small to measure. For example, in 2011, 3,788,049 people migrated from one district to another in Nepal, and only 5% of the total moved to four districts, including Chitwan (CBS, Citation2012). The relatively low migration and mobility rate are vital because they point to the stability of teacher-student dyads and allow for an examination of the merits of ethnicity matching and diversity.
Data analysis
Data were analysed via a multiple linear regression using IBM SPSS v28. Before conducting the analysis, we followed a series of steps. First, because the study used categorical predictor variables, we performed data transformation to use a single regression equation to represent different groups. So, both the categorical variables––teacher-student ethnicity matching and teachers’ ethnicity––were transformed into dummy variables, coded as 0 for unrepresented and 1 for represented categories. We selected the category with the largest population size as a reference category in each predictor group. Accordingly, “unmatched” for teacher-student ethnicity matching and “Brahmin” for teachers’ ethnicity variables were used as reference categories, coded 0.
Then, we explored the descriptive statistics to check the patterns and the structure of data within the dataset. Data is normal if the skewness is between ‐2 and +2 and kurtosis is between −7 and +7 (Bryne, Citation2010). Because the current data points met the above criteria, the dataset was normally distributed. After examining the mean distribution, we assessed the G*Power using . The power of 1.0 in all four subjects indicates far larger than the optimal value of at or near .80. So, we determined effect size to be the best measure of the strength of the relationship. To report the magnitude of the relationship, effect sizes were calculated based on Cohen (Citation1988): R2 = .02 (small), around R2 = .13 (medium), and above R2 = .26 (large). While a small effect size means a weaker relationship among the variables, a large effect size means a stronger relationship.
Third, the researchers assessed the assumptions of the multiple linear regression by calculating the tolerance and the variance inflation factor (VIF) statistics for each predictor (see ). For the tolerance, a value around zero means multicollinearity because the value of .10 serves as the cut-off point; for the VIF, any value more than 10 is considered problematic (Mertler & Vannatta, Citation2013). Our data showed no VIF of 10 or larger, meaning no multicollinearity. Also, we assumed no issue with multicollinearity because the largest of the significant correlations between the teacher-student ethnicity matched group and teachers’ ethnicity with Magar background was r = .34. Multicollinearity ratings closer to +/–1.0 means a perfect correlation between independent variables thus reduce the reliability of inferences.
Table 1. Students’ test scores based on teachers’ ethnicity (N = 549).
Table 2. Students’ test scores based on teacher-student ethnicity matching (N = 549).
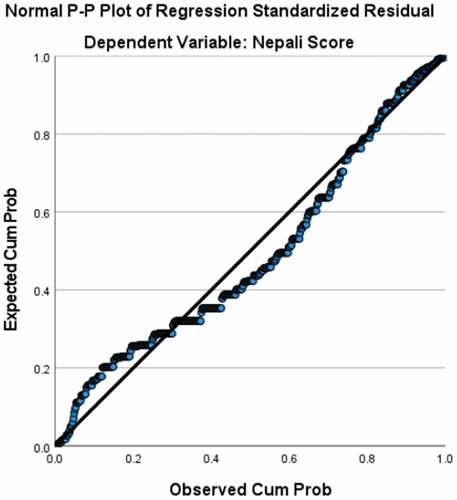
Fourth, even though the plots of residuals were constrained due to dummy variables, they were within comparable ranges above and below zero; also, while the normal probability plots showed some deviations from an expected normal distribution of the residuals, they were not excessive (see Appendix). Fifth, as the data had an uneven distribution of teachers across ethnic categories (less than 10 observations in many ethnic cases), we did not perform interaction effects. Finally, our data was insufficient to explore teachers’ other characteristics, such as teachers’ gender and academic qualification, to control for their influence because some of the ethnicity cells had 0 values.
Findings
Descriptive output
According to , the largest number of students were taught by Brahmin in all four subjects. Specifically, Brahmin teachers taught 53.37% (n = 293) of science, 55.01% (n = 302) of mathematics, 60.83% (n = 334) of social studies, and 78.51% (n = 431) of Nepali students in the sample. Contrarily, Magar teachers taught 6.19% of science (n = 34), 2.55% of mathematics (n = 14), and 3.28% of social studies (n = 18) students, while Gurung teachers taught 3.64% of students in Nepali (n = 20). Also, teachers with Tamang background taught only science. In sum, although Nepal’s various ethnic groups are represented among teachers they are not equally distributed within all subjects. Moreover, according to , teachers taught students of the same ethnic backgrounds between the lowest of 15.48% in mathematics to the highest of 17.49% in science. Finally, students whose ethnicity matched with teachers scored higher in all four subject area when compared to students in the unmatched group––from the highest score in social studies (M = 62.27; SD = 13.44) to the lowest in mathematics (M = 55.34; SD = 17.02).
The mean score for students taught by Chhetri teachers was the highest in science (M = 68.42; SD = 13.00), while it was the lowest for students taught by teachers from the Dalit caste (M = 43.09; SD = 14.34). In mathematics, the mean score for Madhesi-taught students was the highest (M = 65.89; SD = 17.56), and Brahmin-taught students was the lowest with the highest standard deviation (M = 45.13; SD = 17.86). In social studies, Newar-taught students earned the lowest score (M = 44.30; SD = 8.89), while Gurung-taught students scored the highest with the lowest standard deviation (M = 72.80; SD = 7.80). Finally, in Nepali, while Newar-taught students scored the highest mean with the largest standard deviation (M = 66.88; SD = 12.26), the opposite was the case with Chhetri-taught students (M = 53.88; SD = 8.51).
Regression output
present regression results. According to , teacher-student ethnicity matching, and teachers’ ethnicity together statistically significantly predicted students’ test scores in science (F = 25.87; R2 = .22), mathematics (F = 17.02; R2 = .16), social studies (F = 27.91; R2 = .27), and Nepali (F = 11.59; R2 = .08) with p < .001. The R2 showed the strength of association between the predictor and dependent variables: Strong in social studies (.27), moderate in science (.22) and mathematics (.16), and weak in Nepali (.08). The standard error of estimate (SEE) showed the predictors would fall above or below 12.95 (science), 18.77 (mathematics), 12.47 (social studies), and 11.00 (Nepali) points from the regression line. Moreover, for all the significant results, except Dalit in science (rpart = .35) and Magar in mathematics (rpart = .36), the part correlation showed that teachers’ ethnicity had a small unique relationship with students’ test scores.
Table 3. Results of multiple regression on students’ science, mathematics, social studies, and Nepali test scores (N = 549).
Table 4. Regression coefficients, part correlation coefficients, and VIF of each predictor on science test score (N = 549).
Table 5. Regression coefficients, part correlation coefficients, and VIF of each predictor on mathematics test score (N = 549).
Table 6. Regression coefficients, part correlation coefficients, and VIF of each predictor on social studies test score (N = 549).
Table 7. Regression coefficients, part correlation coefficients, and VIF of each predictor on Nepali test score (N = 549).
The examination of regression coefficients in revealed that teacher-student ethnicity statistically significantly predicted students’ test scores only in mathematics and social studies (p < .05), although the test scores were higher for the matched group in all the subjects. The scores were β = 2.08 (science), β = 6.21 (mathematics), β = 7.43 (social studies), and β = 2.08 (Nepali) points higher for matched than for unmatched groups. Finally, there were mixed outcomes regarding students’ test scores associations with teachers’ ethnicity. According to , students taught by Dalit teachers boosted the only statistically significant findings in science(β = 11.61), which indicates the relative effectiveness of Dalit teachers in science instruction compared to other teachers in Nepal. In contrast, highlights that students taught by Chhetri, Dalit, Newar, and Magar educators scored higher in mathematics than the reference group. details that all teachers (except for Newar educators) were more effective at teaching social studies when compared to Brahmins, who are the majority of teachers. Lastly, details the outcomes related to Nepali, and results indicate that Newar teachers produced significantly higher test scores than the majority teachers.
Discussion
Using the multiple linear regression, this inquiry examined the relationship of teacher-student ethnicity matching and teachers’ ethnicity on eighth-grade Nepali students’ performance in science, mathematics, social studies, and Nepali, separately. The researchers examined statistical significance of the association between the predictor and dependent variables and observed the magnitude of relationships. We explain the findings below.
First, based on the overall outcome of the regression models in mathematics and social studies, we could not validate earlier research that saw no connection between teacher-student ethnicity matching and the test score gap. Banerjee’s (Citation2018) study on mathematics and reading and Driessen’s (Citation2015) review regarding objective assessment, in specific, had shown no association between ethnicity matching and enhanced academic performance of students even though the authors did not mention the adverse outcomes. The positive outcome of the association between teacher-student ethnicity matching and students’ learning in mathematics and social studies supports past research on the test score gap in the US.
Easton-Brooks’ study (Citation2013), for instance, showed improved performance of ethnic students in reading and mathematics due to teacher-student racial congruence. Likewise, Eddy and Easton-Brooks (Citation2011) found a positive impact on fifth-grade students’ mathematics scores because they were taught by at least a teacher of the same ethnic background. Studies also found that teacher-student ethnic association was beneficial even for students from a privileged background (Easton-Brooks, Citation2013; Motamedi & Stevens, Citation2018); hence, strong support for teacher-student ethnicity matching in relation to students from privileged backgrounds as well, particularly in situations where the majority becomes a minority. However, there is little information to infer if positive bias could exist in school contexts where ethnicity and caste could be used to stereotype marginalised students and teachers (Khanal, Citation2014).
It is also important to note that due to layers of discrimination and teachers’ vulnerabilities of being stereotyped by teachers of dominant groups (Khanal, Citation2014), whether minority teachers were fully open to engaging with students of their backgrounds is difficult to prove in the context we explored. So, it is vital to dig deeper into ethnicity-based biases and how they complicate the educational outcomes. Until that happens, we can rely on studies showing the positive bias of minority teachers for minority students (Glock & Kleen, Citation2019; Hue & Kennedy, Citation2014; Kleen et al., Citation2019) and vice versa (Cherng & Halpin, Citation2016). Presumably, such bias is warranted to raise self-esteem among minority students (Howard, Citation2010) and aids teachers in fostering learning environment that supports students’ learning and maturation.
In a more recent study, Yarnell and Bohrnstedt (Citation2018) confirmed the positive impact on African American male students’ reading achievement when paired with teachers of the same sex and racial background. Likewise, African American female students’ reading scores were enhanced when teachers of the same sex and racial backgrounds had taught them. Hence, while the overall moderate to strong magnitude of the association found in this study can be used to conclude that ethnicity matching is associated with increased test outcomes in mathematics and social studies, more research may provide insight into students’ achievement in other subjects if gender and ethnic clustering is used. Moreover, the gender-ethnic relationship was observed among US teachers and students, thus research could be advanced by considering this model within an international context.
Second, excluding science, students taught by Brahmin performed significantly lower than students taught by teachers of other ethnicities. Thus, these researchers noticed strong student performance associated with teachers from marginalised backgrounds. First, the case of Dalit in science is particularly remarkable. Students taught by Dalits performed better than the students taught by Brahmins and other groups. It is important to note that schooling is a new experience for the Dalit community due to centuries of domination. However, as shown in this study, Dalits can be the most effective teachers given the opportunity to teach. The mathematics and social studies cases were also unique as students taught by non-Brahmins scored higher than those taught by Brahmin in general, indicating the importance of an ethnically diverse teaching force. So, our research supports earlier findings that minority teachers are beneficial to all students and are key to redressing systemic educational inequities (Easton-Brooks, Citation2013; Motamedi & Stevens, Citation2018).
Limitations
This study should be considered with several limitations. First, the current data was insufficient to look at all students representing various ethnic backgrounds due to the lack of ethnic variety and the low representation of minority teachers across multiple subjects from where the current data was derived. A second limitation is using teacher-student dyads from eighth-grade year only; it would be more rigorous to pair teachers-students from the fifth-grade through the eighth-grade to measure the correlation and causality of ethnic matching and academic outcomes over time. Third, teacher characteristics such as subject-specific qualifications, age, training, and gender could play essential roles in establishing relationships with students and trigger students’ motivation for learning which this analysis did not consider. To overcome the limitations described thereof, future research should explore a national dataset to secure larger samples of teachers and students from all ethnic backgrounds. This is critical because of the shortage of teachers from many ethnic minority backgrounds, and a national dataset will increase the sample size of these underrepresented teachers. This will increase the number of ethnically matched teacher-student dyads enabling more robust analysis, including interaction effects across ethnic categories. A national dataset must however include variables that can be used as controls like gender and years of experience.
Conclusion
The present results were compelling and informative, yet this line of inquiry has some challenges. Research on teacher-student ethnicity matching requires proportional representation of minority teachers to minority students to create large enough teacher-student clusters and comparison samples. In the US, the teacher-student ethnicity matching was initially postulated to redress test scores and other educational gaps between White American students and students of colour. Presently, over 80% of teachers in America are White Americans, although more than half of the students in public schools are from culturally diverse backgrounds. This student-teacher cultural mix-matching is theorised as a critical factor in the ongoing achievement disparities in US education (Howard, Citation2010). Globally, many nations face demographic shifts due to internal and cross-national migration driven by war, the globalisation of economies, and political instability. Such migration and immigration patterns present new cultural tensions and further strain nations’ pre-existing racial and ethnic tensions. Therefore, educational systems must respond inclusively to support both immigrant and culturally underrepresented students and teachers within the unique cultural and political contexts and the power structures of each society. One measure that could prove beneficial is recruiting and retaining more teachers that represent students’ ethnic, cultural, and linguistic backgrounds. In this regard, teachers from minority backgrounds can function as academic, social, and cultural resources for minority students and communities. Furthermore, diverse teachers provide leadership to challenge stereotypes or school ingrained biases that discourage minority students from fully engaging in school. Also, any diversification in the teaching force can contribute to protecting marginalised students from cultural alienation, while providing them with opportunities to hone and preserve their “funds of knowledge,” which is the historically transferred and culturally rooted knowledgebase of groups of people essential for a successful life (Moll, Amanti, Neff, & Gonzalez, Citation1992, p. 133).
Beside the academic and leadership potentials described above, minority teachers can add to heterogeneity in ideas and expertise, and function as key resources to support the social, emotional, and academic needs of minority students. Additional merits of minority teachers are described in Driessen (Citation2015): Act as role models of all students; become contact points among school, parents, and students; instil a sense of inclusion among parents and students, and enhance parental school involvement; diagnose student issues and take appropriate actions to address them; become resources for majority teachers to deal with minority issues; prepare students to deal with complex life issues that they might face in a multicultural society; create a sense that minority teachers are equally important; minimise teacher shortage. Moreover, minority teachers are useful in helping schools actualise culturally relevant teaching strategies, skills, and activities (Hue & Kennedy, Citation2014; Ladson-Billings, Citation1994).
To conclude, minimising the educational gaps is a critically important issue that Nepal needs to address for its overall educational, social, political, and economic development. In Nepal, ethnic marginalisation has been normalised for centuries, but the country has sought to create a more just and fair society in recent decades. We support the call for Nepal to consider the educational outcomes of ethnic minorities as a critical measure of progress. But the findings from the present inquiry also requires that Nepal considers the progress made in preparing, hiring, retaining, and prompting teachers from ethnic minority groups as an equally critical measure of progress. The present research explored ethnicity matching as an emerging line of research that could prove helpful in establishing a more equitable education system for the marginalised youths and teachers in Nepal. While our model yielded a positive relationship of ethnic matching and teachers’ ethnic diversity on academic outcomes, the outcomes of the association still varied due to mixed results. Thus, we recommend a national sample with multi-grade level teacher-student couplings to explore correlations and ultimately causal factors related to ethnic matching. Additionally, we caution against sweeping global conclusions concerning the nature and nuances of ethnic matching because the experiences of ethnic groups, for example, in the US, are very different from the shared histories and experiences that create ethnic inequality in other regions of the world. Overall, we can conclude that there is an ethnic advantage when matching teachers and students from similar cultural backgrounds. This ethnic advantage makes educators from historically marginalised ethnic groups and caste within Nepal a critical national resource that could yield advantages to a nation seeking equity and justice.
Acknowledgments
The first author acknowledges the feedback of Dr. Lynne M. Walters as his graduate school advisor. However, no other persons than the two authors were involved in preparing this article.
Disclosure statement
For data collection, the first author received $500 research grant from the College of Education and Human Development at Texas A&M University.
Correction Statement
This article has been corrected with minor changes. These changes do not impact the academic content of the article.
Additional information
Funding
Notes on contributors
Puskar R. Joshi
Puskar R. Joshi is a doctoral student in educational psychology. A graduate of Columbia University, The University of Manchester, and Pokhara University, Puskar was a consultant for a school project to improve the academics of a public school in Solukhumbu, Nepal. Before joining the project, he was an academic coordinator in a private school in Bhaktapur, Nepal. Even before, he was a master-trainer at the Secondary Education Development Centre, Nepal. His research interests include education policy; education for the minority and immigrant populations; bilingual, multilingual, and multicultural education.
Marlon C. James
Marlon C. James is an Assistant Professor of Multicultural Education at Texas A&M University. He earned a Doctorate in Curriculum and Instruction with foci in urban and multicultural education from Texas A&M University (2008) as the 2005 Ph.D. Diversity Research Fellow. Dr. James specialises in research-based applications of adult learning, urban teacher development, and multicultural education. His most recent project, Urban Student Teacher Advanced Residency, is a yearlong residency, and boasts a 96% retention rate in urban schools. Dr. James’ research focuses on redressing inequities in US schools, and recently he has increased focus on racial/ethnic inequalities in international contexts.
References
- Banerjee, N. (2018). Effects of teacher-student ethnoracial matching and overall teacher diversity in elementary schools on educational outcomes. Journal of Research and Childhood Education, 32(1), 94–118.
- Bennett, L., Dahal, D. R., & Govindasamy, P. (2008). Caste, ethnic and regional identity in Nepal: Further analysis of the 2006 Nepal demographic and health survey. Macro International. Retrieved from https://dhsprogram.com/pubs/pdf/FA58/FA58.pdf
- Byrne, B. M. (2010). Structural equation modeling with AMOS: Basic concepts, applications, and programming (2nd ed.). New York: Routledge.
- Central Bureau of Statistics. (2012). Nepal population and housing census 2011: National report. Retrieved from https://unstats.un.org/unsd/demographic-social/census/documents/Nepal/Nepal-Census-2011-Vol1.pdf
- Cherng, H. S., & Halpin, P. F. (2016). The importance of minority teachers: Student perceptions of minority versus White teachers. Educational Researcher, 45(7), 407–420.
- Cohen, J. (1988). Statistical power analysis for the behavioral sciences (2nd ed.). New York: Laurence Erlbaum Associates.
- Driessen, G. (2015). Teacher ethnicity, student ethnicity, and student outcomes. Intercultural Education, 26(3), 179–191.
- Easton-Brooks, D. (2013). Ethnic-matching in urban schools. In H. R. Milner & K. Lomotey (Eds.), Handbook of urban education (1st ed., pp. 97–113). New York: Routledge.
- Eddy, C. M., & Easton-Brooks, D. (2011). Ethnic matching, school placement, and mathematics achievement of African American students from kindergarten through fifth-grade. Urban Education, 46(6), 1280–1299.
- Egalite, A. J., & Kisida, B. (2018). The effects of teacher match on students’ academic perceptions and attitudes. Educational Evaluation and Policy Analysis, 40(1), 59–81.
- Ford, M. (2012). Achievement gaps in Australia: What NAPLAN reveals about education inequality in Australia. Race, Ethnicity and Education, 16(1), 80–102.
- Glock, S., & Kleen, H. (2019). Attitudes toward students from ethnic minority groups: The roles of preservice teachers’ own ethnic backgrounds and teacher efficacy activism. Studies in Educational Evaluation, 62, 82–91.
- Howard, J. (2010). The value of ethnic diversity in the teaching profession: A New Zealand case study. International Journal of Education, 2(1), 1–22.
- Hue, M., & Kennedy, K. J. (2014). Creating culturally responsive environments: Ethnic minority teachers’ constructs of cultural diversity in Hong Kong secondary schools. Asia Pacific Journal of Education, 34(3), 273–287.
- Joshi, P. R., Digari, S., & James, M. C. (2022). The difference a female teacher makes: Analysis of girls’ school achievement in Nepal. Educational Studies doi:10.1080/00131946.2022.2051032.
- Khanal, D. (2014). Children from the Dalit community in rural Nepal: A challenge to inclusive education. International Journal of Inclusive Education, 19(7), 710–720.
- Kleen, H., Bonefeld, M., Glock, S., & Dickhauser, O. (2019). Implicit and explicit attitudes toward Turkish students in Germany as a function of teachers’ ethnicity. Social Psychology of Education, 22(4), 883–899.
- Ladson-Billings, G. (1994). The dreamkeepers: Successful teachers of African American children (1st ed.). San Francisco: Jossey-Bass.
- Lindsay, C. A., & Hart, C. M. D. (2017). Exposure to same-race teachers and student disciplinary outcomes for black students in North Carolina. Educational Evaluation and Policy Analysis, 39(3), 485–510.
- Mertler, C. A., & Vannatta, R. A. (2013). Advanced and multivariate statistical methods (5th ed.). Glendale: Pyrczak Publishing.
- Ministry of Education, Science & Technology. (2018). At a glance: Education in figures 2017. Nepal. Retrieved from https://moe.gov.np/assets/uploads/files/Education_in_Figures_2017.pdf
- Moll, L. C., Amanti, C., Neff, D., & Gonzalez, N. (1992). Funds of knowledge for teaching: Using a qualitative approach to connect homes and classrooms. Theory into Practice, 31(2), 132–141.
- Motamedi, J. G., & Stevens, D. (2018, November 6). Human resources practices for recruiting, selecting, and retaining teachers of color. REL Retrieved from https://ies.ed.gov/ncee/edlabs/regions/northwest/pdf/human-resources-practices.pdf?
- Nepal Law Society. (2015). The constitution of Nepal 2015 ( Unofficial translation). Retrieved from http://extwprlegs1.fao.org/docs/pdf/nep155698b.pdf
- Neupane, P. (2017). Barriers to education and school attainment––Evidence from secondary schools in rural Nepal. International Education Studies, 10(2), 68–83.
- Pang, V. O. (2017). Diversity and equity in the classroom (1st ed.). Boston: Cengage Learning.
- Panthi, R. K., & Belbase, S. (2017). Teaching and learning issues in mathematics in the context of Nepal. European Journal of Educational & Social Sciences, 2(1), 1–27.
- Poudel, L. N., Thapalia, T., & Khanal, P. (Eds.). (2015). Nepal: Report on national assessment of student achievement for grade 8. Sanothimi, Bhaktapur: Education Review Office.
- Savada, A. M. (Ed.). (1991). Nepal: A country study. Washington, DC: GPO for the Library of Congress. http://countrystudies.us/nepal/31.htm
- Sob, D. (2012). The situation of the Dalits in Nepal: Prospects in a new political reality. Voice of Dalit, 5(1), 57–62.
- Stash, S., & Hannum, E. (2001). Who goes to school? Educational stratification by gender, caste and ethnicity in Nepal. Comparative Education Review, 45(3), 354–378.
- Subedi, M. (2016a). Caste/ethnic dimensions of change and inequality: Implications for inclusive and affirmative agendas in Nepal. Nepali Journal of Contemporary Studies, 16(1–2), 1–16.
- Subedi, M. (2016b). Caste in South Asia: From ritual hierarchy to politics of difference. Politeja, 1(40), 319–339.
- Yarnell, L. M., & Bohrnstedt, G. W. (2018). Student-teacher racial match and its association with black student achievement: Exploration using multilevel structural equation modelling. American Education Research Journal, 55(2), 287–324.
- Yeh, S. S. (2016). Contradictions resolved: An analysis of two theories of achievement gap. Teachers College Record, 119(6), 1–42.
Appendix.
Figure A1. Plot of residuals as a function of predicted scores in science
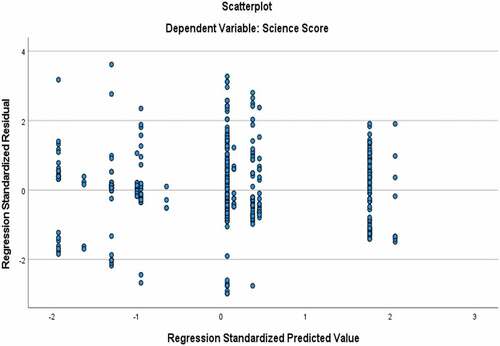
Figure A2. Plot of residuals as a function of predicted scores in science
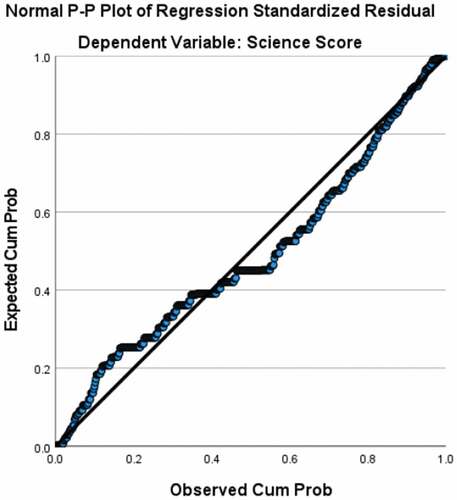
Figure A3. Plot of residuals as a function of predicted scores in mathematics
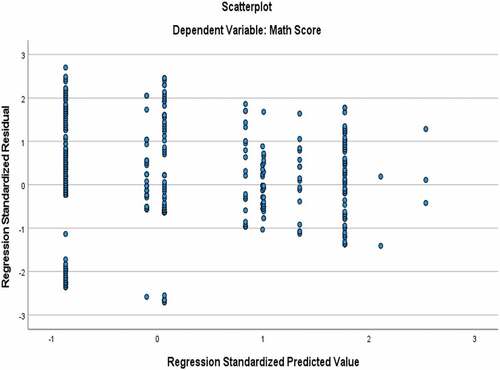
Figure A4. Plot of residuals as a function of predicted scores in mathematics
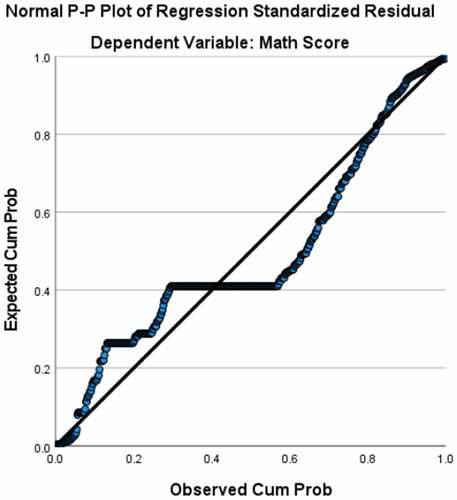
Figure A5. Plot of residuals as a function of predicted scores in social studies
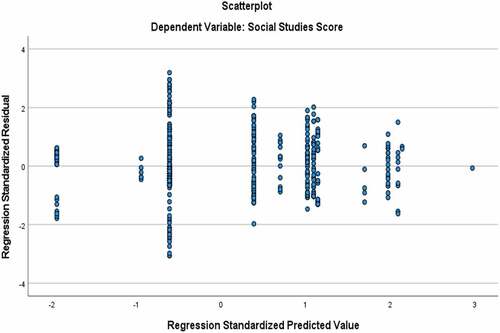
Figure A6. Plot of residuals as a function of predicted scores in social studies
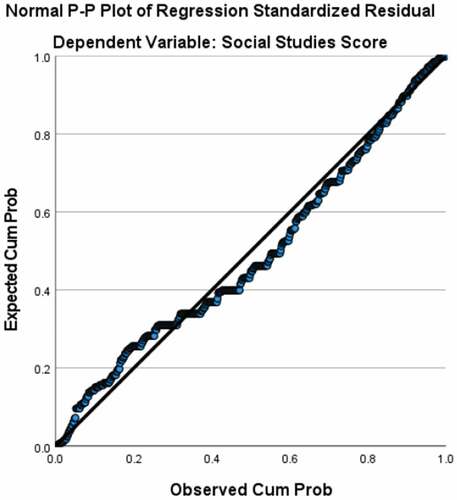
Figure A7. Plot of residuals as a function of predicted scores in Nepali
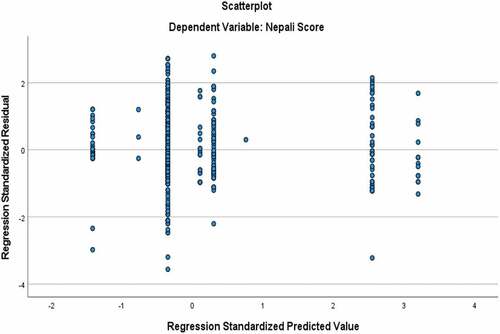
Figure A8. Plot of residuals as a function of predicted scores in Nepali