
 ?Mathematical formulae have been encoded as MathML and are displayed in this HTML version using MathJax in order to improve their display. Uncheck the box to turn MathJax off. This feature requires Javascript. Click on a formula to zoom.
ABSTRACT
Understanding teachers’ conceptions of assessment is a key objective in supporting assessment practices that lead to improved learning outcomes. Thus, inventories capable of identifying teachers’ assessment conceptions are important. The Teachers Conceptions of Assessment (TCoA) inventory was an early and influential measure of teacher assessment conceptions, but replication studies have shown that the model may be affected by policy and practice context. In the present study, a Swedish adaptation of the TCoA was administered twice, 18 months apart. A sample of 249 teachers were matched across the 2 time-points and their self-reported scores were analysed with confirmatory factor analysis and invariance testing. With good correspondence to the data, six of the nine factors in the TCoA were completely replicated and one factor was partially replicated. The model had sufficient similarity between time points to permit mean score comparisons, which were largely equivalent between times. The study indicates that the Swedish Teacher Conceptions of Assessment adaptation can be used reliably in Swedish primary and lower secondary schools as measure of teacher conceptions of the uses of assessment.
Introduction
Given the importance of teacher beliefs as predictors of practice (Fives & Buehl, Citation2012), knowing how teachers conceive of assessment seems to be essential in understanding their role in implementing assessment practices that enhance learning outcomes. If teachers conceive of assessment purely in terms of summative evaluation of schools or teachers, it is unlikely that they will implement assessment practices with the purpose of improving learning. In contrast, teacher conceptions that assessment can be used to improve learning would be beneficial for implementing formative assessment practices. Such practices include monitoring student learning in order to adapt classroom practice in accordance with student learning needs (Black & Wiliam, Citation2009). Therefore, inventories capable of identifying teachers’ assessment conceptions are needed.
The Teachers Conceptions of Assessment (TCoA; G. T. L. Brown, Citation2003) inventory, developed in New Zealand, was an early and influential measure for exploring teacher thinking about the purposes of assessment. It has been evaluated in multiple educational jurisdictions and languages leading to the understanding that policy and practice contexts influence the responses (G. T. L. Brown et al., Citation2019). To date no study in Sweden has been conducted.
The aim of this paper is to contribute to that gap by examining in which ways the New Zealand model replicates in the Swedish context. We do so with a repeated measure invariance study of Swedish TCoA responses. Their responses produce partial replication of previously reported results from other low-stakes contexts, supporting the importance of ecological rationality in understanding teacher’s conceptions of assessment.
Formative assessment in classroom contexts
Systematic literature reviews and meta-analyses have shown that formative assessment can improve student achievement (e.g. Black & Wiliam, Citation1998; Hattie, Citation2009; Lee et al., Citation2020; Palm et al., Citation2017). Formative assessment that is aligned to curricular objectives and goals requires teachers to collect information about student progress, difficulties, and successes to plan instruction, design activities, ask questions, and provide feedback to learners (Bloom et al., Citation1981). Performance data can be interactions in a classroom (e.g. question and answer) but also includes more formal diagnostic testing (G. T. Brown & Hattie, Citation2012) or analysis of errors made in classroom or home practice (Bejar, Citation1984). From these kinds of performance data teachers can formatively make appropriate adjustments to their classroom instruction and to student learning activities so they are tailored to the students’ learning needs (Lai & Schildkamp, Citation2016).
Naturally, this approach to assessment requires resources (i.e. assessments that diagnose needs and time to plan responses), policies that prioritise using assessment formatively rather than solely for administrative or summative purposes, and teacher commitment to using assessment formatively for improvement. Further, considering the importance of the teacher’s active role in using performance data in this way, it is likely that teacher beliefs about assessment and feedback matter to the efficacy of these processes.
Teacher conceptions of assessment
Ajzen’s (Citation1991) Theory of Planned Behaviour (TPB) identifies the importance of teachers’ beliefs and attitudes towards any phenomenon (in this case, assessment) as essential to understanding their intentions and actions. TPB also points to the importance of social norms and perceptions of behavioural control as predictors of intentions, behaviours, and outcomes. A substantial body of evidence highlights the importance of understanding teachers’ conceptions of assessment, as these are linked to their approaches to assessment and influence students’ learning and outcomes (Barnes et al., Citation2015; DeLuca et al., Citation2019; Fives & Buehl, Citation2012). Teachers’ conceptions of assessment shape how they assess students and the conclusions and interpretations they draw (Cheng et al., Citation2010; Hill & Eyers, Citation2016). Research also emphasises the significant impact of assessment conceptions on teachers’ decisions and practices (G. T. L. Brown, Citation2008; Opre, Citation2015; Vandeyar & Killen, Citation2007). This aligns well with Fives and Buehl (Citation2012) model in which teacher beliefs act as filters, frames, and guides to cognitive resources that impact their actions. Of course, teacher beliefs about the proper role of assessment are not universal; they are context bound by the policy and practice framework in which they are employed (Bonner, Citation2016; G. T. L. Brown & Harris, Citation2009; Fulmer et al., Citation2015).
Research into teacher beliefs about assessment indicates that teachers have multiple conceptions of assessment with varying degrees of intensity (G. T. L. Brown, Citation2008). The focus of a belief (e.g. the type of assessment [formal vs. informal] and the object of evaluation [teacher/school vs. student]) matters to how strongly a conception of assessment is endorsed or rejected, and even to whether that conception is present in teachers’ conceptions of assessment. For example, in both New Zealand and Queensland, Australia, primary school teachers tended to not agree as much as secondary teachers did with the purpose of holding students accountable through assessment (G. T. L. Brown, Citation2011; Brown, Lake, et al., Citation2011). Arguably, this reflects the greater use of assessment among adolescents to prepare them for entry to further education or adulthood. Thus, because of the multiple purposes and uses of assessment, teachers have multiple and complex attitudes or conceptions in response to those uses within a jurisdiction.
It appears teachers are aware of formative and summative uses of assessment and their attitudes towards such uses vary depending on whether the student or the school is the focus of attention (Harris & Brown, Citation2009). The use of student assessment to evaluate schools and teachers especially creates tensions and negative responses from teachers (Bonner, Citation2016; Nichols & Harris, Citation2016). Teachers in high-stakes accountability systems, where public examinations of student achievement have considerable acceptance, seem to view assessment for making students accountable a positive aspect for improving both student learning and character (G. T. L. Brown et al., Citation2009; Brown, Hui, et al., Citation2011). The relative strength of these varying conceptions appears to be ecologically rational in that teachers in general endorse the policies and purposes that apply to their level of employment.
Hence, we should expect that Swedish teachers’ responses to the TCoA to reflect broad cultural values and specific educational policies about the nature, purpose, and practice of assessment.
The Swedish context
According to the collaborative European Values Study and World Values Survey spanning 2005 to 2022 (EVS/WVS, Citation2022), Sweden exhibits a distinct inclination towards secular-rational and individualistic values, emphasising equality, individual freedom, and well-being. This sentiment is reinforced by the six-dimensional Index of National Culture (INC) developed by Hofstede et al. (Citation2010). Within the educational context, these values manifest in the Swedish system by granting teachers significant autonomy to interpret and implement the objectives outlined in the national curriculum. This extends to their ability to select appropriate teaching methods that align with the overarching goals of fostering student achievement (Helgøy & Homme, Citation2007).
The egalitarian ethos prevalent in Sweden extends to the students. Instances of discrimination among students, such as the creation of specialised classes or educational tracks for gifted or underperforming students, are infrequent (Hofstede et al., Citation2010; Hofverberg & Winberg, Citation2020). Practices like public evaluation and ranking of students based on academic achievement are generally considered unacceptable within the Swedish educational culture.
Swedish teachers in compulsory school (school years 1–9) commonly follow their students during one of three stages, each stage consisting of 3 years (Years 1–3, 4–6 or 7–9). Teachers in Years 1–6 are generalists, teach most subjects, and mainly teach one class in any given year. Teachers in Years 7–9 are subject specialists and only teach a few subjects. As a consequence, they most often teach students from different classes and school years in any given year. The Swedish curriculum adopts a goal-oriented approach, incorporating national standards for student achievement in Years 3, 6 and 9 (corresponding to ages 9, 12 and 15). While achievement grades are assigned in Years 6–9, the most significant implications lie in Year 9, influencing admission to upper secondary school. Grading is criterion-referenced, allowing multiple students to receive the same grade as long as they meet the established standards. Legally, the responsibility for providing adequate resources for education and conducting systematic evaluations lies with the municipality in which the school is situated, as stipulated by The Education Act (SFS Citation2010:800, 2010, p. 800, ch. 4 § 3). To support schools and teachers, the National Agency for Education (NAEd) offers national screening materials, assessment support, and standardised national tests. These tools serve diverse purposes, from informing decisions about support and guiding adaptations in teaching to providing aggregated estimates of student achievement at the school or system level for grading consistency and trend analysis (Skolverket [National Agency for Education], Citation2020).
National standardised tests (NSTs) are mandatory in Years 3, 6, and 9 and play a pivotal role in grading students in Years 6–9, although teachers are obligated to also consider other available information about students’ knowledge and skills in their evaluation process (SFS Citation2010:800, 2010, ch. 10, § 20a). Consequently, the NAEd advises teachers to employ diverse assessment situations for both formative and summative purposes (Skolverket [National Agency for Education], Citation2022), granting teachers across all school levels the autonomy to design and implement their own classroom assessments.
Despite limited research on Swedish teachers’ views on assessment and feedback, insights from Helgøy and Homme’s (Citation2007) study, involving approximately 70 teachers and principals across seven schools in four major cities in Sweden and Norway, indicate that Swedish teachers, more so than their Norwegian counterparts, perceive national standardised tests as valuable tools for grading and enhancing teaching. In contrast to Norwegian teachers, Swedish educators do not view these tests as constraining their autonomy in interpreting national goals or organising their teaching methods to align with those goals.
Thus, we might expect a tendency among Swedish teachers to embrace a commitment to improvement-oriented conceptions of assessment, while also harbouring positive attitudes towards formal, standardised testing, acknowledging its possible uses for formative purposes. Furthermore, it is conceivable that teachers in closer proximity to the Year 9 decision point for entry into senior high school may demonstrate somewhat different belief priorities compared to their counterparts at the early stages of schooling.
Methods
This study used self-administered, self-reported survey inventories administered with a forced-choice ordinal agreement response scale at two time-points separated in time by 18 months to check model replicability over time (reliability). Analysis was done within the multiple indicators, multiple causes (MIMIC; Jöreskog & Goldberger, Citation1975) framework in which each survey item response is explained by a latent factor and a residual capturing the universe of unexplained variance. Further, each latent construct is manifested by multiple indicators. This study uses confirmatory factor analysis and invariance testing to establish the structure of responses and their stability over time. Furthermore, the study examines whether the strength of conceptions differed depending on teacher sex, possession of a teacher degree, length of teaching experience, or teaching stage. Teaching stage was chosen as a variable instead of schoolyear level since teachers in Years 1–6 will not teach the same schoolyear two consecutive years in a row, and teachers in Years 7–9 will teach students from different schoolyears the same year. Given the significant focus on the purpose and design of assessment within Swedish teacher education, it is reasonable to expect that certification status or possession of a teaching degree will influence teachers’ conceptions of assessment (TCoA). Similarly, teachers’ real-world experiences with assessment and its consequences are likely to shape their understanding and perceptions of assessment. Given the inconclusive previous results on the role of gender in teachers’ conceptions of assessment, albeit with a slight tendency towards studies finding no gender effects, we also investigated whether gender differences could be identified in the Swedish context.
Participants
A total of 461 teachers working between years 1 and 9 in a northern city in Sweden responded to the first wave of the survey. This is a 62% response rate from the municipality. A similar size group responded in the second wave of the survey held approximately 18 months later. After restricting the sample to those with complete data in both waves or those with <10% missing responses, 259 participants could be matched (). Before modelling began, multivariate outliers were identified with Mardia’s kurtosis method (Mardia, Citation1970). The cut score for the resulting Mahalanobis d2 statistic was set at p = .001 for df equal to the number of variables in the model. Appendix A provides details of identification and sensitivity analysis for removal of 10 multivariate normality outliers. Removal of outliers at Time 1 made fit worse (|ΔAIC| = 15.69), indicating keeping the outliers is better. In contrast, removal of outliers created a superior fit at Time 2 (|ΔAIC| = 27.41). Since ΔAIC = Δ χ2 (Sterba & Pek, Citation2012), a statistical significance test of these two values with 10 degrees of freedom change had p = .11 and .002, respectively. This indicated removing outliers had a not statistically significant effect on Time 1 but a statistically significant effect at Time 2. To ensure comparability between data sets, all 10 outliers were removed to make matched data sets (N = 249).
Table 1. Teacher demographic characteristics.
Consistent with school employment statistics, nearly with more than three factors, with.
of the sample were women and a similar proportion had a bachelor’s degree. Nearly ⅔ of the sample had more than 10 years teaching experience. A third taught Years 1–3, and nearly the same proportion taught in Years 4–6 and Years 7–9. Teachers indicated their specialist teaching subjects, with the option to indicate more than one subject. However, it is not possible to separate teachers into separate teaching subjects since in Y1–6 teachers are generalists teaching multiple subject areas. This means that, without studying exclusively teachers working above Year 6, it is not possible to identify possible subject or discipline-related differences.
Teachers conceptions of assessment (TCoA)
The Teachers Conceptions of Assessment (TCoA; G. T. L. Brown, Citation2003) inventory probes three dominant perspectives of assessment: (1) improvement of both teachers’ instruction and students’ learning on the grounds that assessment provides dependable diagnostic information; (2) demonstrating through assessment results that schools and students have fulfiled expectations; and (3) assessment is irrelevant or ignored because it is inaccurate or has bad effects (G. T. L. Brown, Citation2004). The New Zealand model comprises four correlated factors (i.e. Improvement, Irrelevance, School Accountability, and Student Accountability) and the first two factors had multiple subordinate factors (i.e. assessment is reliable, assessment is descriptive, assessment helps teachers, and assessment helps students within the improvement factor; assessment is bad, assessment has error, and assessment is ignored within the irrelevance factor). Each of the nine factors had three items.
The TCoA was developed in the low-stakes assessment context of New Zealand with primary school teachers and achieved replication with primary teachers in Queensland, Australia (G. T. L. Brown, Citation2006), and secondary teachers in New Zealand (G. T. L. Brown, Citation2011). Previous studies show that teachers endorse the improvement function, reject the irrelevance and assessment for school accountability conceptions, and have ambivalent views towards student accountability, with only secondary school teachers giving a somewhat positive endorsement of assessment for student accountability (G. T. L. Brown, Citation2017).
Nonetheless, the societal norms around high- vs. low-stakes uses of educational assessment impact teacher conceptions of assessment. Previous research comparing the TCoA survey results in Cyprus, Queensland, India, Hong Kong, China, Egypt, Spain, and Ecuador found that the New Zealand model was replicated only among primary teachers in Queensland (G. T. L. Brown et al., Citation2019), a context that shared the English language, an assessment for learning pedagogy, and low-stakes consequences for assessments. Hence, although the present survey uses primarily primary school teachers in a low-stakes assessment for learning context, it is still likely that linguistic and policy factors may necessitate modifications in the statistical model representing teachers’ conceptions of assessment to gain close correspondence with the data.
Survey design
The instruments were translated into Swedish by a translator, prioritising functional equivalence rather than literal equivalence. In contrast to back-translation which produces literal equivalence, functional equivalence prioritises similarity of meaning and well-constructed expression in the new language (International Test Commission, Citation2018). The translation was evaluated independently by three bilingual researchers who reported that the Swedish version had strong functional equivalence to the English and reflected appropriately assessment practices in Swedish terms.
A member checking (Tong et al., Citation2007) was conducted in two interview groups to find out how the teachers perceived certain items and understand the reasons why they answered the way they did. Ten teachers were recruited on a volunteer and convenience basis to participate. At separate occasions, two-group interviews (n = 4 and 6, respectively) were led by two of the authors. The interviews were focused on two items that indicated ambiguous teacher interpretation during analysis. In the interviews, the teachers were first given time to think individually about each issue and then shared their thinking in a joint discussion. The teachers had completed the survey, but their responses had been anonymous and so they were commenting on aggregate data results to which they had contributed. In these 1-hour discussions, we explored the respondents’ interpretations and views of the item content. The authors took field notes and conversations were audio-recorded and transcribed. The transcripts and field notes were analysed for themes by authors 2 and 5.
Items were presented in jumbled order. Participants responded using a positively packed, 6-point agreement scale. This type of scale has two negative options (Strongly Disagree and Moderately Disagree, scored 1 and 2 respectively) and four positive options (Slightly Agree, Moderately Agree, Mostly Agree and Strongly Agree, scored 3 to 6, respectively). This approach gives greater ability to discriminate the degree of positivity participants hold for positively valued statements and is appropriate when participants are likely to endorse statements (G. T. L. Brown & Shulruf, Citation2023). Hence, in circumstances when participants are expected to respond positively to a stimulus (e.g. teachers responding to a policy expectation), giving them more choices in the positive part of the response continuum produces good results.
Analysis
After deleting participants with >10% missing responses, and thereafter testing whether missing data were Missing Completely at Random (MCAR), the remaining missing values were imputed with the expectation maximisation algorithm (Dempster et al., Citation1977). This process creates a data set with no missing values for variance-covariance structural analysis. A statistically not significant result for Little’s (Citation1988) Missing Completely at Random (MCAR) test or for the normed chi-square alternative (Wheaton et al., Citation1977) shows that the distribution of missing responses is completely random. At time 1, missing values ranged from none to 1.9%, with Little’s MCAR test not statistically significant at the normed chi-square level (χ2 = 512.67, df = 455, p = .03; χ2/df = 1.13, p = .29). At time 2, missing values ranged from none to 2.3%, with Little’s MCAR test not statistically significant at the normed chi-square level (χ2 = 728.86, df = 566, p < .001; χ2/df = 1.29, p = .26). Hence, the missing value imputation was accepted as a valid representation of teacher intended responses.
Just over half of the variables (30/54; 55%) violated normality for skewness (z > 3.29; Kim, Citation2013), while just six variables exceeded normality for kurtosis. All variables were corrected using the Box-Cox normalisation method implemented in Courtney and Chang (Citation2018) normal R shiny app.Footnote1 With this adjustment, normal theory covariance structure analysis was permissible (Bentler & Dudgeon, Citation1996).
While it is conventional to approach a new model with new data using exploratory techniques, in this case, there was a strong conceptual model that could legitimately be expected to have validity in this new context and sample. Consequently, we tested the original TCoA model for fit to the new data using confirmatory factor analysis, taking a true confirmatory approach. Our goal was to test if it were possible to recover the original model in order to permit comparison across samples, languages, and jurisdictions. In the event, a CFA model is admissible, but poorly fitting, modification indices can be consulted to identify items that violate simple structure (Revelle & Rocklin, Citation1979) or independence of residual assumptions (Barker & Shaw, Citation2015). Items with weak loadings (i.e. <.30; Bandalos & Finney, Citation2010) or with strong violation of model assumptions (i.e. loading on non-intended factors or item residuals) are good candidates for deletion.
Fit of CFA models is established by inspection of multiple fit indices (Hu & Bentler, Citation1999). Because the chi-square measure of discrepancy between a model and its underlying data is sensitive to sample size and model complexity, statistically non-significant values for the normed chi-square (i.e. χ2/df) provide evidence for correspondence between a model and its data (Wheaton et al., Citation1977). Further evidence for non-rejection of a model arises when the comparative fit index (CFI) is >.90 and the root mean square error of approximation (RMSEA) is <.08. However, both the CFI and RMSEA indices are sensitive to models with more than three factors, with the CFI tending to reject and the RMSEA tending to not reject under those conditions (Fan & Sivo, Citation2007). While the standardised root mean residual (SRMR) also varies with model conditions, that index can be relied upon even in large models with non-normal data. Although the sample SRMR will produce values greater than the population SRMR, suggesting that the model fits the data more poorly than it actually does (Maydeu-Olivares et al., Citation2018). Thus, greater reliance is put on the gamma hat >.90 and the standardised root mean residual (SRMR) <.08 because these are robust against sample size, model complexity, and model misspecification.
Scale reliability was estimated using the Coefficient H maximal reliability index, which is based on an optimally weighted composite using the standardised factor loadings (Hancock & Mueller, Citation2001). H >.80 provides strong evidence for the robustness of a scale.
To evaluate the impact of time on survey responses, invariance testing between two time-points was conducted. Nested invariance testing establishes if the item regression weights (i.e. metric equivalence) and intercept values (i.e. scalar equivalence) are equivalent across time. This method tests equivalence sequentially and stops if the additional constraint causes a change in the CFI index of more than .01 (G. T. L. Brown et al., Citation2017) or if a statistically significant result for the difference in chi-square, given the difference in degree of freedom, occurs. The equivalence of measurement weights is sufficient to meet requirements for creating and evaluating repeated scale scores over time (McArdle, Citation2007). However, if strict invariance is observed (i.e. equivalent weights at measurement and structural levels), we can conclude that the passing of 2 years did not change participant responses.
If at least metric invariance over time is achieved, factor means can be calculated by averaging the raw score for each item contributing to the factor. This unrefined method preserves the participant’s response scale metric producing easy interpretation of scores and is appropriate when simple structure (i.e. items belong to only one factor) is present (DiStefano et al., Citation2009). Differences in factor scores across time points were evaluated under the null hypothesis that there is no difference over time for each individual factor. Similarly, we evaluated individual hypotheses positing no differences between men and women, teachers at different career stages, those with or without a teaching degree, or those with varying levels of teaching experience. Since we did not test a joint hypothesis – namely, that there would be no differences for any of the factors across time points or demographic groups – no correction for multiple comparisons was required (Rubin, Citation2021).
CFA and invariance analyses were conducted in IBM SPSS Amos v29 (Amos Development Corp, Citation2022). Because 6-point ordinal scales function similarly to continuous variables (Finney & DiStefano, Citation2006), maximum likelihood estimation was used.
Results
Model development
Based on the Time 1 data, the original four-factor, hierarchical model described above (Panel A, ) was not admissible because the correlation matrix among the four main factors was not positive definite. Further, the Student Accountability factor had low prediction values loadings (i.e. <.30) for two items. Consequently, the whole factor was removed from the model. This produced an admissible but still somewhat poorly fitting model. Details of model development and items deleted are given in Appendix B.
Figure 1. Schematic model of New Zealand TCoA and Swedish TCoA results.
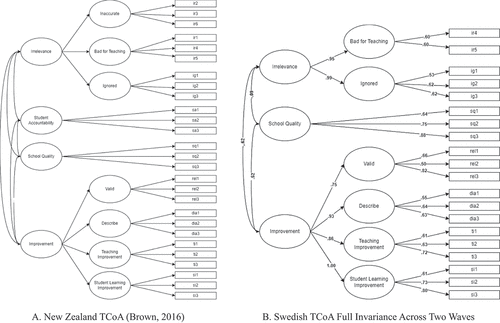
The Inaccuracy sub-factor in Irrelevance was removed because of strong violation of simple structure and two factors (i.e. Bad for Teaching and Student Improvement) had their residual values fixed to 0.005 to address negative error variance. This is permissible because the observed value was less than two times the standard error, meaning the true value was likely to be positive. Four of the Irrelevance items were removed for violating simple structure and independent residual assumptions. This left Irrelevance with two sub-factors (i.e. Assessment is Ignored and Assessment is Bad for Teaching).
In contrast, the hierarchical Improvement factor was fully replicated as four sub-factors each with three items. The School Accountability factor also was retained with its three items on assessment indicating school quality.
The Swedish TCoA model (Panel B, ) had 20 items in a correlated three-factor structure (i.e. Irrelevance, School Accountability, and Improvement), with four subordinate factors under Improvement and two subordinate factors for Irrelevance. Having established a highly similar model to the original model at Time 1, the Swedish TCoA model was tested in true confirmatory fashion with data from Time 2. This model had qualitatively acceptable to good fit indices at both time points (Time 1: χ2 = 319.23, df = 163, χ2/df = 1.96. p = .16; CFI = .89; gamma hat = .94; RMSEA = .062, 90%CI = .052–.072; SRMR = .063; Time 2: χ2 = 358.85, df = 163, χ2/df = 2.20, p = .14; CFI = .90; gamma hat = .93; RMSEA = .070, 90%CI = .060–.079; SRMR = .057) and this model was accepted as a good representation of Swedish teachers’ conceptions of assessment.
provides factors, items in both Swedish and English, scale statistics, and loadings for both time-points. Just three of the seven factors had Coefficient H values >.80, suggesting less than robust scale characteristics. Overall, the fit indices support acceptance of this multi-dimensional self-report measure.
Table 2. Swedish TCoA factors, items, item loadings, and scale statistics.
Invariance
The sequential testing of constraints, based on the change in CFI (i.e. ΔCFI range: .000–.005), indicated full equivalence. The fit of this two-group, constrained model was good, especially for the more robust normed chi-square, gamma hat, and SRMR indices (χ2 = 922.98, df = 393, χ2/df = 2.35, p = .13; CFI = .85; gamma hat = .95; RMSEA = .052, 90%CI = .048–.057; SRMR = .071). Under the assumption of full equivalence, the scale inter-correlations (see for values) were identical. Improvement was positively but moderately correlated with School Quality and more robustly inverse with Irrelevance, suggesting that the teachers perceived that assessment was relevant for improvement and can be used to identify school quality. In contrast, the correlation between School Quality and Irrelevance was not different to zero, suggesting that the function of assessment results to demonstrate school quality elicited random responses as to assessment being irrelevant.
Scale scores
In general, mean scores () were close to or slightly above moderate agreement for assessment helps teachers and students improve and assessment provides descriptive, diagnostic information. In contrast, both assessment provides reliable, valid information and assessment identifies school quality had means between slightly and moderately agree. Unsurprising, the means for assessment is irrelevant were just below slightly agree. Univariate ANOVA of mean scores by time showed a statistically significant increase for only two factors; that is, assessment helps students improve and assessment provides valid, reliable information. It is worth noting that both of these score differences for η2 qualify as small effects (Cohen, Citation1988). All other factors had statistically not significant change in means across the two time-points. Hence, score differences over time were tiny or nil. Multivariate analysis of variance, using main effects and all two-way interactions, showed no statistically significant difference in scale means at either time point by teacher sex, possession of a bachelor’s degree, length of teaching experience, or teaching stage or any of the two-way interactions. Consequently, no further examination of possible univariate results was conducted.
Discussion
A Swedish adaptation of the New Zealand Teacher Conceptions of Assessment inventory (version IIIA) was administered twice, approximately 18 months apart, in one northern Sweden municipality. A sample of 249 teachers were matched after removal of outliers across the two time-points and their self-reported scores were analysed with confirmatory factor analysis, invariance testing, and means comparison. With good correspondence to the data, six of the nine factors in the TCoA-IIIA were completely replicated and the Assessment is Bad for Teaching factor was partially replicated (i.e. two of three items replicated). The model was fully equivalent between time points and statistically significant but small mean score differences were found between times for two factors. None of the teacher demographic characteristics had statistically significant relations to TCoA factor scores.
The student accountability factor identified in previous studies was completely absent in this study. Unlike the findings of a New Zealand interview study (Harris & Brown, Citation2009) in which teachers were very much opposed to the idea of holding students accountable, these items simply could not be explained by Swedish teachers’ conceptions of assessment. It is as if the conception of using assessment to evaluate and hold students accountable is simply non-existent. Within the Swedish context, the items for this construct seem to violate Swedish cultural norms and educational policies. For example, item sa1 (Assessment places students into categories) can be interpreted as measuring and sorting students themselves, which is not socially acceptable in Sweden’s egalitarian culture. Both items sa2 (Assessment is assigning a grade or level to student work) and sa3 (Assessment determines if students meet qualifications standards) target students’ competencies in relation to qualification standards. However, the national steering documents require that assessment of students’ competencies in relation to qualification standards should be done both formatively and summatively, a view also expressed in the member checking interviews. Further, item sa2 specifically concerns the assignment of grades, which are only given in Years 6 to 9. Given that the current sample had a majority of teachers working in earlier years, this may explain why the item did not work.
The School Quality factor (i.e. the conception that assessments can be used to judge the quality of schools) was fully replicated with modestly positive scores around slightly agree. The modestly positive correlation with Improvement is not obvious and grounds for explanations need to be explored in future studies with more comprehensive member checking.
The three items for the Inaccuracy factor (i.e. ir2 Assessment results should be treated cautiously because of measurement error; ir3 Teachers should take into account the error and imprecision in all assessment; and ir6 Assessment is an imprecise process) were completely removed in this study. These items refer to teachers taking into account the degree of error in any assessment or being cautious with potential misinformation from or within assessment. Information about the degree of uncertainty or imprecision in resulting scores is a characteristic most associated with standardised tests that can be used for formative purposes. Perhaps, when teachers use diverse (unstandardised) assessment methods, and also base their assessments on their own interaction with a class or an individual, judgements about error might not only be difficult to make but are also unlikely to happen.
One item linked to assessment having a negative or inappropriate influence upon teaching practices was removed from the Assessment is Bad for Teaching factor (i.e. ir1 Assessment forces teachers to teach in a way against their beliefs). Given the inverse relationship between the Improvement factor and the Irrelevance factor it is likely that, among these Swedish classroom teachers, assessment is embedded within teaching and does express the teacher’s curricular goals and pedagogical choices. Further, given the control Swedish teachers have over assessment practices, it is unlikely that they would consider assessment to have little impact on their teaching. The very essence of formative assessment is that assessment derives from teaching and informs further instruction. Nonetheless, the two remaining items for this factor were captured in this analysis showing that Swedish teachers were aware of the possibility that assessment could interfere with or have little impact on teaching. The mean score at both times was slightly agree suggesting there are instances in which assessment practices are seen as interfering with teaching.
Swedish teachers generally agreed that assessment helps teachers and students improve and provides diagnostic descriptions of student performance. There were small increases in endorsement of just two conceptions: that is, assessment supports student improvement and assessment is dependably reliable and valid. Consequently, there is much room for increased endorsement of these formative improvement-oriented conceptions. Nonetheless, the positive view of formative conceptions of the purpose and nature of assessment is a positive result, consistent with governmental priorities and cultural norms. This formative conception of assessment strongly mimics previously reported results from other low-stakes assessment contexts such as New Zealand and Queensland, Australia.
It may be that increased endorsement of the formative conception of assessment is constrained, not by teacher knowledge or beliefs, but rather the quality of assessment resources available to teachers. For example, New Zealand has deployed a computer supported diagnostic assessment system (the Assessment Tools for Teaching and Learning; G. T. L. Brown, Citation2013, Citation2019; G. T. Brown & Hattie, Citation2012) that teachers can use to identify student learning needs and monitor the effectiveness of their instructional practices. Those resources give classroom teachers the ability to effectively meet accountability expectations as well as support student learning. Such assessment protocols may help Swedish teachers further entrench the formative conceptions of assessment.
This study indicates that the Swedish adaptation of the TCoA can be used reliably in Swedish primary and lower secondary schools as a measure of their conceptions of the formative uses and purposes of assessment. Thus, it may be used in future studies to examine the need for, and effects of, professional development initiatives to support the development of teachers’ formative assessment conceptions. The model shows the structure of assessment beliefs. PD programs may administer the survey to participating teachers, so they are provided with data about their own conceptions. Time may then be allocated to discussions about their conceptions and relate them to research about effects of different kinds of assessment practices. Such PD components including information concerning research about effective assessment practices and teachers confronting their own conceptions with others may influence their conceptions towards endorsement of assessment for improvement (Dixon & Haigh, Citation2009). Such conceptions could affect their practices towards more formative assessment practices, which have been shown to positively affect student achievement.
Some limitations of the study can be identified. Rather than rely on a purely empirical, data-driven analysis (e.g. exploratory factor analysis), we used a model-driven theory that teachers have conceptions of assessment defined by four fundamental purposes of assessment. The model development protocols, in which items and scales were deleted, aimed to maximise the original New Zealand model. However, the 2021 model result has capitalised on existing data. Full replication with the 2023 data does suggest that there is reasonable stability in the observed results. Furthermore, the similarity of the Swedish TCoA results with the original New Zealand model does suggest some important similarities across very different societies and languages exist.
The measurements were performed in a single municipality in northern Sweden, which may reduce generalisability of the results. However, we posit that the findings here are likely representative of a broader cohort of Swedish teachers. While the school administration is local, national policy as manifested in, for example, national curriculum documents, national tests, guides for grading, and other national support material are the same nationwide in primary and lower secondary schools. However, assuring generalisability would require a national survey. The relatively modest coefficient H values (i.e. just three of 14 coefficients H > 0.80) indicate low stability. Further testing of the factor measurement models in an additional larger sample (ideally N > 500) of Swedish teachers is therefore warranted.
Since the data constitutes responses to a questionnaire, we made informed interpretations, corroborated by a small-scale member checking exercise, of the meaning of factors and path values. Subsequent more comprehensive qualitative studies exploring teachers’ interpretations of the questionnaire items by providing them with their own scores could provide further confidence in our explanations. Such work is essential in identifying whether there are additional and different conceptions of assessment in Sweden, than elsewhere. Such additional conceptions were found in Hong Kong (Hui, Citation2012) and it is likely there exist other ideas not yet identified in Sweden.
This study indicates that the Swedish Teacher Conceptions of Assessment adaptation can be used reliably in Swedish primary schools as a measure of teacher attitudes towards the uses of assessment in that context. The near replication of the New Zealand model may be understood in the light of the similarities of the Swedish and New Zealand contexts. Both have low-stakes assessment systems and emphasis on formative uses of assessment. However, the differences between the New Zealand and Swedish models found in this study underscore the need for validation (and, possibly, adjustments) of the inventory even when educational systems share many policy features.
Supplemental Material
Download MS Word (18.3 KB)Supplemental Material
Download MS Word (19.8 KB)Supplementary Material
Supplemental data for this article can be accessed online at https://doi.org/10.1080/20004508.2024.2375111
Disclosure statement
The authors declare that there are no financial or conflict of interest issues in submitting this manuscript.
Additional information
Notes on contributors
Gavin T. L. Brown
Gavin T. L. Brown is a professor of education at the University of Auckland, focused on quantitative research methods and the psychology of assessment. He holds honorary positions in Umea, Thailand, and Hong Kong.
Catarina Andersson
Catarina Andersson is an associate professor of mathematics education. Her research focuses on how formative assessment can be implemented in schools and especially with students with disabilities.
Mikael Winberg
Mikael Winberg is a professor in mathematics and science education. His research focus is on how student epistemic beliefs and motivation affects their learning, and how these in turn are affected by the instructional design.
Björn Palmberg
Björn Palmberg is an associate professor in science and mathematics education. HIs research focuses on identifying and evaluating the best ways to teach mathematics.
Torulf Palm
Torulf Palm is a professor of science and mathematics education. His research focuses on formative assessment methods and impacts in mathematics instruction.
Notes
References
- Ajzen, I. (1991). The theory of planned behavior. Organizational Behavior and Human Decision Processes, 50(2), 179–211. https://doi.org/10.1016/0749-5978(91)90020-T
- Amos Development Corp. (2022). IBM SPSS Amos. In (Version 29.0.0). IBM. https://amosdevelopment.com
- Bandalos, D. L., & Finney, S. J. (2010). Factor analysis: Exploratory and confirmatory. In G. R. Hancock & R. O. Mueller (Eds.), The reviewer’s guide to quantitative methods in the social sciences (pp. 93–114). Routledge.
- Barker, L. E., & Shaw, K. M. (2015). Best (but oft-forgotten) practices: Checking assumptions concerning regression residuals. The American Journal of Clinical Nutrition, 102(3), 533–539. https://doi.org/10.3945/ajcn.115.113498
- Barnes, N., Fives, H., & Dacey, C. M. (2015). Teachers’ beliefs about assessment. In H. Fives & M. G. Gill (Eds.), International handbook of research on teacher beliefs (pp. 230–247). Routledge.
- Bejar, I. I. (1984). Educational diagnostic assessment. Journal of Educational Measurement, 21(2), 175–189. https://doi.org/10.1111/j.1745-3984.1984.tb00228.x
- Bentler, P. M., & Dudgeon, P. (1996). Covariance structure analysis: Statistical practice, theory, and directions. Annual Review of Psychology, 47(1), 563–592. https://doi.org/10.1146/annurev.psych.47.1.563
- Black, P., & Wiliam, D. (1998). Assessment and classroom learning. Assessment in Education Principles, Policy & Practice, 5(1), 7–74. https://doi.org/10.1080/0969595980050102
- Black, P., & Wiliam, D. (2009). Developing the theory of formative assessment. Educational Assessment, Evaluation and Accountability, 21(1), 5–31. https://doi.org/10.1007/s11092-008-9068-5
- Bloom, B. S., Madaus, G. F., & Hastings, J. T. (1981). Evaluation to improve learning. McGraw-Hill.
- Bonner, S. M. (2016). Teachers’ perceptions about assessment: Competing nsarratives. In G. T. L. Brown & L. R. Harris (Eds.), Handbook of human and social conditions in assessment (pp. 21–39). Routledge.
- Brown, G. T., & Hattie, J. (2012). The benefits of regular standardized assessment in childhood education: Guiding improved instruction and learning. In S. Suggate & E. Reese (Eds.), Contemporary educational debates in childhood education and development (pp. 287–292). Routledge.
- Brown, G. T. L. (2003). Teachers’ conceptions of assessment inventory-abridged (TCoA version IIIA). Measurement instrument. https://doi.org/10.17608/k6.auckland.3199543.v1
- Brown, G. T. L. (2004). Teachers’ conceptions of assessment: Implications for policy and professional development. Assessment in Education Principles, Policy & Practice, 11(3), 301–318. https://doi.org/10.1080/0969594042000304609
- Brown, G. T. L. (2006). Teachers’ conceptions of assessment: Validation of an abridged version. Psychological Reports, 99(1), 166–170. https://doi.org/10.2466/pr0.99.1.166-170
- Brown, G. T. L. (2008). Conceptions of assessment: Understanding what assessment means to teachers and students. Nova Science Publishers.
- Brown, G. T. L. (2011). Teachers’ conceptions of assessment: Comparing primary and secondary teachers in New Zealand. Assessment Matters, 3, 45–70. https://doi.org/10.18296/am.0097
- Brown, G. T. L. (2013). asTtle—A national testing system for formative assessment: How the national testing policy ended up helping schools and teachers. In M. K. Lai & S. Kushner (Eds.), A national developmental and negotiated approach to school and curriculum evaluation (pp. 39–56). Emerald Group Publishing. https://doi.org/10.1108/S1474-7863(2013)0000014003
- Brown, G. T. L. (2017). Improvement and accountability functions of assessment: Impact on teachers’ thinking and action. In M. A. Peters (Ed.), Encyclopedia of educational philosophy and theory (pp. 1109–1114). Springer Singapore. https://doi.org/10.1007/978-981-287-532-7_391-1
- Brown, G. T. L. (2019). Technologies and infrastructure: Costs and obstacles in developing large-scale computer–based testing. Education Inquiry, 10(1), 4–20. https://doi.org/10.1080/20004508.2018.1529528
- Brown, G. T. L., Gebril, A., & Michaelides, M. P. (2019). Teachers’ conceptions of assessment: A global phenomenon or a global localism. Frontiers in Education, 4, 16. https://doi.org/10.3389/feduc.2019.00016
- Brown, G. T. L., & Harris, L. R. (2009). Unintended consequences of using tests to improve learning: How improvement-oriented resources heighten conceptions of assessment as school accountability. Journal of MultiDisciplinary Evaluation, 6(12), 68–91. https://doi.org/10.56645/jmde.v6i12.236
- Brown, G. T. L., Harris, L. R., O’Quin, C., & Lane, K. E. (2017). Using multi-group confirmatory factor analysis to evaluate cross-cultural research: Identifying and understanding non-invariance. International Journal of Research & Method in Education, 40(1), 66–90. https://doi.org/10.1080/1743727X.2015.1070823
- Brown, G. T. L., Hui, S. K. F., Yu, F. W. M., & Kennedy, K. J. (2011). Teachers’ conceptions of assessment in Chinese contexts: A tripartite model of accountability, improvement, and irrelevance. International Journal of Educational Research, 50(5–6), 307–320. https://doi.org/10.1016/j.ijer.2011.10.003
- Brown, G. T. L., Kennedy, K. J., Fok, P. K., Chan, J. K. S., & Yu, W. M. (2009). Assessment for student improvement: Understanding Hong Kong teachers’ conceptions and practices of assessment. Assessment in Education Principles, Policy & Practice, 16(3), 347–363. https://doi.org/10.1080/09695940903319737
- Brown, G. T. L., Lake, R., Matters, G. (2011). Queensland teachers’ conceptions of assessment: The impact of policy priorities on teacher attitudes. Teaching and Teacher Education, 27(1), 210–220. https://doi.org/10.1016/j.tate.2010.08.003
- Brown, G. T. L., & Shulruf, B. (2023). Response option design in surveys. In L. R. Ford & T. A. Scandura (Eds.), The SAGE handbook of survey development and application (pp. 120–132). Sage.
- Cheng, M. M. H., Cheng, A. Y. N., & Tang, S. Y. F. (2010). Closing the gap between the theory and practice of teaching: Implications for teacher education programmes in Hong Kong. Journal of Education for Teaching, 36(1), 91–104. https://doi.org/10.1080/02607470903462222
- Cohen, J. (1988). Statistical power analysis for the behavioral sciences (2nd ed.). Routledge.
- Courtney, M. G. R., & Chang, K. C. (2018). Dealing with non-normality: An introduction and step-by-step guide using R. Teaching Statistics, 40(2), 51–59. https://doi.org/10.1111/test.12154
- DeLuca, C., Coombs, A., & LaPointe McEwan, D. (2019). Assessment mindset: Exploring the relationship between teacher mindset and approaches to classroom assessment. Studies in Educational Evaluation, 61, 159–169. https://doi.org/10.1016/j.stueduc.2019.03.012
- Dempster, A. P., Laird, N. M., & Rubin, D. B. (1977). Maximum likelihood from incomplete data via the EM algorithm. Journal of the Royal Statistical Society Series B, Statistical Methodology, 39(1), 1–22. https://doi.org/10.1111/j.2517-6161.1977.tb01600.x
- DiStefano, C., Zhu, M., & Mîndrilă, D. (2009). Understanding and using factor scores: Considerations for the applied researcher. Practical Assessment, Research & Evaluation, 14(20). https://doi.org/10.7275/da8t-4g52
- Dixon, H., & Haigh, M. (2009). Changing mathematics teachers’ conceptions of assessment and feedback. Teacher Development, 13(2), 173–186. https://doi.org/10.1080/13664530903044002
- EVS/WVS. (2022). European values study and World values survey: Joint EVS/WVS 2017-2022 dataset (Joint EVS/WVS). GESIS Data Archive. Dataset Version 4.0.0. https://doi.org/10.4232/1.14023
- Fan, X., & Sivo, S. A. (2007). Sensitivity of fit indices to model misspecification and model types. Multivariate Behavioral Research, 42(3), 509–529. https://doi.org/10.1080/00273170701382864
- Finney, S. J., & DiStefano, C. (2006). Non-normal and categorical data in structural equation modeling. In G. R. Hancock & R. D. Mueller (Eds.), Structural equation modeling: A second course (pp. 269–314). Information Age Publishing.
- Fives, H., & Buehl, M. M. (2012). Spring cleaning for the “messy” construct of teachers’ beliefs: What are they? Which have been examined? What can they tell us? In K. R. Harris, S. Graham, & T. Urdan (Eds.), APA educational psychology handbook: Individual differences and cultural and contextual factors (Vol. 2, pp. 471–499). APA.
- Fulmer, G. W., Lee, I. C. H., & Tan, K. H. K. (2015). Multi-level model of contextual factors and teachers’ assessment practices: An integrative review of research. Assessment in Education Principles, Policy & Practice, 22(4), 475–494. https://doi.org/10.1080/0969594X.2015.1017445
- Hancock, G. R., & Mueller, R. O. (2001). Rethinking construct reliability within latent variable systems. In R. Cudeck, S. D. Toit, & D. Sörbom (Eds.), Structural equation modeling: Present and future - A Festschrift in Honor of Karl Jöreskog (pp. 195–216). Scientific Software International Inc.
- Harris, L. R., & Brown, G. T. L. (2009). The complexity of teachers’ conceptions of assessment: Tensions between the needs of schools and students. Assessment in Education Principles, Policy & Practice, 16(3), 365–381. https://doi.org/10.1080/09695940903319745
- Hattie, J. (2009). Visible learning: A synthesis of over 800 meta-analyses relating to achievement. Routledge.
- Helgøy, I., & Homme, A. (2007). Towards a new professionalism in school? A comparative study of teacher autonomy in Norway and Sweden. European Educational Research Journal, 6(3), 232–249. https://doi.org/10.2304/eerj.2007.6.3.232
- Hill, M. F., & Eyers, G. E. (2016). Moving from student to teacher: Changing perspectives about assessment through teacher education. In G. T. L. Brown & L. R. Harris (Eds.), Handbook of human and social conditions in assessment (pp. 57–76). Routledge.
- Hofstede, G., Hofstede, G. J., & Minkov, M. (2010). Cultures and organizations: Software of the mind (3. ed. ed.). McGraw-Hill.
- Hofverberg, A., & Winberg, M. (2020). Challenging the universality of achievement goal models: A comparison of two culturally distinct countries. Scandinavian Journal of Educational Research, 64(3), 333–354. https://doi.org/10.1080/00313831.2018.1544170
- Hu, L.-T., & Bentler, P. M. (1999). Cutoff criteria for fit indexes in covariance structure analysis: Conventional criteria versus new alternatives. Structural Equation Modeling: A Multidisciplinary Journal, 6(1), 1–55. https://doi.org/10.1080/10705519909540118
- Hui, S. K. F. (2012). Missing conceptions of assessment: Qualitative studies with Hong Kong curriculum leaders. The Asia-Pacific Education Researcher, 21(2), 375–383.
- International Test Commission. (2018). ITC guidelines for translating and adapting tests (Second edition). International Journal of Testing, 18(2), 101–134. https://doi.org/10.1080/15305058.2017.1398166
- Jöreskog, K. G., & Goldberger, A. S. (1975). Estimation of a model with multiple indicators and multiple causes of a single latent variable. Journal of the American Statistical Association, 70(351a), 631–639. https://doi.org/10.1080/01621459.1975.10482485
- Kim, H.-Y. (2013). Statistical notes for clinical researchers: Assessing normal distribution (2) using skewness and kurtosis. Restorative Dentistry & Endodontics, 38(1), 52–54. https://doi.org/10.5395/rde.2013.38.1.52
- Lai, M. K., & Schildkamp, K. (2016). In-service teacher professional learning: Use of assessment in data-based decision-making. In G. T. L. Brown & L. R. Harris (Eds.), Handbook of human and social conditions in assessment (pp. 77–94). Routledge.
- Lee, H., Chung, H. Q., Zhang, Y., Abedi, J., & Warschauer, M. (2020). The effectiveness and features of formative assessment in US K-12 education: A systematic review. Applied Measurement in Education, 33(2), 124–140. https://doi.org/10.1080/08957347.2020.1732383
- Little, R. J. A. (1988). A test of missing completely at random for multivariate data with missing values. Journal of the American Statistical Association, 83(404), 1198–1202. https://doi.org/10.1080/01621459.1988.10478722
- Mardia, K. V. (1970). Measures of multivariate skewness and kurtosis with applications. Biometrika, 57(3), 519–530. https://doi.org/10.1093/biomet/57.3.519
- Maydeu-Olivares, A., Shi, D., & Rosseel, Y. (2018). Assessing fit in structural equation models: A Monte-Carlo evaluation of RMSEA versus SRMR confidence intervals and tests of close fit. Structural Equation Modeling: A Multidisciplinary Journal, 25(3), 389–402. https://doi.org/10.1080/10705511.2017.1389611
- McArdle, J. J. (2007). Five steps in the structural factor analysis of longitudinal data. In R. Cudeck & R. C. MacCallum (Eds.), Factor analysis at 100: Historical developments and future directions (pp. 99–130). LEA.
- Nichols, S. L., & Harris, L. R. (2016). Accountability assessment’s effects on teachers and schools. In G. T. L. Brown & L. R. Harris (Eds.), Handbook of human and social conditions in assessment (pp. 40–56). Routledge.
- Opre, D. (2015). Teachers’ conceptions of assessment. Procedia - Social & Behavioral Sciences, 209, 229–233. https://doi.org/10.1016/j.sbspro.2015.11.222
- Palm, T., Andersson, C., Boström, E., & Vingsle, C. (2017). A review of the impact of formative assessment on student achievement in mathematics. Nordic Studies in Mathematics Education, 22(3), 25–50. https://ncm.gu.se/wp-content/uploads/2020/06/22_3_025050_palm.pdf
- Revelle, W., & Rocklin, T. (1979). Very simple structure: An alternative procedure for estimating the optimal number of interpretable factors. Multivariate Behavioral Research, 14(4), 403–414. https://doi.org/10.1207/s15327906mbr1404_2
- Rubin, M. (2021). When to adjust alpha during multiple testing: A consideration of disjunction, conjunction, and individual testing. Synthese, 199(3–4), 10969–11000. https://doi.org/10.1007/s11229-021-03276-4
- SFS 2010:800. (2010). Skollag [The education act]. Utbildningsdepartementet [Ministry of Education].
- Skolverket [National Agency for Education]. (2020). Att planera, bedöma och ge återkoppling: stöd för undervisning [To plan, assess, and give feedback: Support for teaching]. Skolverket.
- Skolverket [National Agency for Education]. (2022). Läroplan för grundskolan, förskoleklassen och fritidshemmet [Curriculum for compulsory school, pre-school class and school age educare], Lgr 22. Skolverket.
- Sterba, S. K., & Pek, J. (2012). Individual influence on model selection. Psychological Methods, 17(4), 582–599. https://doi.org/10.1037/a0029253
- Tong, A., Sainsbury, P., & Craig, J. (2007). Consolidated criteria for reporting qualitative research (COREQ): A 32-item checklist for interviews and focus groups. International Journal for Quality in Health Care, 19(6), 349–357. https://doi.org/10.1093/intqhc/mzm042
- Vandeyar, S., & Killen, R. (2007). Educators’ conceptions and practice of classroom assessment in post-apartheid South Africa. South African Journal of Education, 27(1), 101–115. https://www.sajournalofeducation.co.za/index.php/saje/article/view/53/80
- Wheaton, B., Muthén, B., Alwin, D. F., & Summers, G. F. (1977). Assessing reliability and stability in panel models. Sociological Methodology, 8, 84–136. https://doi.org/10.2307/270754
Appendix A.
Multivariate Outlier Analysis Sweden TCoA
Mardia’s kurtosis test for multivariate outlier analysis was conducted in SPSS (v. 29.0.0). The full model had 27 manifest variables and 259 matched cases were available. Setting p = .001 for the 99.90% confidence interval, the critical value for Mahalanobis d2 = 55.4760. This identified seven participants (2.7%) in Time 1 and five (1.9%) in Time 2 as multivariate outliers. Just two participants were outliers at both time points.
Table
Sterba, S. K., & Pek, J. (2012). Individual influence on model selection. Psychological Methods, 17(4), 582–599. https://doi.org/10.1037/a0029253
Appendix B.
Model Development History showing model problems and solutions
Deleted items