
Abstract
The FACE-Q Rhinoplasty module is a patient-reported outcome instrument developed for the assessment of primarily aesthetic outcomes of rhinoplasty. The aim of our study was to produce a Finnish version of the instrument and validate it for use in patients undergoing nasal reconstruction as well as those treated with a rhinoplasty. Finnish versions of the FACE-Q scales Satisfaction with Nose, Satisfaction with Nostrils and Adverse Effects: Nose, were translated following established guidelines. Patients undergoing nasal resection, reconstruction or rhinoplasty in Helsinki University Hospital plastic surgery department in 2009–2019 were identified using theatre records. A total of 240 Finnish-speaking patients 18–85 years old were approached with a postal survey questionnaire. The questionnaire included the translated FACE-Q modules and those for Satisfaction with Facial Appearance, Appearance-Related Psychosocial Distress and Satisfaction with Outcome, as well as the general health-related quality of life instrument 15 D. The FACE-Q scales translated readily to Finnish. Eighty-three patients (35%) responded to the survey. Most FACE-Q scales performed well with high internal consistency (Cronbach’s alphas 0.87–0.92) and repeatability. Only the Adverse Effects: Nose scale displayed poor consistency and a floor effect with 18% of the patients reporting no adverse outcomes. Answers to the Appearance-Related Psychosocial Distress scale were skewed towards no experienced stress. Answers to the other scales were normally distributed with weak correlation with 15 D dimensions. The Finnish translations of the FACE-Q Rhinoplasty scales perform well at assessing a diverse group of patients including those undergoing nasal reconstruction as well as those undergoing rhinoplasty.
The nose has a prominent role in facial aesthetics and boasts marked psychosocial importance [Citation1]. Several patient-reported outcome measures (PROMs) addressing patient satisfaction and health-related quality of life after rhinoplasty exist [Citation2]. The FACE-Q Rhinoplasty module is a PROM containing scales developed specifically for assessing the appearance of the nose and any adverse effects after rhinoplasty [Citation3]. Produced by the Q-Portfolio team that has published also the PROMs BREAST-Q, BODY-Q, CLEFT-Q, SCAR-Q and ACNE-Q, the FACE-Q was developed incorporating patient input and has been psychometrically validated [Citation3,Citation4]. By including detailed questions on the appearance of the nose, the scale facilitates a more descriptive analysis of the patient’s opinion, in contrast to other widely used questionnaires [Citation5,Citation6]. Furthermore, the rigorous validation process the scale has undergone, means that any results produced using the scale are more likely to accurately reflect the construct it was designed to assess in the study population. This is important as a plethora of PROMs used in published studies have not undergone appropriate validation, thus weakening the conclusions that are drawn based on the data [Citation7]. Tools, such as the COSMIN Study Design checklist, have been created to help researchers and readers evaluate the limitations of PROMs [Citation8].
The FACE-Q scales were originally developed with patients seeking aesthetic treatments but have since been used in patients with facial trauma and those undergoing major facial surgery [Citation9,Citation10]. However, the nose-specific questions have, to our knowledge, not yet been validated for use in patients undergoing reconstructive surgery on the nose nor has the test-retest reliability of the scale been assessed.
Rhinoplasty is only available in the Finnish public healthcare system in cases where obstruction to airflow exists or the aesthetics of the nose are affected by a congenital condition, a previous trauma or a tumour. Reflecting this, the only PROM suitable for rhinoplasty patients validated in Finnish is the SNOT-20, an instrument focusing on sinusitis symptoms [Citation11]. With an increasing focus on incorporating the patients’ own views in the evaluation of plastic surgery procedure outcomes in both clinical practice and research, a true need exists for a validated PROM in Finnish on the aesthetic aspects of nasal surgery [Citation12]. The FACE-Q Rhinoplasty module was selected for translation due to the perceived ease of use that the modularity of the scale conveys as well as the rigor of its development.
The aim of our study was to produce a Finnish version of the FACE-Q scales relevant for rhinoplasty patients and to assess the reliability and the validity of this instrument in patients undergoing nasal resection, reconstruction or rhinoplasty.
Methods
The study design adhered to the ethical principles outlined in the Declaration of Helsinki and was approved by the ethical review board of Helsinki University Hospital [Citation13].
Translation of the FACE-Q instrument
Finnish versions of the FACE-Q scales Satisfaction with Nose, Satisfaction with Nostrils and Adverse Effects: Nose, were translated according to the International Society for Pharmacoeconomics and Outcomes Research guidelines [Citation14]. The COSMIN checklist for the assessment of cross-cultural validity was applied throughout the process [Citation8]. The authors PH and JR produced independent forward translations that were used to compile the Finnish scale. A commercial translator then translated the Finnish scale back to English. The back translation and the original translation were compared and final changes to the Finnish version made by the authors PH, JR, PL and AL, a native English speaker. Pilot testing of the translation was carried out on twelve patients to identify any cultural or linguistic issues. Translation of the components: Satisfaction with Facial Appearance, Appearance-Related Psychosocial Distress and Satisfaction with Outcome, has been previously described [Citation15]. Permission for the translation was sought from the copyright owner, and the Q-Portfolio team checked and approved the final translations.
Postal survey study
Patients having undergone an operation involving the nose in Helsinki University Department of Plastic Surgery between 2009 and 2019 were identified using operating theatre records. The procedures included were: rhinoplasty, cleft nose repair, partial excision of the nose, partial or complete reconstruction of the nose, and removal of a skin lesion in the nasal region. A total of 240 adult patients aged 85 years or under and fluent in Finnish were included.
A questionnaire package with a prepaid return envelope was mailed to the patients. The package included the FACE-Q scales, the general health-related quality of life instrument 15D, the question ‘How normal do you think your nose is?’, demographic data, information on the study and a consent form. The package was sent a second time if no response was obtained. A repeat of only the FACE-Q scales was sent to the participants upon return of the completed questionnaires. Patient records were reviewed for diagnosis and details of the surgery.
Statistical analysis
Total scores for the FACE-Q scales were calculated and scores were rescaled to 0–100 with 0 indicating the worst outcome and 100 the best outcome using the nonlinear Rasch transformation method as described with the original FACE-Q scales [Citation3,Citation16,Citation17]. Missing values were replaced with the mean score of the other items in the scale unless more than 50% of the values were missing. The patients with more than 50% missing values in a scale were excluded from further analysis on the given scale.
Distributions of the FACE-Q scale scores and median scores with the interquartile range were assessed. Floor and ceiling effects were examined to assess scale targeting. If the maximum or minimum points available were scored by 15% of responders or more, a ceiling or floor effect was confirmed, respectively.
The internal structure of each of the FACE-Q scales was examined by conducting exploratory factor analysis with maximum likelihood method and Promax-rotation method. Parallel analysis was conducted for each of the FACE-Q scales to determine the number of factors to include into factor analysis. Maximum likelihood method with 50 iterations of simulated analysis was used and eigenvalues obtained from the observed data were compared to the eigenvalues of the 95th percentile of this simulated data. Eigenvalues used to normalise the data, loading values and communality values of the included items were analyzed to determine the underlying factor structure for the FACE-Q scales. A loading value of over 0.4 was interpreted as that item representing the measured factor sufficiently. A communality value of over 0.5 was interpreted as the measured factor sufficiently accounting for the variance of the item.
Internal consistency of the scales, or how well the scales work at measuring what was intended, was assessed by calculating the Cronbach’s alphas with 95% confidence intervals. Values over 0.70 were interpreted as representing acceptable internal consistency. Values exceeding 0.95 were interpreted as indicating excessive similarity of the items and, thus, redundancy of items from the scale.
Reliability and repeatability of the FACE-Q scales were assessed by calculating intra-class correlation coefficients (ICC), standard error of the measurement (SEM) and repeatability coefficient (R) with 95% confidence intervals between the baseline and repeated administrations scores. In addition, median scores of the two administrations were compared using the Mann-Whitney U-test. The SEM value was estimated by calculating the square root of the ANOVA error variance of two administrations. Generalized linear mixed-effects models fitted by restricted maximum likelihood was used in estimation of the R-value. 95% confidence intervals of R were estimated with Bootstrapping method of 1000 repetitions.
The criterion validity, that is the extent to which the participants’ answers to the FACE-Q questions correlate with other variables they are expected to correlate with, and the discriminant validity, that is how the answers do not correlate with variables they are not expected to correlate with, were assessed through comparing the answers to the FACE-Q questions with scores of general health-related quality of life instrument already validated in Finnish, the 15 D. Convergence of the FACE-Q scale scores with the 15D dimensions and the question of ‘How normal do you think your nose is?’ were examined by calculating the Spearman correlation coefficients between the FACE-Q scale scores and reference scores. Correlation coefficient scores were interpreted as follows: less than 0.3: negligible; 0.3–0.5: weak; 0.5–0.7: moderate; and over 0.7: high. The face validity, or how relevant the questions seem, and the content validity, or how well the questions cover the construct of interest, were addressed in the pilot testing of the translation and cultural adaptation process and were not further investigated during the psychometric validation of the instrument.
Statistical analysis was conducted using R (3.6.3) statistical software [Citation18]. Packages used in statistical analysis included ‘psych’, ‘rptR’, ‘rel’, ‘GPArotation’ and ‘ltm’ [Citation19–23]. Data manipulation and visualization were performed using ‘tidyverse’ package together with the R base package [Citation24].
Results
Translation
Comparison of the back translation of the Finnish FACE-Q nose module and the original English version resulted in no further changes to the Finnish version of the scales. Responses during the pilot testing of twelve patients were positive with patients describing the questions and options as easy to understand.
Postal survey study
A total of 83 patients (35%) responded. The median age of the participants was 33 (range 18–86) years and the median time from the last operation on their nose was 3 (range 0–10) years. Patients with a congenital condition, such as a history of cleft lip or palate, formed the majority (53%) of patients. Forty-three (98%) of the patients with a congenital defect had undergone a rhinoplasty either earlier or as the most recent operation while one patient with a unilateral cleft had an autologous fat graft to the nose without any other late corrective procedure. Of the 28 patients who had undergone nasal reconstruction, eleven (39%) had a paramedian forehead flap, seven (25%) an extensive reconstruction with microsurgical flaps, six (21%) a helix flap, and four (14%) an auricular composite graft. Most patients (81%) had undergone more than one operation on their nose. Details of the patients are outlined in .
Table 1. Characteristics of the included patients.
The repeat questionnaires were sent a median of 17 (range 8–79) days after the first questionnaire. 63 patients (76%) of the initially responded participants returned the repeat questionnaire.
Satisfaction with facial appearance
Satisfaction with Facial Appearance scale scores followed a normal distribution and no floor or ceiling effects were observed. In a parallel analysis, one factor was suggested to be included into further examination in factor analysis. The factor analysis indicated high loading values of all items in the scale for the given factor. Communality value of item g (0.35) indicated that there might be other additional underlying factors accounting for variance in this item addressing the satisfaction with the profile appearance (). Internal consistency of the scale was high with Cronbach’s alpha of 0.91 (). The repeated measures scores showed high stability with no significant change in mean scores. In addition, high ICC (0.90) and low SEM (4.91) and R (0.00) values showed high reliability (). Satisfaction with Facial Appearance scale scores did not correlate with the 15 D dimensions, although there was a strong correlation with the item ‘How normal do you think your nose is?’ ().
Figure 1. Results of the FACE-Q subscales with repeat administration. ICC: intra-class correlation coefficient; SEM: standard error of measurement; R: repeatability coefficient.
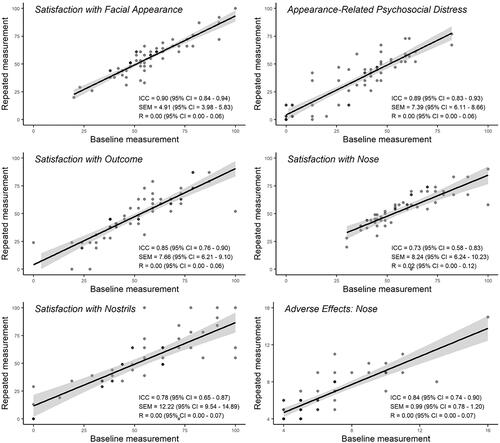
Table 2. Exploratory factor analysis for the FACE-Q subscales.
Table 3. Assessment of the internal consistency and reproducibility of the FACE-Q subscale scores.
Table 4. Correlation of the FACE-Q subscale scores with the 15D domains and the self-perceived normality of the nose.
Appearance-Related psychosocial distress
In the Appearance-Related Psychosocial Distress scale, the scores were focused towards the upper end of the scale. No floor or ceiling effects were confirmed. Parallel analysis proposed one factor to be included into factor analysis. Loading values of all items were high whereas communality values of items g and h (0.40 and 0.31, accordingly) proposed other underlying factors accounting for variance in these items addressing avoidance of others and interest in doing things (). Cronbach’s alpha 0.92 indicated high internal consistency of the scale (). There was no significant change in the mean baseline and repeated administration scores and ICC (0.89), SEM (7.39) and R (0.00) values supported excellent reliability of the scale (). Appearance-Related Psychosocial Distress scores were in weak correlation with the Depression, Distress and Vitality dimension of 15D. In addition, there was a moderate correlation with the item ‘How normal do you think your nose is?’ ().
Satisfaction with outcome
Satisfaction with Outcome scores were normally distributed and covered the whole score range. Floor or ceiling effects were not observed. Parallel analysis suggested one factor for further analysis. In exploratory factor analysis, loading values of each item indicated that items represent the factor under examination well. Communality of item a (0.49), however, implied that there might be another underlying factor accounting for variance of the item addressing satisfaction with the result (). Internal consistency of the scale was high (). Repeated measure scores did not show significant change between the administrations. High reliability was supported as ICC value was high (0.85) and SEM (7.66) and R (0.00) were low (). No significant correlations of the Satisfaction with Outcome scores and 15D dimensions were observed. Correlation with the item ‘How normal do you think your nose is?’ was of moderate strength ().
Satisfaction with nose
Scores of the Satisfaction with Nose scale did not show floor or ceiling effects and scores followed a normal distribution. Parallel analysis revealed one factor, which was further studied in factor analysis. Loading values of all items in the scale were acceptable (>0.4) whereas communalities of three items did not reach 0.5 indicating other underlying factors associated with these items. Communality values of these items a, c and e were 0.40, 0.22 and 0.42, respectively (). The questions addressed the width of the nose, the appearance of the bridge of the nose and the straightness of the nose. Results from repeated measure score analysis revealed no significant change in the scores observed with ICC (0.73), SEM (8.24) and R (0.02) values indicating moderate but acceptable reliability of repeated measure scores (, ). The 15D dimensions, Depression and Vitality were in weak correlation with the Satisfaction with Nose scores. Correlation with the item ‘How normal do you think your nose is?’ was high ().
Satisfaction with nostrils
Satisfaction with Nostrils scale scores were distributed normally, and no floor or ceiling effects were confirmed. In parallel analysis, one factor was suggested to be included into factor analysis (). According to factor analysis, unidimensional structure was supported with high loading and communality values of each items (). There was no significant difference in repeated measure scores although reliability analysis showed moderate variability in repeated measure scores with ICC of 0.78 and SEM of 12.2 (). Repeatability coefficient R (0.00) showed, however, good repeatability (). Satisfaction with Nostrils scale did not correlate with 15 D dimensions whereas correlation with the ‘How normal do you think your nose is?’ item was of moderate strength ().
Adverse effects: Nose
Floor effect was confirmed in the Adverse Effects scale with 18% of minimum scores. Factor analysis revealed that items in the scale sufficiently represent the one factor proposed by parallel analysis. However, communality values of any item did not reach the predefined cutoff 0.5 indicating that the variance of all items may be influenced by other underlying factors rather than the one suggested in the parallel analysis (). Reliability of the scale was excellent with high ICC (0.84) and low SEM (0.99) and R (0.00) (). In addition, there was no significant change in the scores of two administrations (). The Adverse Effects scale was in weak correlation with the 15 D dimensions, Breathing, Sleeping, Vitality and Sexual activity. In addition, correlation with the ‘How normal do you think your nose is?’ item was of moderate strength ().
Discussion
The role of PROMs in evaluating surgical outcomes is increasingly valued in plastic surgery [Citation12]. In order to be reliable, the instruments should be produced in, or translated to, the language the patient is fluent in and validated in the appropriate cultural context [Citation14]. We herein produced a Finnish version of the FACE-Q Rhinoplasty module and showed that it performs well in a heterogenous group of patients including those treated for congenital nasal defects or those undergoing nasal reconstruction following a trauma or earlier oncological resection. We also demonstrated that the test-retest reliability of the results is high, a feature not previously examined for this instrument.
The nose-specific scales Satisfaction with the Nose and Satisfaction with the Nostrils both retrieved a broad scale of scores and demonstrated high repeatability, implying a good performance and a suitability for use in patients treated in the university hospital setting, including those undergoing complex nasal reconstructive procedures. Answers to questions addressing the straightness of the nose, appearance of the nasal bridge and the width of the nose implied underlying multifactorial influences. This might reflect the complex reconstructive challenges as well as the deformities of the nose in a patient with a cleft lip and palate, a patient group forming the majority of participants in this study [Citation25].
A correlation of the scores for Satisfaction with Nose and Appearance-Related Psychosocial Distress scales with the 15D Depression and Vitality domains implied that patients less satisfied with their nose or those who were unhappy with their appearance were more likely to experience symptoms of depression. The correlation was, however, statistically weak. Depression is not one of the common psychopathologies typically reported in patients seeking rhinoplasty [Citation26]. Interestingly, no correlation was detected between the 15D Depression and Distress domains and the Adverse Effects: Nose scale that addresses the appearance and sensitivity of the nose as well as breathing difficulties. The responses of those who experienced difficulties suggested that the adverse effects are interconnected and associated with a sense that the nose is not ‘normal’. As a floor effect was detected with 18% of the participants reporting no adverse effects, it is possible that the scale did not capture some of the subtle negative effects the patients may have experienced.
The median score for Satisfaction with Nose observed in our study was 54. A study comparing patients scheduled for a rhinoplasty procedure and healthy volunteers proposed threshold values for normality for the Satisfaction with Nose and Satisfaction with Nostrils scales, 47 and 64 respectively [Citation27]. Thus our results suggest that the participants were in general not bothered by the appearance of their nose. Overall, the Satisfaction with Nose reported by our patients was higher than previously observed for rhinoplasty patients in some series and lower than in others, possibly due to the reconstructive character of the procedures influencing both the expectations and the outcomes in our patients [Citation3,Citation28]. The comparatively worse median score for the Satisfaction with Nostrils, 55, may reflect the surgical challenges in reconstructing a natural-looking and symmetrical alar region.
The three general facial scales Satisfaction with Facial Appearance, Appearance-Related Psychosocial Distress and Satisfaction with Outcome performed well in the study population with no floor or ceiling effect observed. The reliability of the scales on repeat administration was also high. This suggests that the scales are well suited for use in patients undergoing nasal reconstructive procedures and rhinoplasties. The responses to these general appearance questions correlated at a moderate to high level with the perceived ‘normality’ of the nose. In line with this, the scores for Satisfaction with Facial Appearance and Appearance-Related Psychosocial Distress have been reported to be higher in patients who have had rhinoplasty compared to those assessed preoperatively [Citation3,Citation29,Citation30]. The items addressing satisfaction with the facial profile and the overall outcome of the surgery in our patients appeared to, however, have multifactorial influences not captured by these general questions, an observation supporting the use of the additional nose-specific module in these patients.
The main limitations of our study are the somewhat small sample size and the retrospective nature. The sample size of 83 patients can, however, be considered adequate [Citation8]. The 35% response rate may, nevertheless, have introduced bias in both the responses to the FACE-Q scale questions and the correlation between the FACE-Q and the 15D responses. The patient sample was nonhomogenous per design and while patients who had a nasal reconstruction were well represented, there were only a few participants operated on for trauma. Further, the concerns of patients who had a rhinoplasty for an asymmetry arising from a cleft lip and palate repaired in the childhood might be better captured with the nose and nostrils modules of the CLEFT-Q, a PROM developed for the cleft lip/palate patient population [Citation31]. The decision to include reconstructive patients, and thus deviate from the COSMIN guidelines for cross-cultural validation, was made to enable the assessment of the performance of the scale directly in the patient population encountered in the university hospital setting.
With no preoperative data on the participants, we were unable to determine the minimum detectable difference or responsiveness for the FACE-Q rhinoplasty module. As the minimally important difference between the two scores has previously been evaluated only for the original Satisfaction with Appearance subscale and none of the nose-specific components, the interpretation of a change or a difference in the scores can be challenging. Further studies focusing on estimating the minimally important difference for the FACE-Q and its rhinoplasty module are thus needed. In addition, the absence of a group that has not had or sought surgery on the nose prevented the determination or normal values for the scales in the Finnish population.
In conclusion, the Finnish version of the FACE-Q nose module performs well in assessing the patient-reported outcomes in both rhinoplasty and reconstructive patients treated in a university hospital setting. The reliability of the scale on repeat administration is high. Further studies are needed to establish the normal values of the scales in the Finnish population and the sensitivity of the scale at detecting a difference between two states.
Acknowledgements
The authors thank members of the Q-Portfolio team for their assistance during the translation process. The translated FACE-Q instrument is available upon request free of charge for clinical and research use at the Q-Portfolio website [Citation4].
Disclosure statement
No potential conflict of interest was reported by the author(s).
References
- Amodeo CA. The central role of the nose in the face and the psyche: review of the nose and the psyche. Aesth Plast Surg. 2007;31(4):406–410.
- Barone M, Cogliandro A, Di Stefano N, et al. A systematic review of patient-reported outcome measures after rhinoplasty. Eur Arch Otorhinolaryngol. 2017;274(4):1807–1811.
- Klassen AF, Cano SJ, East CA, et al. Development and psychometric evaluation of the face-Q scales for patients undergoing rhinoplasty. JAMA Facial Plast Surg. 2016;18(1):27–35.
- http://Qportfolio.Org/. [cited 2020 July 15]
- Lee MK, Most SP. A comprehensive quality-of-life instrument for aesthetic and functional rhinoplasty: the rhino scale. Plastic Reconstruc Surg Global Open. 2016;4(2):e611.
- Alsarraf R. Outcomes research in facial plastic surgery: a review and new directions. Aesthetic Plast Surg. 2000;24(3):192–197.
- Santesso N, Barbara AM, Kamran R, et al. Conclusions from surveys may not consider important biases: a systematic survey of surveys. J Clin Epidemiol. 2020;122:108–114.
- Mokkink LB, Prinsen CAC, Patrick DL, Alonso J, Bouter LM, de Vet HCW, Terwew CB. COSMIN study design checklist for patient-reported outcome measurement instruments. Version July 2019. www.cosmin.nl
- Hindin DI, Muetterties CE, Lee JC, et al. Internal distraction resulted in improved patient-reported outcomes for midface hypoplasia. J Craniofac Surg. 2018;29(1):139–143.
- Elegbede A, Mermulla S, Diaconu SC, et al. Patient-reported outcomes in facial reconstruction: assessment of face-Q scales and predictors of satisfaction. Plast Reconstr Surg Glob Open. 2018;6(12):e2004.
- Alakärppä AI, Koskenkorva TJ, Koivunen PT, et al. Quality of life before and after sinonasal surgery: a population-based matched cohort study. Eur Arch Otorhinolaryngol. 2017;274(2):795–802.
- Sharma K, Steele K, Birks M, et al. Patient-reported outcome measures in plastic surgery: an introduction and review of clinical applications. Ann Plast Surg. 2019;83(3):247–252.
- World Medical Association. World medical association declaration of helsinki: ethical principles for medical research involving human subjects. JAMA. 2013;310:2191–2194.
- Wild D, Grove A, Martin M, et al.; ISPOR Task Force for Translation and Cultural Adaptation. Principles of good practice for the translation and cultural adaptation process for patient-reported outcomes (Pro) measures: report of the ispor task force for translation and cultural adaptation. Value Health. 2005;8(2):94–104.
- Homsy SPU, Lindford MM, Repo AJ, et al. Finnish translation and validation of the face-Q eye module. Scand J Surg. 2020;1457496920982767. doi: https://doi.org/10.1177/1457496920982767. Online ahead of print.
- Klassen AF, Cano SJ, Schwitzer JA, et al. Face-Q scales for health-related quality of life, early life impact, satisfaction with outcomes, and decision to have treatment: development and validation. Plast Reconstr Surg. 2015;135(2):375–386.
- Pusic AL, Klassen AF, Scott AM, et al. Development and psychometric evaluation of the face-q satisfaction with appearance scale: a new patient-reported outcome instrument for facial aesthetics patients. Clin Plast Surg. 2013;40(2):249–260.
- Team RC. R: a language and environment for statistical computing. R foundation for statistical computing. Vienna, Austria; 2020. http://www.r-project.org/index.html
- Revelle W. Psych: procedures for personality and psychological research. Evanston, IL: Northwestern University; 2018. https://CRAN.R-project.org/package=psychVersion=1.8.12.
- Stoffel MA, Nakagawa S, Schielzeth H. Rptr: repeatability estimation and variance decomposition by generalized linear mixed-effects models. Methods Ecol Evol. 2017;8(11):1639–1644.
- LoMartire R. Rel: reliability coefficients. R Package Version 1.4.2. 2020.
- Bernaards CA, Jennrich RI. Gradient projection algorithms and software for arbitrary rotation criteria in factor analysis. Educ Psychol Measure. 2005;65(5):676–696.
- Rizopoulos D. Ltm: an R package for latent variable modeling and item response analysis. J Stat Soft. 2006;17:25.
- Wickham H. Tidyverse: easily install and load the 'Tidyverse'. R package version 1.2.1. 2017.
- Guyuron B. Moc-Ps(Sm) Cme article: late cleft lip nasal deformity. Plast Reconstr Surg. 2008;121(4 Suppl):1–11.
- Tasman A-J. The psychological aspects of rhinoplasty. Curr Opin Otolaryngol Head Neck Surg. 2010;18(4):290–294.
- Radulesco T, Mancini J, Penicaud M, et al. Assessing normal values for the face-Q rhinoplasty module: an observational study. Clin Otolaryngol. 2018;43(4):1025–1030.
- Kalaaji A, Dreyer S, Schnegg J, et al. Assessment of rhinoplasty outcomes with face-Q rhinoplasty module: norwegian linguistic validation and clinical application in 243 patients. Plast Reconstr Surg Glob Open. 2019;7(9):e2448–e2448.
- Schwitzer JA, Sher SR, Fan KL, et al. Assessing patient-reported satisfaction with appearance and quality of life following rhinoplasty using the face-Q appraisal scales. Plast Reconstr Surg. 2015;135:830e–837e.
- Klassen AF, Cano SJ, Pusic AL. Face-Q satisfaction with appearance scores from close to 1000 facial aesthetic patients. Plast Reconstr Surg. 2016;137(3):651e–652e.
- Tsangaris E, Wong Riff KWY, Goodacre T, et al. Establishing content validity of the cleft-Q: a new patient-reported outcome instrument for cleft Lip/palate. Plast Reconstr Surg Glob Open. 2017;5(4):e1305.