

ABSTRACT
Background: Post-traumatic stress disorder (PTSD) and major depressive disorder (MDD) are two highly comorbid psychological outcomes commonly studied in the context of stress and potential trauma. In Hubei, China, of which Wuhan is the capital, residents experienced unprecedented stringent lockdowns in the early months of 2020 when COVID-19 was first reported. The comorbidity between PTSD and MDD has been previously studied using network models, but often limited to cross-sectional data and analysis.
Objectives: This study aims to examine the cross-sectional and longitudinal network structures of MDD and PTSD symptoms using both undirected and directed methods.
Methods: Using three types of network analysis – cross-sectional undirected network, longitudinal undirected network, and directed acyclic graph (DAG) – we examined the interrelationships between MDD and PTSD symptoms in a sample of Hubei residents assessed in April, June, August, and October 2020. We identified the most central symptoms, the most influential bridge symptoms, and causal links among symptoms.
Results: In both cross-sessional and longitudinal networks, the most central depressive symptoms included sadness and depressed mood, whereas the most central PTSD symptoms changed from irritability and hypervigilance at the first wave to difficulty concentrating and avoidance of potential reminders at later waves. Bridge symptoms showed similarities and differences between cross-sessional and longitudinal networks with irritability/anger as the most influential bridge longitudinally. The DAG found feeling blue and intrusive thoughts the gateways to the emergence of other symptoms.
Conclusions: Combining cross-sectional and longitudinal analysis, this study elucidated central and bridge symptoms and potential causal pathways among PTSD and depression symptoms. Clinical implications and limitations are discussed.
HIGHLIGHTS
This study examined the cross-sectional and longitudinal network structures of depression and post-traumatic disorder symptoms using undirected and directed methods.
The most central depressive symptoms included sadness and depressed mood, whereas the most central post-traumatic disorder symptoms changed from irritability and hypervigilance to difficulty concentrating and avoidance of reminders over time.
Bridge symptoms showed similarities and differences between cross-sessional and longitudinal networks with irritability/anger as the most influential bridge longitudinally.
Antecedentes: El trastorno de estrés postraumático (TEPT) y el trastorno depresivo mayor (TDM) son dos resultados psicológicos altamente comórbidos que se estudian comúnmente en el contexto del estrés y trauma potencial. En Hubei, China, de la cual Wuhan es la capital, los residentes experimentaron cuarentenas estrictas sin precedentes en los primeros meses de 2020 cuando se informó por primera vez del COVID-19. La comorbilidad entre TEPT y TDM se ha estudiado previamente utilizando modelos de red, pero a menudo se limita a datos y análisis transversales.
Objetivos: Este estudio tiene como objetivo examinar las estructuras de red transversales y longitudinales de los síntomas de TDM y TEPT utilizando métodos dirigidos y no dirigidos.
Métodos: Mediante el uso de tres tipos de análisis de red: red no dirigido transversal, red no dirigido longitudinal y gráfico acíclico dirigido (DAG), examinamos las interrelaciones entre los síntomas de TDM y TEPT en una muestra de residentes de Hubei evaluados en abril, junio, agosto y octubre de 2020. Identificamos los síntomas centrales, los síntomas puente más influyentes y los vínculos causales entre los síntomas.
Resultados: Tanto en redes transversales como longitudinales, los síntomas depresivos más centrales incluyeron tristeza y estado de ánimo deprimido, mientras que los síntomas de TEPT más centrales cambiaron de irritabilidad e hipervigilancia en la primera ola a dificultad para concentrarse y evitar posibles recordatorios en las oleadas posteriores. Los síntomas puente, mostraron similitudes y diferencias entre las redes transversales y longitudinales con irritabilidad/ira como el puente más influyente longitudinalmente. El DAG descubrió que la tristeza y los pensamientos intrusivos son las puertas de entrada a la aparición de otros síntomas.
Conclusiones: Al combinar los análisis transversal y longitudinal, este estudio elucidó los síntomas centrales y puente y las posibles vías causales entre los síntomas de TEPT y de depresión. Se discuten las implicaciones clínicas y las limitaciones.
背景:创伤后应激障碍 (PTSD) 和重性抑郁障碍 (MDD) 是在应激和潜在创伤背景下被普遍研究的两种高共病的心理结果。在以武汉为首府的中国湖北省,居民在2020 年初首次报道 COVID-19 时经历了前所未有的严格封锁。以前使用网络模型研究PTSD 和 MDD 的共病,但通常仅限于横截面数据和分析。
目的:本研究旨在使用无向和有向方法考查 MDD 和 PTSD 症状的横截面和纵向网络结构。
方法:使用三种类型的网络分析——横截面无向网络、纵向无向网络和有向无环图(DAG)——我们在一个于 2020 年 4 月、6 月、8 月和 10 月评估的湖北居民样本中考查了 MDD 和 PTSD 症状之间的相互关系。我们识别了最核心的症状、最有影响的桥症状以及症状之间的因果关系。
结果:在横断面和纵向网络中,最核心的抑郁症状包括悲伤和抑郁情绪,而最核心的 PTSD 症状从第一时间点的易怒和高警觉转变为之后几个时间点的难以集中注意力和回避潜在提示物。桥症状在横断面和纵向网络之间有异有同,易激惹/愤怒是纵向最具影响力的桥连接。 DAG 发现感觉忧郁和闯入性想法是其他症状出现的通路。
结论:结合横断面和纵向分析,本研究阐明了 PTSD 和抑郁症状之间的核心和桥症状以及潜在的因果通路。讨论了临床意义和局限性。
PALABRAS CLAVE:
1. Introduction
The global outbreak of COVID-19 is an unprecedented public health crisis that continues to impact our society. Thus far, it has resulted in a combination of multi-domain stressors, exerted widespread and at times severe impacts on life without a specific end date, and blocked access to protective factors such as social support (Gruber et al., Citation2021). As a highly contagious respiratory illness, COVID-19 was first reported in Hubei Province, People’s Republic of China, toward the end of 2019. Starting with Wuhan, its capital, Hubei has witnessed the interruptions of daily life and extreme stressors without any previous experience or sufficient scientific knowledge of COVID-19. Hubei residents endured enormous threat and uncertainty as COVID-19 led to unprecedented quarantine policies, such as prohibiting residents from leaving their districts, restricting each family to send only one person to purchase groceries twice a week, banning the private use of cars, and rewarding individuals who reported neighbours breaking social distancing rules to eliminate group gatherings (Feng & Cheng, Citation2020). As a direct result, Hubei residents were faced with fear, economic loss, and lack of access to food supplies and routine healthcare. Although the strict lockdown measures in Hubei were temporarily lifted in April 2020, residents continued to face challenges such as financial stress, health concerns, discrimination from citizens in other provinces, and periodic smaller-scale lockdowns.
Depression and PTSD, two highly comorbid psychological outcomes (Angelakis & Nixon, Citation2015), have been commonly examined in the context of the COVID-19 pandemic (Xiong et al., Citation2020). Studies before (Kessler, Citation1995) and during (Karatzias et al., Citation2020) the COVID-19 pandemic reported comorbidity rates of MDD and PTSD as around 50%. Several studies have revealed similarly high comorbidity rates of depression and PTSD following other potential traumatic events. In a study of 9/11 survivors, 68.2% of the participants with PTSD met threshold for depression (Adams et al., Citation2019). In another nationwide longitudinal study, 60% of military Veterans with PTSD experienced co-existing clinical depression (Nichter et al., Citation2020). A treatment study showed reciprocal relationship between reductions in PTSD and depression symptoms during prolonged exposure, further supporting their interrelated nature (Brown et al., Citation2018).
Network models afford empirical tools to understand the structure and comorbidity of psychopathology (Borsboom & Cramer, Citation2013; Jones et al., Citation2021). In contrast to traditional psychopathology theory that mainly focuses on symptoms caused by underlying illness (Borsboom, Citation2008; Wakefield, Citation2007), network models conceptualize mental illness as a system of interacting symptoms that reinforce a pathological equilibrium (Borsboom, Citation2017; Fried et al., Citation2017; McNally, Citation2012). The network approach makes it possible to map the relations among individual symptoms, elucidate the most important elements, and visualize psychiatric comorbidities by identifying influential bridges between different communities of psychopathology (Jones et al., Citation2021). In specific, central symptoms are those with high centrality such as strength centrality, an index calculated by summing the weight of all edges connected to a symptom node (Opsahl et al., Citation2010). The activation of highly central symptoms has clinical relevance as it increases the likelihood of activation spreading to others (McNally et al., Citation2017). Bridge symptoms are those with high bridge centrality such as bridge expected influence, an index calculated by taking the absolute value of the sum of the connectivity between a node in disorder A with nodes in disorder B (Jones et al., Citation2021). In other words, bridge symptoms have a higher likelihood of connecting two or more mental disorders. Further, Bayesian network models allow for the examination of activating pathways among symptoms that can shed light on causality (McNally, Citation2016). Although most network analyses based on the aforementioned models were traditionally limited to cross-sectional data, more recent studies have begun to examine the longitudinal change – instead of cross-sectional observation of- symptoms (e.g. Miers et al., Citation2020; von Klipstein et al., Citation2021). For example, node change trajectories – the linear slope of the scores for each symptom node across time points estimated using Ordinary Least Squares (OLS) regression – can be used as variables to estimate a network.
Several studies have examined the network structure of PTSD and depression symptoms. For example, researchers found considerable similarities between networks of PTSD and depression symptoms among two independent adolescent samples following Typhoon Lekima and the COVID-19 outbreak, respectively (Qi et al., Citation2021), with the most central symptoms being exaggerated startle response, feeling down and unhappy, and self-destructive/reckless behaviour. The bridge symptoms this study identified, however, varied across types of potential trauma, with restricted affect and feeling unhappy as unique bridges in the COVID-19 network. In another study examining symptom structure of PTSD and depression in combat Veterans, flashbacks and emotional upset were most central while re-experiencing exhibited the highest predictive priority in a Bayesian network (Lazarov et al., Citation2020). In a study examining networks of PTSD symptoms among patients with traumatic injury in the acute post-trauma phase and 12 months after trauma, researchers identified reexperiencing symptoms as the most central during the acute phase, but their centrality indices decreased at 12 months after trauma (Bryant et al., Citation2017). Further, foreshortened future, sleep disturbance, anger, social detachment, amnesia, and concentration deficits had greater closeness and strength at 12 months than in the acute phase. In the context of COVID-19, several studies have thus far examined the symptom network of PTSD in both college students (Sun et al., Citation2021) and the general population (Yang et al., Citation2021). Network structures of PTSD symptoms were similar between Hubei and non-Hubei college students, as they shared some symptoms with high centrality, such as flashback, irritability, and anger (Sun et al., Citation2021). However, distorted cognition and lack of positive emotions were unique central symptoms in the Hubei network. In another study examining PTSD networks in both general and clinical populations, though both shared reckless behaviours as a symptom of high centrality, flashback was a unique central symptom in the PTSD network among individuals with PTSD (Yang et al., Citation2021). However, these studies only examined PTSD symptoms and were limited to cross-sectional data. Examining PTSD and depression networks with longitudinal data can reveal potential temporal differences in the dynamic features between the two symptom communities.
These previous studies provide important insights into how PTSD and depression symptoms develop and maintain. Yet, several important questions remained. First, many published network studies relied on cross-sessional analyses to generate hypotheses about causal links. Though a recent study showed similarity between undirected networks of baseline and node change trajectories of borderline personality symptoms (von Klipstein et al., Citation2021), this conclusion has not been replicated in other clinical contexts and network approaches. Longitudinal analyses of bridges between sets of symptoms can potentially illuminate how comorbidity is maintained. Further, using dynamic changes rather than cross-sectional observations may better reveal causality over time. Second, symptom networks of PTSD and depression in adults with experience of strict COVID-19 lockdowns remain unexamined. Given that the network of PTSD and depression may differ across different samples and contexts (Lazarov et al., Citation2020; Qi et al., Citation2021), it is likely that examining network in adults experiencing strict COVID-19 lockdowns would reveal nuances and contribute to understanding about the similarity and uniqueness in PTSD-depression networks across types of potential trauma. Finally, many studies usually assessed symptom comorbidity in the aftermath of traumatic events (Lazarov et al., Citation2020). COVID-19 affords a unique historical context through which we can examine how symptoms of depression and PTSD change during this public crisis.
The current investigation filled these gaps by conducting a series of network analyses to examine both undirected and directed networks of depression and PTSD among Hubei residents in April, June, August, and October 2020. As the first place where COVID-19 was reported, what happened in Hubei may exemplify the psychological influence of extremely strict lockdown measures (e.g. forbid outdoor activities) and afford insight into the maintenance of PTSD and depression symptoms in the context of the COVID-19 epidemic. In specific, we examined cross-sessional and longitudinal network structures of depression and PTSD, identified the most central symptoms across communities and the most influential bridge symptoms between communities, and elucidated potential causal pathways among symptoms. Although we hypothesized that relatively central symptoms may change over time and that depression and PTSD are likely bridged by both overlapping and non-overlapping symptoms, the analyses conducted were mostly exploratory.
2. Methods
2.1. Participants and procedure
Participants in this study were residents staying in the Greater Wuhan Area (i.e. Wuhan and neighbouring cities) in the aftermath of strict lockdowns (i.e. April 2020). In order to recruit participants, we adopted a snowball sampling strategy by spreading e-posters on multiple Chinese social media platforms to diversify our participant composition.
All participants completed four waves of surveys in April, June, August, and October 2020. As the network analysis approach requires complete data (Miers et al., Citation2020), the exact N in each cross-sectional network varied: 340 at T1, 311 at T2, 290 at T3, 288 at T4. We examined mental health outcome variables across four time points and psychosocial predictors at baseline. Psychosocial baseline predictors were reported elsewhere. At T1, participants ranged in age from 16 to 70 (M = 30.05, SD = 10.71) and 75.29% were female. The Institutional Review Board at Tsinghua University approved the study. All research was performed in accordance with relevant guidelines and regulations. All participants provided informed consent prior completing the study.
2.2. Measures
Depression was assessed via the 20-item Center for Epidemiological Studies-Depression (CES-D, Radloff, Citation1977; Wang et al., Citation1999). Participants rated the extent to which they agreed with statements about depressive symptoms (e.g. poor appetite, depressive mood) during the past week on a 4-point scale from 0 (less than 1 day a week) to 3 (5–7 days a week). The total scores of CES-D range from 0 to 60, and higher scores indicate greater levels of depression. Cronbach’s alpha coefficients were excellent (.91 to .93) across waves.
PTSD was measured by the 17-item Posttraumatic Diagnostic Scale-Chinese (PDS-C, Shen et al., Citation2014), in which individuals rated the extent to which they agreed with statements about PTSD symptoms such as hypervigilance and nightmares during the last month on a 4-point scale from 0 (not at all) to 3 (almost always). We did not require the participants to meet PTSD’s Criterion A in DSM-5. However, given that the experience of Hubei residents during COVID-19 lockdown was highly stressful and threatening, it is likely that participants would endorse PTSD symptoms despite the possible absence of Criterion A. When appropriate, item wording was tailored to capture COVID-19-specific traumatic experiences. For instance, the original item ‘Bad dreams or nightmares related to the trauma’ was replaced by ‘Bad dreams or nightmares related to the pandemic’. We did not alter the item wording for items that did not specify ‘related to the trauma,’ such as ‘diminished interest or participation in things I used to like.’ Cronbach’s alpha coefficients were excellent (.90 to .92) across waves.
2.3. Data analysis
Statistical analyses were performed in R Version 4.0.4 via Bootnet, qraph, networktools and NetworkComparisonTest packages (R Core Team, Citation2021). Three types of networks – cross-sectional undirected network, longitudinal undirected network, and directed acyclic graph (DAG) – were examined. These analyses complement each other visually and empirically, expand the range of network information, and potentially increase confidence about the importance and directional relationship of symptoms (McNally et al., Citation2022). Cross-sectional networks reveal symptom centrality and bridge centrality at each of the four-time points, allowing comparison to showcase potential difference over time. The longitudinal undirected network shows how the change in one symptom is associated with the change in other symptoms, providing additional information regarding how symptoms are dynamically related. Directed acyclic graphs, particularly the one based on node change trajectories, allow for causal inference as to which symptoms’ change would most likely lead to change in other symptoms.
We first built four cross-sectional undirected networks using the 20 CES-D items and 17 PDS-C items as two pre-specified communities in a Gaussian graphical model (GGM) (Costantini et al., Citation2015). The EBICglasso estimation method was used to estimate all cross-sectional networks by specifying default = ‘EBICglasso’ in the estimateNetwork() function of the bootnet package. GGM is an undirected network with its edges representing the partial correlations between nodes after controlling for the effects of all the other nodes in the same network. To produce a parsimonious model with fewer spurious edges, the GGM is regularized with the graphical least absolute shrinkage and selection operator (LASSO) penalties (Friedman et al., Citation2011) with the final model selected based on the lowest extended Bayesian information criterion (EBIC) (Foygel & Drton, Citation2011). The EBIC hyperparameter gamma (γ) was set to 0.4, which more strictly controls for false positives compared with a lower value. Prior to GGM estimation, we conducted nonparanormal transformation to the data using the huge.npn() function of the huge package to relax the multivariate normal distribution assumption (Jiang et al., Citation2019). To assess network parameter stability and accuracy of edge weights, we ran 5,000 bootstraps and constructed 95% confidence intervals (CI) on each edge by specifying type = ‘nonparametric’ and nBoots = ‘5000’ in the bootnet () function of the bootnet package (Epskamp et al., Citation2018). To assess network structure invariance and global strength invariance, we used the NCT() function of the NetworkComparisonTest package, using 1,000 iterations, and with seed set to ‘123’, to compare the network of T1 and T4 (van Borkulo et al., Citation2022). To assess which symptoms would emerge as bridging symptoms after removing overlapping symptoms shared by PTSD and depression symptoms, we conducted additional cross-sectional network analyses on each time point’s cross-sectional data and the longitudinal slope data after removing six overlapping symptoms including ‘Trouble keeping my mind (C5)’, ‘Difficulty concentrating (P15)’, ‘Restless sleep (C11)’, ‘Sleep disturbance (P13)’,‘Lack enjoyment (C16)’, and ‘Loss of interest (P9).
To further examine the longitudinal consistency of bridge nodes and central nodes, we incorporated the information about depression and PTSD collected across all waves into a newly estimated network that consists of the original 37 item scores’ change trajectories over time for each participant. Specifically, following the recent recommendations on longitudinal network analysis (Miers et al., Citation2020; von Klipstein et al., Citation2021), we ran Ordinary Least Squares (OLS) regression to estimate the (linear) slope of the node scores across T1, T2, T3, and T4. The value of the slope represents each participant’s change over time on a given item. Using the derived slope values, we then estimated an additional undirected network with each node representing the change trajectory across waves.
To quantify symptom importance and identify the most central symptom nodes that may drive the largest number of other symptoms, we computed each node’s strength centrality scores in all undirected networks. To ascertain bridge symptom nodes that could potentially explain why comorbidity is maintained, we computed the bridge expected influence (1-step) (BEI) of each node in all undirected networks. Compared to other bridge centrality indices such as bridge strength, bridge betweenness, and bridge closeness, BEI has the advantage of distinguishing positive edges from negative ones and sums up the edge weights from one node to all the nodes of a different community. Nodes with high BEI scores are likely to activate symptoms from other communities. Following the recommendations on bridge node selection, we applied the 80th percentile cutoff on the BEI values to select bridge nodes (Jones et al., Citation2021). To assess the stability of both strength centrality scores and BEI scores, we computed their corresponding correlation stability coefficients (CS-coefficients) using the bootnet package. Specifically, we ran 5,000 case-dropping subset bootstraps to calculate the CS coefficients, which represent the proportion of participants that can be removed from analysis while the correlation between the original strength/BEI scores and the new ones can remain high (> 0.7). For strength scores and BEI scores to be robust and interpretable, their CS-coefficients should at least be above .25, and ideally above .50, meaning that at least more than 25% of the data can be removed while the correlation between original indices and new ones are still above 0.7 (Epskamp et al., Citation2018). To assess if nodes’ edge-weight and strength are significantly different from each other, we conducted a set of two significance tests in each cross-sectional undirected network.
Finally, to estimate the directed structure of the depression and PTSD symptoms, a directed acyclic graph (DAG) was applied to the longitudinal change trajectory data derived from the OLS regression as detailed above. DAG is a Bayesian network approach that provides information not only about the strength but also about the direction of connections between nodes (Scutari & Denis, Citation2014). As the DAG is directed and has no feedback loop (i.e. acyclic), it provides preliminary inference about the causal relationships among nodes (Pearl, Citation2009). In DAG, upstream nodes have predictive priority and may be considered as the causes of downstream nodes (Moffa et al., Citation2017).
Specifically, the DAG was modelled via the Hill-Climbing algorithm using the hc() function of the bnlearn package (Scutari, Citation2010). Three steps were taken to ensure model stability (Scutari & Nagarajan, Citation2013). First, we performed 50 random re-starts and 100 perturbations for each re-start. We ran 50 different random starts to avoid local maxima and 100 perturbations to iteratively insert, remove, or reverse an edge to determine the best-fitting structure of the DAG based on the optimization of the goodness-of-fit index (i.e. BIC values). Doing so allows us to generate an initial DAG with our data. Second, we bootstrapped 10,000 DAGs to obtain edge frequency and compute the significance, direction, and strength of the edges (McNally et al., Citation2017). Specifically, if an edge is above an empirical threshold estimated using the bootstrapped networks, it is considered as statistically significant and therefore will be retained (Scutari & Nagarajan, Citation2013). This approach ensures a good balance between sensitivity and specificity. The final direction of the retained edges was then determined using majority voting, that is, the direction of the arrow that appears in at least 51% of the 10,000 bootstrapped networks. The thickness of each edge indicates the percentage of the times the edge goes in the direction depicted in the final visualization. Because plotting the DAG at T1 also generates valuable information about initial symptom activation pathways in the immediate aftermath of the unprecedented lockdown, we repeated the same analyses using T1 data to generate a second DAG, which is presented in Figure S15 in the Supplementary Materials.
3. Results
PTSD and depression symptoms description with their corresponding identification number and descriptive statistics at all waves are presented in . The five undirected networks of PTSD and depression are depicted in . The strength centrality and bridge centrality ranking of all nodes is visualized in and . The correlation stability (CS) coefficients of the strength centrality score and bridge BEI bridge centrality scores ranged from .52 to .59 across time points, suggesting excellent stability (Figures S1 and S2). Highly robust central nodes, or nodes that consistently appear as central nodes across four time points, were the depressive symptoms of ‘depressed mood’, ‘sadness’, and PTSD symptom of ‘irritability/anger’ (). Likewise, highly robust bridge nodes, or nodes consistently identified as bridge nodes across all time points included the depressive symptoms of ‘sleep disturbance’ and PTSD symptoms of ‘restless sleep’ and ‘irritability/anger’ (). Additional information on each cross-sectional undirected network’s edge-weights confidence intervals (CIs), edge difference, and node strength difference can be found in the online Supplementary Materials (Figures S3–S14).
Figure 1. (a–e) Undirected networks of PTSD and depression symptoms at T1 (a; N = 340), at T2 (b; N = 311), at T3 (c; N = 290), T4 (d; N = 288), and T1–T4 longitudinal slopes network (e; N = 254).
Notes: C1 = Feel bothered. C2 = Poor appetite. C3 = Feel blue. C4 = Lack feeling good. C5 = Trouble keeping my mind. C6 = Depressed mood. C7 = Effortful. C8 = Hopelessness. C9 = Feel failure. C10 = Fearful. C11 = Restless sleep. C12 = Lack happiness. C13 = Talk less. C14 = Lonely. C15 = Find people unfriendly. C16 = Lack enjoyment. C17 = Crying. C18 = Sadness. C19 = Feel disliked. C20 = Cannot get going. P1 = Intrusive thought. P2 = Nightmare. P3 = Flashback. P4 = Emotional cue. P5 = Physiological cue. P6 = Avoid thought. P7 = Upset. P8 = Avoid reminder. P9 = Loss of interest. P10 = Detachment. P11 = Restricted affect. P12 = Foreshortened future. P13 = Sleep disturbance. P14 = Irritability/anger. P15 = Difficulty concentrating. P16 = Hypervigilance. P17 = Exaggerated startle. Blue edges indicate positive associations between nodes, while red edges indicate negative associations. Thickness of edges indicate their strength. Light-blue nodes are bridge nodes identified via the bridge expected influence (BEI) scores. Orange nodes are individual items of CES-D not identified as bridge nodes. Green nodes are individual items of PDS-C not identified as bridge nodes.
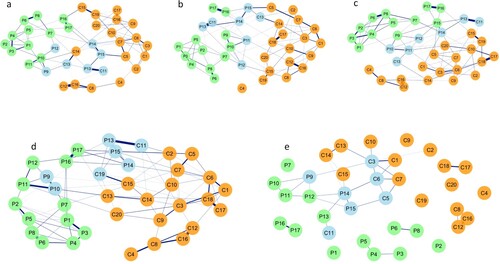
Figure 2. Symptom centrality plots based on the strength centrality index of cross-sectional undirected networks (T1, T2, T3, T4) and longitudinal change trajectory slope network.
Notes: (R) = reverse scored and worded. Bother = Feel bothered. PAppetite = Poor appetite. Blue = Feel blue. Good (R) = Lack feeling good. Mindless = Trouble keeping my mind. Depressed = Depressed mood. Effort = Effortful. Hope (R) = Hopelessness. Failure = Feel failure. Fear = Fearful. RestSleep = Restless sleep. Happy (R) = Lack happiness. TalkLess = Talk less. Lonely = Lonely. Unfriendly = Find people unfriendly. Enjoy (R) = Lack enjoyment. Cry = Crying. Sad = Sadness. Disliked = Feel disliked. NotGetGo = Cannot get going. ThIntrusive = Intrusive thought. Nightmare = Nightmare. Flashback = Flashback. EmoReact = Emotional cue. PhyReact = Physiological cue. ThAvoid = Avoid thought. Upset = Upset. RemAvoid = Avoid reminder. LInterest = Loss of interest. Detach = Detachment. RestrictA = Restricted affect. FortFuture = Foreshortened future. DisSleep = Sleep disturbance. Irritate = Irritability/anger. DiffConcen = Difficulty concentrating. HVigilant = Hypervigilance. Startle = Exaggerated startle.
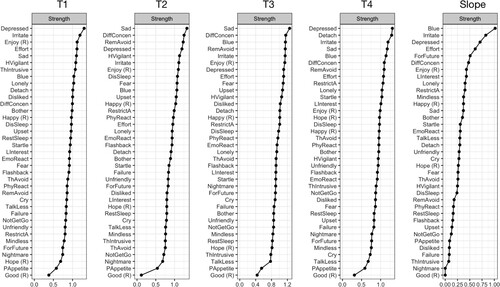
Figure 3. Symptom bridge centrality plots based on the bridge expected influence (BEI) index of cross-sectional undirected networks (T1, T2, T3, T4) and longitudinal change trajectory slope network.
Notes: (R) = reverse scored and worded. Bother = Feel bothered. PAppetite = Poor appetite. Blue = Feel blue. Good (R) = Lack feeling good. Mindless = Trouble keeping my mind. Depressed = Depressed mood. Effort = Effortful. Hope (R) = Hopelessness. Failure = Feel failure. Fear = Fearful. RestSleep = Restless sleep. Happy (R) = Lack happiness. TalkLess = Talk less. Lonely = Lonely. Unfriendly = Find people unfriendly. Enjoy (R) = Lack enjoyment. Cry = Crying. Sad = Sadness. Disliked = Feel disliked. NotGetGo = Cannot get going. ThIntrusive = Intrusive thought. Nightmare = Nightmare. Flashback = Flashback. EmoReact = Emotional cue. PhyReact = Physiological cue. ThAvoid = Avoid thought. Upset = Upset. RemAvoid = Avoid reminder. LInterest = Loss of interest. Detach = Detachment. RestrictA = Restricted affect. FortFuture = Foreshortened future. DisSleep = Sleep disturbance. Irritate = Irritability/anger. DiffConcen = Difficulty concentrating. HVigilant = Hypervigilance. Startle = Exaggerated startle.
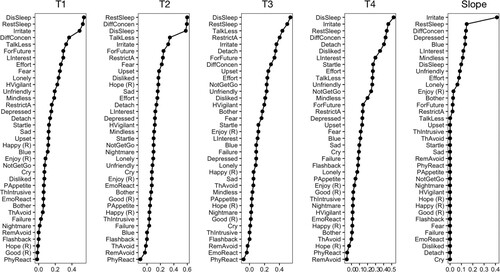
Table 1. Item description, identification number, and descriptive statistics of PDS-C and CES-D nodes at T1–4.
In the immediate aftermath of the strict lockdowns (T1), the most central symptoms include the depressive symptoms of ‘depressed mood’, ‘lack enjoyment’, ‘effortful’, ‘sadness’, and PTSD symptoms of ‘irritability/anger’, ‘hypervigilance’, and ‘intrusive thought’, suggesting that these symptoms displayed the most and greatest connections with other symptoms in the entire network. Using the 80th percentile cutoff, we identified several bridge nodes including the depressive symptoms of ‘restless sleep’, and ‘talk less’ and PTSD symptoms of ‘sleep disturbance’, ‘irritability/anger’, ‘difficulty concentrating’, ‘foreshortened future’, and ‘loss of interest’ ((a)).
Two months following the lifting of the lockdowns (T2), the most central symptoms include the depressive symptoms of ‘sadness’, ‘depressed mood’, and ‘lack enjoyment’ and PTSD symptoms of ‘difficulty concentrating’, ‘avoid reminder’, ‘hypervigilance’, ‘irritability/anger’, suggesting that these symptoms displayed the highest number of and magnitude of connections with other symptoms in the T2 undirected network. At T2, we identified several bridge nodes including the depressive symptoms of ‘restless sleep’ and ‘talk less’, and PTSD symptoms of ‘sleep disturbance’, ‘difficulty concentrating’, ‘irritability/anger’, ‘foreshortened future’ and ‘restricted affect’ ((b)).
Four months following the lifting of the lockdowns (T3), the most central symptoms include the depressive symptoms of ‘sadness’, ‘feel blue’, ‘lack enjoyment’, and ‘depressed mood’ and PTSD symptoms of ‘difficulty concentrating’, ‘avoid reminder’, and ‘irritability/anger’, suggesting that these symptoms displayed the highest number of and magnitude of connections with other symptoms in T3 undirected network. At T3, bridge nodes were the depressive symptoms of ‘restless sleep’ and ‘talk less’, and PTSD symptoms of ‘sleep disturbance’, ‘restricted affect’, ‘irritability/anger’, ‘detachment’, and ‘foreshortened future’ ((c)).
Half a year following the lifting of the lockdowns (T4), the most central symptoms include the depressive symptoms of ‘depressed mood’, ‘sadness’, and ‘feel blue’, and PTSD symptoms of ‘detachment’, ‘irritability/anger’, ‘difficulty concentrating’, and ‘avoid reminder’, suggesting that these symptoms displayed the highest number of and magnitude of connections with other symptoms in T4 network. At T4, bridge nodes included the depressive symptoms of ‘restless sleep’, ‘feeling disliked’, and PTSD symptoms of ‘sleep disturbance’, ‘irritability/anger’, ‘difficulty concentrating’, ‘detachment’, and ‘loss of interest’ ((d)).
The network comparison tests revealed non-significant differences in network structures and global strength between T1 and T4, p.s. > .05, and suggest that the network structure and its global strength are highly consistent over time.
The change trajectory network is depicted in (e). Of particular note, the nodes identified as central nodes and bridge nodes in the longitudinal change trajectory network are very similar to those identified in the cross-sectional undirected networks. Specifically, the most central nodes included the depressive symptoms of ‘feel blue’, ‘depressed mood’, ‘effortful’, and ‘lack enjoyment’, and PTSD symptoms of ‘irritability/anger’, ‘foreshortened future’, and ‘difficulty concentrating’. In the longitudinal network, bridge nodes included the depressive symptoms of ‘restless sleep’, ‘depressed mood’, ‘feel blue’, and ‘trouble keeping my mind’, and PTSD symptoms of ‘irritability/anger’, and ‘difficulty concentrating’, and ‘loss of interest’. The correlation of strength centrality scores between the change trajectory network and the cross-sectional ones ranged from .50 to .61, p.s. < .05, which were highly comparable to the results of previous studies that conducted longitudinal network analysis(Miers et al., Citation2020). The correlations of the BEI scores between the change trajectory network and the cross-sectional ones (i.e. T1 to T4) were also high, ranging from .38 to .66, p.s. < .05.
The results of the non-overlapping co-morbid network analysis on each time point’s data and the longitudinal slope data revealed that slightly different bridging symptoms emerged in each analysis. At T1, ‘Irritability/anger (P14)’, ‘Foreshortened future (P12)’, ‘Fearful (C10)’, ‘Effortful (C7)’, ‘Lonely (C14)’, and ‘Talk less (C13)’ emerged as bridging symptoms. At T2, ‘Irritability/anger (P14)’, ‘Foreshortened future (P12)’, ‘Restricted affect (P11)’, ‘Fearful (C10)’, ‘Talk less(C13)’, and ‘Upset (P7)’ emerged as bridging symptoms. At T3, ‘Irritability/anger (P14)’, ‘Restricted affect (P11)’, ‘Foreshortened future (P12)’, ‘Talk less (C13)’, ‘Detachment (P10)’ and ‘Avoid reminder (P7)’ emerged as bridging symptoms. At T4, ‘Irritability/anger (P14)’, ‘Detachment (P10)’, ‘Exaggerated startle (P17)’, ‘Feel disliked (C19)’, ‘Talk less (C13)’ ‘Cannot get going (C20)’ emerged as bridging symptoms. Longitudinally, ‘Irritability/anger (P14)’, ‘Depressed mood(C6)’, ‘Find people unfriendly (C15)’, ‘Lonely (C14)’, ‘Feel blue (C3)’, and ‘Restricted affect(P11)’ emerged as bridging symptoms.
The DAG incorporating the longitudinal information of our data is depicted in . Symptoms at the top possess higher predictive and potentially causal priority vs other symptoms. The network structure and node positions in the longitudinal DAG are largely replicated in the T1 DAG (Figure S15).
Figure 4. A directed acyclic graph (DAG) of PTSD and depression symptom change trajectories over time (N = 254).
Notes: (R) = reverse scored and worded. Bother = Feel bothered. PAppetite = Poor appetite. Blue = Feel blue. Good (R) = Lack feeling good. Mindless = Trouble keeping my mind. Depressed = Depressed mood. Effort = Effortful. Hope (R) = Hopelessness. Failure = Feel failure. Fear = Fearful. RestSleep = Restless sleep. Happy (R) = Lack happiness. TalkLess = Talk less. Lonely = Lonely. Unfriendly = Find people unfriendly. Enjoy (R) = Lack enjoyment. Cry = Crying. Sad = Sadness. Disliked = Feel disliked. NotGetGo = Cannot get going. ThIntrusive = Intrusive thought. Nightmare = Nightmare. Flashback = Flashback. EmoReact Emotional cue. PhyReact = Physiological cue. ThAvoid = Avoid thought. Upset = Upset. RemAvoid = Avoid reminder. LInterest = Loss of interest. Detach = Detachment. RestrictA = Restricted affect. FortFuture = Foreshortened future. DisSleep = Sleep disturbance. Irritate = Irritability/anger. DiffConcen = Difficulty concentrating. HVigilant = Hypervigilance. Startle = Exaggerated startle.
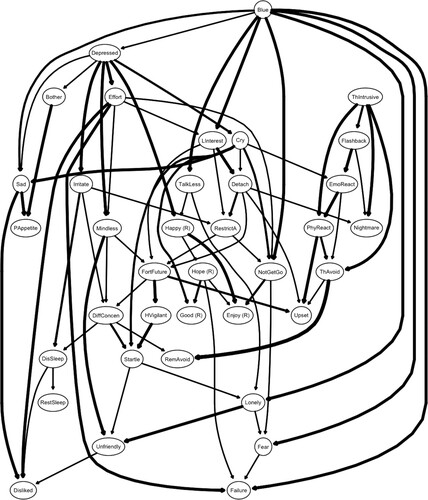
The longitudinal DAG highlights the predictive priority of depressive symptoms. The depressive symptoms of ‘feel blue’ and ‘depressed mood’ occupy, respectively, the highest and the second-highest positions in the DAG visualization, influencing a large set of symptoms below them. Not surprisingly, there is also a degree of separation between depressive and PTSD symptoms, as indicated by two major branches of nodes. In the left branch, the feeling of blue – the depressive symptom arising at the top – activates mostly depressive symptoms including ‘depressed mood’, ‘sadness’, ‘talk less’, ‘cannot get going’, ‘lonely’, ‘feel failure’, and ‘fearful’ and the PTSD symptom of ‘loss of interest’. The depressive symptoms of ‘depressed mood’ then activate mainly depressive symptoms including ‘sadness’, ‘feeling bothered’, ‘trouble keeping my mind’, ‘effortful’, ‘lack happiness’ and ‘cry’ and the PTSD symptom of ‘irritability/anger’. These nodes then activated a cascade of both depressive and PTSD symptoms. In this cascade, it is of note that the PTSD symptoms of ‘foreshortened future’, ‘hypervigilance’, ‘difficulty’, ‘sleep disturbance’, ‘exaggerated startle’, and ‘avoid reminder’ cluster together with some influencing the others. In the right branch, which is of a smaller size, the PTSD symptom of ‘intrusive thought’ was not activated by any depressive symptom and forms its own branch that consists of only PTSD symptoms including ‘flashback’, ‘emotional cue’, ‘physiological cue’, ‘nightmare’, ‘avoid thought’, and ‘upset’.
4. Discussion
Network models offer empirical tools to visualize interactions and identify potentially causal relationships among psychopathology symptoms. However, previous research has relied primarily on cross-sectional data (McNally et al., Citation2017; Qi et al., Citation2021), with only few exceptions (Miers et al., Citation2020; von Klipstein et al., Citation2021). The present study used three network analytic approaches to model the relationships among symptoms of depression and PTSD across four time points in a sample of Hubei residents. As the first place where COVID-19 was first reported, Hubei was hit hard by the influence of unexpected and strict lockdown measures, providing an opportunity to gain critical insight into how depression and PTSD were developed and maintained under this unprecedented historical context.
To begin, we used Gaussian graphical model regularized with LASSO penalties to identify the network structure of depression and PTSD. In particular, we examined the most central nodes, which may drive the largest number of other symptoms, and the most influential bridge nodes, which may explain comorbidity. Across waves, the most central depressive symptoms consistently included sadness and depressed mood. The most central PTSD symptoms, however, appeared to change over time, with irritability and hypervigilance at T1 and gradually shifting to difficulty concentrating and avoidance of potential reminders at later waves. Although irritability was also identified as the most central symptom in a sample of Chinese students during the COVID-19 lockdown (Sun et al., Citation2021), other studies examining networks comprising only PTSD symptoms have found flashbacks as one of the most central symptoms (Sun et al., Citation2021; Yang et al., Citation2021). As one possible reason for the discrepancy, our network estimation included depression in addition to PTSD symptoms, thereby possibly changing the internal partial correlation patterns within the PTSD symptom community. Since central symptoms of PTSD varied over time in our study, it is also likely that the time of symptom assessment may contribute to the differences in findings. Another interesting phenomenon is the change in central PTSD symptoms over time, likely related to the changes in experience during the pandemic. As lockdown measures gradually elevated and residents attempted to return to normalcy, the perceived threat of COVID-19 may decrease, making hypervigilance and irritability less prominent than symptoms of avoidance and attention deficits. Aside from central symptoms, we examined the most influential bridge nodes between PTSD and depression, which included sleep disturbance, difficulty concentrating, loss of interest, psychomotor retardation (i.e. talk less), restricted affect, and foreshortened future. In recent network analyses on adolescent depression and PTSD following either Typhoon Lekima or the COVID-19 outbreak, researchers identified similar bridge symptoms such as sleep disturbance and difficulty concentrating (Qi et al., Citation2021), a finding consistent with previous research that overlapping symptoms of PTSD and depression play a role in their comorbidity (Afzali et al., Citation2017; Lazarov et al., Citation2020). At the same time, the presence of psychomotor retardation, restricted affect, and foreshortened future as bridge between depression and PTSD is consistent with claim that comorbidity between PTSD and depression is not just an artefact of overlapping symptoms (Angelakis & Nixon, Citation2015). Rather, there appear to be more unique pathways between the two (Lazarov et al., Citation2020). For example, removing overlapping symptoms of PTSD and depression does not collapse the comorbidity network (Afzali et al., Citation2017). In our study, ‘Foreshortened future’ and ‘Talk less’, a psychomotor retardation manifestation, were identified as bridging symptoms in our non-overlapping cross-sectional networks, which was consistent with Afzali et al. (Citation2017). These authors identified ‘foreshortened future’ and ‘psychomotor retardation’ as bridging symptoms, in addition to ‘feelings of guilt’, ‘feeling sad’, and ‘flashbacks’, in their non-overlapping co-morbid network. Overall, these findings highlight central roles of depressed mood, sadness, irritability, difficulty concentrating, and hypervigilance with some temporal variability, and underscore the critical bridging capacity of several conceptually overlapping (sleep disturbance, difficulty concentrating, loss of interest) and non-overlapping (psychomotor retardation, restricted affect, foreshortened future) nodes.
Next, we used slopes of change in each symptom across four assessments to rerun the Gaussian graphical models. The most central nodes were similar to those identified in the cross-sectional undirected network, a finding consistent with recent research showing that parameters from baseline partial correlation networks are strongly associated with longitudinal network of change (von Klipstein et al., Citation2021). Unlike cross-sectional networks, the longitudinal network revealed that change – rather than the absolute score – of these central symptoms (e.g. depressed mood) were influencing changes in the rest of the symptoms. The bridge nodes in the longitudinal network included irritability, depressed mood, and difficulty concentrating, followed by symptoms related to feeling blue, sleep disturbance, and loss of interest. In other words, the change in these symptoms was bridging change in symptoms across two psychopathology communities. Previous studies have shown that PTSD had a non-specific component of dysphoria (Elklit et al., Citation2010), which may contribute to the emergence of depressed mood as bridge between depression and PTSD. The cross-sectional and longitudinal undirected networks suggest that PTSD and depression are bridged by both overlapping and non-overlapping symptoms. However, given that the GGM networks are undirected, they cannot determine whether a certain symptom is the cause of another symptom, or vice versa.
Finally, we used the directed acyclic graph with node change trajectories (i.e. slope) of each symptom to assess which carry a higher risk of leading a system into a psychopathological state (Hofmann et al., Citation2016). Bayesian network like DAG can reveal the predictive priority of symptoms in a given network system. According to our findings, feeling blue and intrusive thoughts may serve as the gateway to the emergence of other symptoms in the context of the COVID-19 epidemic. Despite some degree of separation, symptoms of PTSD and depression were highly intertwined. In contrast to the present study, a network analysis of PTSD and depressive symptoms in combat Veterans identified flashbacks as the trigger with highest predictive priority (Lazarov et al., Citation2020). This suggests that context plays a critical role in the symptom structure of depression and PTSD. Amidst strict lockdowns, Hubei residents were faced with fear, financial difficulties, decreased access to routine healthcare and food supplies, and forced isolation. Although these challenges may contribute to elevated distress (Brooks et al., Citation2020), our lockdown sample did not likely experience highly aversive and acute events such as combat exposures.
This study has a number of strengths. This is the first study to explore directed and undirected networks of PTSD and depression with longitudinal data. Specifically, by incorporating change trajectories over time, we were able to establish how changes, in addition to cross-sectional assessments of, symptoms were related. Despite the considerable similarities between cross-sectional and longitudinal networks in centrality, the fact that irritability exhibited much higher bridging capacities than any other symptoms in the longitudinal but not cross-sectional networks suggested some differences between the two. Though previous research has shown similarity between baseline and change networks (von Klipstein et al., Citation2021), this study was the first to compare their bridge centralities. Our findings suggest that longitudinal network provided additional information and was not a mere replication of cross-sectional network. Further, we examined both central symptoms across communities (i.e. the most important symptoms in PTSD and depression) and influential bridge symptoms between communities (i.e. symptoms bridging PTSD and depression), which afforded insight into potential targets in prevention and intervention of comorbid depression and PTSD. Finally, this was the first study that examined symptom networks of PTSD and depression among residents of Hubei, a place where COVID-19 first emerged. Findings from this study may help better understand and manage symptoms of PTSD and depression as the pandemic continues to impact the society.
This study also has several limitations. First, the reliance of self-report rather than clinical interview likely limits the reliability of our findings, though in a community sample, such approach is adopted to increase the likelihood of assessing more individuals for more time points. Future studies should consider replicating these analyses in samples with clinical interview data. Second, not all symptoms of PTSD and depression – based on DSM-5 – are assessed by the measures used in this study, which may impede a more wholistic understanding of PTSD-depression network. Third, although some of our participants were hospitalized or had family members who died from COVID-19, many did not necessarily meet Criterion A. Those who met Criterion A may likely exhibit different network structures. Future studies should compare network structures of PTSD symptoms with and without Criterion A during COVID-19 lockdowns to empirically investigate if there is any difference. Fourth, our snowball sampling method recruiting participants from social media platforms resulted in more female and young adult participants, which may limit sample representativeness and result generalizability.
In conclusion, this study used several network approaches to model longitudinal structural pathways of depression and PTSD. The most central depression symptoms consistently over time were depressed mood and feeling blue. However, the most central PTSD symptoms changed from irritability and hypervigilance at the early stage to difficulty concentrating and avoidance. The influential bridge between PTSD and depression involved sleep disturbance, difficulty concentrating, irritability, loss of interest, psychomotor retardation (i.e. talk less), restricted affect, and foreshortened future. Finally, feeling blue and intrusive thoughts exhibited the greatest predictive priority and may trigger a cascade of other symptoms. Together, these findings illustrate how the cascade of depression and PTSD symptoms contributes to the development and maintenance of comorbidity over time.
Open Scholarship

This article has earned the Center for Open Science badge for Open Data. The data are openly accessible at https://doi.org/10.34691/FK2/ULMNHV.
Supplemental Material
Download MS Word (4.6 MB)Acknowledgements
We thank all research assistants who help with recruitment and data collection. SC and PS designed the study. SC and KB analyzed the data. SC, KB, and SL completed the first draft under the supervision of GB and PS. All authors contributed to editing and approved the final version of the manuscript.
Disclosure statement
No potential conflict of interest was reported by the author(s).
Data availability statement
Data used in the analyses are available through the following OSF link: https://osf.io/kbxtc.
Additional information
Funding
References
- Adams, S. W., Bowler, R. M., Russell, K., Brackbill, R. M., Li, J., & Cone, J. E. (2019). PTSD and comorbid depression: Social support and self-efficacy in world trade center tower survivors 14–15 years after 9/11. Psychological Trauma: Theory, Research, Practice, and Policy, 11(2), 156–164. https://doi.org/10.1037/tra0000404
- Afzali, M. H., Sunderland, M., Teesson, M., Carragher, N., Mills, K., & Slade, T. (2017). A network approach to the comorbidity between posttraumatic stress disorder and major depressive disorder: The role of overlapping symptoms. Journal of Affective Disorders, 208, 490–496. https://doi.org/10.1016/j.jad.2016.10.037
- Angelakis, S., & Nixon, R. D. V. (2015). The comorbidity of PTSD and MDD: Implications for clinical practice and future research. Behaviour Change, 32(1), 1–25. https://doi.org/10.1017/bec.2014.26
- Borsboom, D. (2008). Psychometric perspectives on diagnostic systems. Journal of Clinical Psychology, 64(9), 1089–1108. https://doi.org/10.1002/jclp.20503
- Borsboom, D. (2017). A network theory of mental disorders. World Psychiatry, 16(1), 5–13. https://doi.org/10.1002/wps.20375
- Borsboom, D., & Cramer, A. O. J. (2013). Network analysis: An integrative approach to the structure of psychopathology. Annual Review of Clinical Psychology, 9(1), 91–121. https://doi.org/10.1146/annurev-clinpsy-050212-185608
- Brooks, S. K., Webster, R. K., Smith, L. E., Woodland, L., Wessely, S., Greenberg, N., & Rubin, G. J. (2020). The psychological impact of quarantine and how to reduce it: Rapid review of the evidence. The Lancet, 395(10227), 912–920. https://doi.org/10.1016/S0140-6736(20)30460-8
- Brown, L. A., Jerud, A., Asnaani, A., Petersen, J., Zang, Y., & Foa, E. B. (2018). Changes in posttraumatic stress disorder (PTSD) and depressive symptoms over the course of prolonged exposure. Journal of Consulting and Clinical Psychology, 86(5), 452–463. https://doi.org/10.1037/ccp0000292
- Bryant, R. A., Creamer, M., O’Donnell, M., Forbes, D., McFarlane, A. C., Silove, D., & Hadzi-Pavlovic, D. (2017). Acute and chronic posttraumatic stress symptoms in the emergence of posttraumatic stress disorder: A network analysis. JAMA Psychiatry, 74(2), 135–142. https://doi.org/10.1001/jamapsychiatry.2016.3470
- Costantini, G., Epskamp, S., Borsboom, D., Perugini, M., Mõttus, R., Waldorp, L. J., & Cramer, A. O. J. (2015). State of the aRt personality research: A tutorial on network analysis of personality data in R. Journal of Research in Personality, 54, 13–29. https://doi.org/10.1016/j.jrp.2014.07.003
- Elklit, A., Armour, C., & Shevlin, M. (2010). Testing alternative factor models of PTSD and the robustness of the dysphoria factor. Journal of Anxiety Disorders, 24(1), 147–154. https://doi.org/10.1016/j.janxdis.2009.10.002
- Epskamp, S., Waldorp, L. J., Mõttus, R., & Borsboom, D. (2018). The Gaussian graphical model in cross-sectional and time-series data. Multivariate Behavioral Research, 53(4), 453–480. https://doi.org/10.1080/00273171.2018.1454823
- Feng, E., & Cheng, A. (2020). Restrictions and rewards: How China is locking down half a billion citizens. https://www.npr.org/sections/goatsandsoda/2020/02/21/806958341/restrictions-and-rewards-how-china-is-locking-down-half-a-billion-citizens
- Foygel, R., & Drton, M. (2011). Bayesian model choice and information criteria in sparse generalized linear models. ArXiv. https://doi.org/10.48550/ARXIV.1112.5635
- Fried, E. I., van Borkulo, C. D., Cramer, A. O. J., Boschloo, L., Schoevers, R. A., & Borsboom, D. (2017). Mental disorders as networks of problems: A review of recent insights. Social Psychiatry and Psychiatric Epidemiology, 52(1), 1–10. https://doi.org/10.1007/s00127-016-1319-z
- Friedman, J., Hastie, T., & Tibshirani, R. (2011). Glasso: Graphical LASSO-estimation of Gaussian graphical models (R package Version 1.7).
- Gruber, J., Prinstein, M. J., Clark, L. A., Rottenberg, J., Abramowitz, J. S., Albano, A. M., Aldao, A., Borelli, J. L., Chung, T., Davila, J., Forbes, E. E., Gee, D. G., Hall, G. C. N., Hallion, L. S., Hinshaw, S. P., Hofmann, S. G., Hollon, S. D., Joormann, J., Kazdin, A. E., … Weinstock, L. M. (2021). Mental health and clinical psychological science in the time of COVID-19: Challenges, opportunities, and a call to action. American Psychologist, 76(3), 409–426. https://doi.org/10.1037/amp0000707
- Hofmann, S. G., Curtiss, J., & McNally, R. J. (2016). A complex network perspective on clinical science. Perspectives on Psychological Science, 11(5), 597–605. https://doi.org/10.1177/1745691616639283
- Jiang, H., Fei, X., Liu, H., Roeder, K., Lafferty, J., & Wasserman, L. (2019). Huge: High-dimensional undirected graph estimation (R package version 1.3.2).
- Jones, P. J., Ma, R., & McNally, R. J. (2021). Bridge centrality: A network approach to understanding comorbidity. Multivariate Behavioral Research, 56(2), 353–367. https://doi.org/10.1080/00273171.2019.1614898
- Karatzias, T., Shevlin, M., Murphy, J., McBride, O., Ben-Ezra, M., Bentall, R. P., Vallières, F., & Hyland, P. (2020). Posttraumatic stress symptoms and associated comorbidity during the COVID-19 pandemic in Ireland: A population-based study. Journal of Traumatic Stress, 33(4), 365–370. https://doi.org/10.1002/jts.22565
- Kessler, R. C. (1995). Posttraumatic stress disorder in the national comorbidity survey. Archives of General Psychiatry, 52(12), 1048. https://doi.org/10.1001/archpsyc.1995.03950240066012
- Lazarov, A., Suarez-Jimenez, B., Levi, O., Coppersmith, D. D. L., Lubin, G., Pine, D. S., Bar-Haim, Y., Abend, R., & Neria, Y. (2020). Symptom structure of PTSD and co-morbid depressive symptoms – a network analysis of combat veteran patients. Psychological Medicine, 50(13), 2154–2170. https://doi.org/10.1017/S0033291719002034
- McNally, R. J. (2012). The ontology of posttraumatic stress disorder: Natural kind, social construction, or causal system? Clinical Psychology: Science and Practice, 19(3), 220–228. https://doi.org/10.1111/cpsp.12001
- McNally, R. J. (2016). Can network analysis transform psychopathology? Behaviour Research and Therapy, 86, 95–104. https://doi.org/10.1016/j.brat.2016.06.006
- McNally, R. J., Mair, P., Mugno, B. L., & Riemann, B. C. (2017). Comorbid obsessive–compulsive disorder and depression: A Bayesian network approach. Psychological Medicine, 47(7), 1204–1214. https://doi.org/10.1017/S0033291716003287
- McNally, R. J., Robinaugh, D. J., Deckersbach, T., Sylvia, L. G., & Nierenberg, A. A. (2022). Estimating the symptom structure of bipolar disorder via network analysis: Energy dysregulation as a central symptom. Journal of Psychopathology and Clinical Science, 131(1), 86–97. https://doi.org/10.1037/abn0000715
- Miers, A. C., Weeda, W. D., Blöte, A. W., Cramer, A. O. J., Borsboom, D., & Westenberg, P. M. (2020). A cross-sectional and longitudinal network analysis approach to understanding connections among social anxiety components in youth. Journal of Abnormal Psychology, 129(1), 82–91. https://doi.org/10.1037/abn0000484
- Moffa, G., Catone, G., Kuipers, J., Kuipers, E., Freeman, D., Marwaha, S., Lennox, B. R., Broome, M. R., & Bebbington, P. (2017). Using directed acyclic graphs in epidemiological research in psychosis: An analysis of the role of bullying in psychosis. Schizophrenia Bulletin, 43(6), 1273–1279. https://doi.org/10.1093/schbul/sbx013
- Nichter, B., Haller, M., Norman, S., & Pietrzak, R. H. (2020). Risk and protective factors associated with comorbid PTSD and depression in U.S. military veterans: Results from the national health and resilience in veterans study. Journal of Psychiatric Research, 121, 56–61. https://doi.org/10.1016/j.jpsychires.2019.11.008
- Opsahl, T., Agneessens, F., & Skvoretz, J. (2010). Node centrality in weighted networks: Generalizing degree and shortest paths. Social Networks, 32(3), 245–251. https://doi.org/10.1016/j.socnet.2010.03.006
- Pearl, J. (2009). Causal inference in statistics: An overview. Statistics Surveys, 3, 96–145. https://doi.org/10.1214/09-SS057
- Qi, J., Sun, R., & Zhou, X. (2021). Network analysis of comorbid posttraumatic stress disorder and depression in adolescents across COVID-19 epidemic and typhoon lekima. Journal of Affective Disorders, 295, 594–603. https://doi.org/10.1016/j.jad.2021.08.080
- R Core Team. (2021). R: A language and environment for statistical computing. R Foundation for Statistical Computing. https://www.R-project.org/.
- Radloff, L. S. (1977). The CES-D scale: A self-report depression scale for research in the general population. Applied Psychological Measurement, 1(3), 385–401. https://doi.org/10.1177/014662167700100306
- Scutari, M. (2010). Learning Bayesian networks with the bnlearn R package. Journal of Statistical Software, 35(3), 1–22. https://doi.org/10.18637/jss.v035.i03
- Scutari, M., & Denis, J. (2014). Bayesian networks: With examples in R (1st ed.). CRC Press.
- Scutari, M., & Nagarajan, R. (2013). Identifying significant edges in graphical models of molecular networks. Artificial Intelligence in Medicine, 57(3), 207–217. https://doi.org/10.1016/j.artmed.2012.12.006
- Shen, X., Xu, L., & Liu, H. (2014). The application of posttraumatic diagnostic scale-Chinese in an earthquake-exposed sample. Chinese Journal of Health Psychology, 22(1849–1851). https://doi.org/10.13342/j.cnki.cjhp.2014.12.033
- Sun, R., Qi, J., Huang, J., & Zhou, X. (2021). Network analysis of PTSD in college students across different areas after the COVID-19 epidemic. European Journal of Psychotraumatology, 12(1), 1920203. https://doi.org/10.1080/20008198.2021.1920203
- van Borkulo, C. D., van Bork, R., Boschloo, L., Kossakowski, J. J., Tio, P., Schoevers, R. A., Borsboom, D., & Waldorp, L. J. (2022). Comparing network structures on three aspects: A permutation test. Psychological Methods, https://doi.org/10.1037/met0000476
- von Klipstein, L., Borsboom, D., & Arntz, A. (2021). The exploratory value of cross-sectional partial correlation networks: Predicting relationships between change trajectories in borderline personality disorder. PLoS One, 16(7), e0254496. https://doi.org/10.1371/journal.pone.0254496
- Wakefield, J. C. (2007). The concept of mental disorder: Diagnostic implications of the harmful dysfunction analysis. World Psychiatry, 6(3), 149–156.
- Wang, X. D., Wang, X. L., & Ma, H. (1999). Rating scales for mental health. Chinese Mental Health Journal.
- Xiong, J., Lipsitz, O., Nasri, F., Lui, L. M. W., Gill, H., Phan, L., Chen-Li, D., Iacobucci, M., Ho, R., Majeed, A., & McIntyre, R. S. (2020). Impact of COVID-19 pandemic on mental health in the general population: A systematic review. Journal of Affective Disorders, 277, 55–64. https://doi.org/10.1016/j.jad.2020.08.001
- Yang, F., Fu, M., Huang, N., Ahmed, F., Shahid, M., Zhang, B., Guo, J., & Lodder, P. (2021). Network analysis of COVID-19-related PTSD symptoms in China: The similarities and differences between the general population and PTSD sub-population. European Journal of Psychotraumatology, 12(1), 1997181. https://doi.org/10.1080/20008198.2021.1997181