ABSTRACT
Background: Antonovsky’s concept of sense of coherence (SOC) – as a global orientation reflecting an individual’s feeling of confidence in both the predictability of their internal and external environment and their ability to cope with stressful and challenging situations in life – shows a negative association with symptoms of post-traumatic stress. However, single studies varying in study characteristics provide heterogeneous effect size estimations.
Objective: The purpose of the current study is to investigate the relationship between SOC and post-traumatic stress disorder (PTSD) symptom severity for the first time on a meta-analytical level.
Method: The random-effects meta-analysis is based on zero-order correlations (r) and consists of 47 independent samples out of 45 studies (N = 10,883).
Results: After correcting for sampling error, the mean correlation between SOC and PTSD symptoms was M(r) = −.41 (excluding four outliers: −.39). However, this effect could not be generalized to all types of PTSD samples owing to substantial remaining heterogeneity. Subsequent moderator analyses investigating the influence of different SOC and PTSD measures, trauma type and duration, mean age and gender imbalances per sample did not reveal significant moderating effects.
Conclusions: The meta-analysis reveals a substantial correlation between SOC and PTSD symptom severity: higher SOC levels are associated with lower symptom severity. Thus, future research should progress to the question of whether the relationship between SOC and post-traumatic stress is causal, and by which factors it is moderated.
Abbreviations: CD, Cook’s distance; DSM, Diagnostic and Statistical Manual of Mental Disorders; (G)RR, general (and specific) resistance resources; IES(-R), Impact of Event Scale (Revised); PDS, Posttraumatic Stress Diagnostic Scale; PRISMA, Preferred Reporting Items for Systematic Reviews and Meta-Analyses; PTSD, post-traumatic stress disorder; SDR, standard deleted residual; SOC, sense of coherence; SOC-R, Sense of Coherence Scale – Revised
HIGHLIGHTS
• This meta-analysis reports a robust correlation between sense of coherence (SOC) and post-traumatic stress disorder (PTSD) symptoms. • Higher SOC levels are linked to lower PTSD symptom scores. • No significant moderating effects were found for the correlation between SOC and PTSD symptoms. • There were homogeneous correlations for Holocaust and war traumas and enduring stressors. • Future research needs to investigate a potential causal relationship.
Antecedentes: El concepto de sentido de coherencia (SOC) de Antonovsky- como una orientación global reflejando el sentimiento de seguridad de un individuo, tanto en la previsibilidad de su ambiente interno y externo y su habilidad para enfrentar situaciones estresantes y desafiantes en su vida- muestra una asociación negativa con el estrés postraumático. Sin embargo, estudios individuales que varían en las características proporcionan estimaciones del tamaño del efecto heterogéneo.
Objetivo: El propósito de este estudio es investigar la relación entre SOC y severidad de los síntomas de TEPT por primera vez a un nivel metaanalítico.
Método: El metanálisis de efectos aleatorios se basa en correlaciones de orden cero (r) y consta de 47 muestras independientes de 45 estudios (N= 10.883).
Resultados: Después de corregir por error de muestreo, la correlación media entre SOC y síntomas de TEPT fue M(r) =−.41 (excluyendo cuatro valores atípicos: −.39). Sin embargo, este efecto podría no ser generalizado a todos los tipos de muestras de TEPT debido a la importante heterogeneidad restante. Los siguientes análisis del moderador investigan la influencia de diferentes mediciones de SOC y TEPT, tipo de trauma y duración, edad media y desbalance de género por muestra no revela efectos moderados significativos.
Conclusiones: El metanálisis revela una importante correlación entre SOC y severidad de los síntomas de TEPT: Niveles más altos de SOC están asociados con menor severidad de los síntomas. De este modo, las investigaciones futuras deberían progresar a la pregunta de si la relación entre SOC y estrés postraumático es causal, y por cuáles factores es moderada.
背景:Antonovsky的心理一致感(SOC)概念——作为反映个人对其内在和外在环境的可预测性及其应对生活中的压力和挑战的信心的整体取向——显示出与创伤后应激症状的负相关。然而,各个研究的特征不同导致了效应量估计的差异。
目的:本研究的目的是首次在元分析水平上研究SOC与PTSD症状严重程度之间的关系。
方法:随机效应元分析基于零阶相关(r),由45项研究中的47个独立样本组成(N = 10883)。
结果:在校正抽样误差后,SOC和PTSD症状之间的平均相关性为M(r)= −.41(不包括四个异常值:-.39)。然而,由于异质性依然明显存在,这种效应不能推广到所有类型的PTSD样品。之后使用调节分析考察不同SOC和 PTSD量表、创伤类型和持续时间、平均年龄和样本的性别失衡的影响,并未发现显著的调节作用。
结论:元分析显示SOC与PTSD症状严重程度之间存在显著相关性:较高的SOC水平与较低的症状严重程度相关。因此,未来的研究应该进展到SOC与创伤后应激之间的关系是否是因果关系以及由哪些因素调节。
1. Introduction
Post-traumatic stress disorder (PTSD) is a mental disorder that can develop in the aftermath of a traumatic event. Approximately seven out of 100 individuals will develop PTSD during their lifetime (de Vries & Olff, Citation2009), with the experience of man-made traumas being linked to a particularly high risk of PTSD development, longer symptom duration and slower symptom recovery (Kessler et al., Citation2017). Simultaneously, PTSD is associated with high personal and public healthcare costs (Lamoureux-Lamarche, Vasiliadis, Préville, & Berbiche, Citation2016; Walker et al., Citation2003).
Notably, not all trauma-exposed individuals develop PTSD, raising the question of which factors increase or lower the risk of PTSD development. Previous meta-analyses and review articles have primarily focused on risk factors that significantly increase the probability of PTSD development (Brewin, Andrews, & Valentine, Citation2000; DiGangi et al., Citation2013; Ozer, Best, Lipsey, & Weiss, Citation2003; Sareen, Citation2014). However, as it is equally important to identify factors linked to resilient outcomes, recent research has turned towards protective and resistance factors (Agaibi & Wilson, Citation2005; Hoge, Austin, & Pollack, Citation2007). In this context, sense of coherence (SOC), a key component of the salutogenesis framework (Antonovsky, Citation1979, Citation1987), is defined as ‘a global orientation that expresses the extent to which one has a pervasive and enduring, though dynamic, feeling of confidence that one’s internal and external environments are predictable, and that there is a high probability that things will work out as well as can reasonably be expected’ (Antonovsky, Citation1979; for a detailed introduction to salutogenesis and SOC, see Mittelmark et al., Citation2017). SOC uniquely combines relevant aspects of behavioural, cognitive and motivational resistance (Almedom, Citation2005; Mittelmark et al., Citation2017) and thus has an advantage over other resistance factors that may protect an individual from the negative effects of adversity (e.g. self-efficacy, hardiness and trait-resilience). The SOC concept further comprises meaning making, one of the core aspects in established PTSD treatments (Schnyder et al., Citation2015). Because of this outstanding role of SOC as a resistance factor (Almedom & Glandon, Citation2007) and findings demonstrating the incremental validity of SOC above other factors in the prediction of PTSD symptomsFootnote1 (e.g. Glück, Tran, Raninger, & Lueger-Schuster, Citation2016; Streb, Häller, & Michael, Citation2014), the current meta-analysis aims to provide a first estimation of the mean population effect for the relationship between SOC – as a comprehensive resistance factor – and post-traumatic stress symptoms.
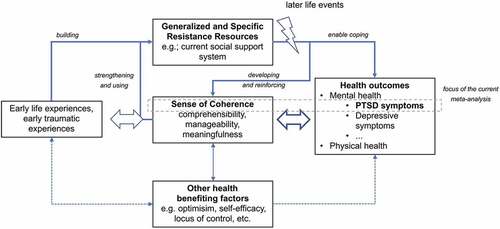
In contrast to other resistance factors, SOC may provide a fuller understanding of the dynamic processes resulting in resilient outcomes after stressful or traumatic life events. As displayed in , according to the salutogenic model, general (and specific) resistance resourcesFootnote2 [(G)RR] are formed during childhood and adolescence and result from specific characteristics of an individual, a group or a community, or even situations (Mittelmark et al., Citation2017). They facilitate coping with stressors and simultaneously enable the development (and subsequent reinforcement) of SOC. During adolescence, stressful life events are assumed to temporarily weaken the developing SOC but may nonetheless result in recovered or even higher levels of SOC if successfully managed (Braun-Lewensohn, Sagy, Sabato, & Galili, Citation2013). Consequently, individuals with a strong SOC are able to clarify and structure the nature of stressors (the ‘comprehensibility’ component of SOC) (Cederblad, Dahlin, Hagnell, & Hansson, Citation1994). Moreover, these individuals are certain of possessing sufficient resources [(G)RR, internal or external] that can be applied appropriately to different stressors (‘manageability’ component). They further believe that the emerging stressor is worth facing (‘meaningfulness’ component), providing them with the necessary motivation to apply an appropriate coping strategy. Thus, based on the salutogenic theory, the relationship between SOC and health, including post-traumatic stress, is mediated by the presence and subsequent appropriate use of (G)RR (Mittelmark et al., Citation2017). Unlike the relationship between SOC and health (Eriksson & Lindström, Citation2006), the mediating link of (G)RR has been less extensively studied (Mittelmark et al., Citation2017). However, those studies addressing these effects question the role of (G)RR as a mediating variable by ascertaining SOC as a mediator between (G)RR and health (Read, Aunola, Feldt, Leinonen, & Ruoppila, Citation2005) and by identifying SOC as an autonomous resource not necessarily depending on (G)RR (Suominen, Blomberc, Helenius, & Koskenvuo, Citation1999).
Figure 1. Schematic illustration of the theoretical framework concerning the relationship between sense of coherence and health outcomes, especially post-traumatic stress disorder (PTSD) symptom severity.
Concerning the relationship between SOC and PTSD symptoms, in line with the salutogenic theory, numerous cross-sectional studies (e.g. Kazlauskas, Gailiene, Vaskeliene, & Skeryte-Kazlauskiene, Citation2017; Veronese & Pepe, Citation2014) have described a negative relationship between SOC and PTSD symptom severity: higher SOC levels were linked to less severe PTSD symptoms in the aftermath of a stressful or traumatic event, whereby the relationship varied in size. However, less is known regarding SOC’s causal influence on PTSD development. To our knowledge, only one longitudinal study has provided insight into SOC’s role as a pre-trauma factor modulating individual responses to traumatic experiences. In a prospective study, Engelhard, van den Hout, and Vlaeyen (Citation2003) showed that high levels of SOC measured in early pregnancy predicted the occurrence of fewer PTSD symptoms after pregnancy loss. In line with the salutogenic theory, the authors concluded that individuals with high SOC levels may be more effective and/or efficient in mobilizing resources, i.e. (G)RR, after traumatic experiences. Accordingly, the relationship between SOC and PTSD symptoms was mediated by crisis support after pregnancy loss, which may relate to the more efficient use of (G)RR, resulting in better coping activities. Other studies that reported longitudinal findings on SOC and PTSD did not assess SOC as a pre-trauma factor (e.g. Schnyder, Moergeli, Klaghofer, & Buddeberg, Citation2001).
In addition, several studies have focused on the influence of traumatic events on individual SOC levels. Overall, the evidence suggests that SOC scores decline following stressful or traumatic life events (Carmel & Bernstein, Citation1989; Schnyder, Büchi, Sensky, & Klaghofer, Citation2000; Volanen, Suominen, Lahelma, Koskenvuo, & Silventoinen, Citation2007).
Hence, numerous cross-sectional studies identified SOC as an important correlate of PTSD symptom severity in the aftermath of a traumatic event. However, the magnitude of the relationship varied between studies, and research investigating the causal influence of SOC on PTSD symptom development is missing.
1.1. Investigated moderating variables
Given the outlined heterogeneity, it is crucial to understand which variables may explain differences in effect sizes.
1.1.1. Study and sample characteristics
Publication year is regularly investigated as a moderating variable, as the year of publication may reflect improvements of measures or study design over time. In addition, sample characteristics such as mean age or gender are examined, as they have been found to be relevant for PTSD (Olff, Citation2017) and SOC (Kivimäki, Feldt, Vahtera, & Nurmi, Citation2000).
1.1.2. SOC measure
Almost all studiesFootnote3 investigating the relationship between SOC and post-traumatic stress use the SOC scale developed by Antonovsky in its short 13-item version or its longer 29-item version as a quantitative measure of SOC (Antonovsky, Citation1987, Citation1993). Irrespective of their frequent use, Antonovsky’s SOC scales have been repeatedly criticized owing to psychometric and conceptual problems (Bachem & Maercker, Citation2018; Gruszczynska, Citation2006). Several studies showed that the three suggested factors, manageability, comprehensibility and meaningfulness, could not be identified using factor analysis (Flannery & Flannery, Citation1990; Frenz, Carey, & Jorgensen, Citation1993). Moreover, scores on the SOC scales and depression and anxiety scores were found to be highly correlated with zero-order correlations above r = −.70 for depression and r = −.80 for anxiety symptoms (Flannery & Flannery, Citation1990; Gruszczynska, Citation2006). Therefore, it has been argued that SOC – as operationalized by the Antonovsky scales (Citation1987, Citation1993) – is the opposite of depression or anxiousness and reflects general mental health rather than a discrete concept. In spite of this criticism, the use of either the short or the long version of the Antonovsky scales (Citation1987, Citation1993) should not influence the relationship between SOC and PTSD symptom severity if both scales target the same concept. However, if using the short or long version affected the results, this would point to undesirable method effects and further strengthen the methodological criticism of the Antonovsky scales (Citation1987, Citation1993).
1.1.3. PTSD measure
Similarly to SOC, PTSD symptoms can be assessed using different instruments. To investigate their influence on the relationship of interest, the two most frequently used questionnaires, the Impact of Event Scale (IES) (Horowitz, Wilner, & Alvarez, Citation1979) and the Posttraumatic Stress Diagnostic Scale (PDS) (Foa, Cashman, Jaycox, & Perry, Citation1997) as well as their more recent versions were coded as moderators to investigate method effects caused by the specific PTSD assessment.
1.1.4. Criterion A
Not all included studies explicitly state that participants’ traumatic experiences fulfilled criterion A according to the Diagnostic and Statistical Manual of Mental Disorders, 4th Edition, Text Revision (DSM-IV-TR) (American Psychiatric Association, Citation2000) or the Diagnostic and Statistical Manual of Mental Disorders, 5th Edition (DSM-5) (American Psychiatric Association, Citation2013). To fulfil criterion A of the DSM-5 PTSD criteria, an individual has to experience or personally witness a traumatic event or hear about trauma exposure of a close relative or friend. Furthermore, repeated indirect exposure to extremely aversive details of events in the course of professional duties (e.g. police officers, first responders) is also included in this definition (American Psychiatric Association, Citation2013). In some cases, criterion A was not ensured on an individual basis but had occurred in all likelihood (high-risk samples) while the events in other samples did not fulfil the diagnostic criterion (e.g. stressful life event as opposed to criterion A trauma). Therefore, it is plausible to assume that the relationship between SOC and PTSD symptom severity may vary between samples fulfilling the stringent criteria (criterion A ensured on an individual basis) and those that do not.
1.1.5. Type of trauma
A further frequently used categorization within PTSD relates to the nature of the experienced trauma, as different trauma types are linked to differing risks of PTSD development (Kessler et al., Citation2017). Therefore, the varying nature of the traumatic stressors, such as Holocaust and wartime experiences, accidents, medical treatment or chronic professional exposure to aversive situations, may also moderate the relationship between SOC and PTSD severity scores.
1.1.6. Acute versus chronic stressors
The nature of a stressor as rather acute or chronic (Baum, O’Keeffe, & Davidson, Citation1990) may also influence the relationship between SOC and PTSD symptom severity. Thus, traumatic stressors were coded as short (e.g. road traffic accidents) or enduring (e.g. Holocaust or war traumatization) and investigated as a potential moderator.
1.2. Aim of the current meta-analysis
In spite of the highlighted relevance of SOC in the context of PTSD, to date, a review and meta-analysis on the frequently studied relationship between SOC levels and PTSD symptom severity is still lacking. However, such a meta-analysis is essential to estimate the population effect and to test the relationship’s robustness across different sample types and other influencing variables. Based on the heterogeneity in the literature, it is important to answer two questions by meta-analytical means: (1) What is the magnitude of the relationship between SOC levels and PTSD symptom severity? (2) Is the relationship between SOC and PTSD moderated by study and sample characteristics, type of measure or type of traumatic stressor? Thus, the objectives of this meta-analysis are to provide a systematic overview of existing – nearly exclusively cross-sectional – studies and to estimate a mean weighted population correlation coefficient of the relationship between SOC and PTSD symptom severity for the first time. The derived findings will serve as a rationale and basis for future research to examine SOC’s precise mode of action with respect to PTSD development and course.
2. Methods
2.1. Literature search
This meta-analysis was prepared using the Preferred Reporting Items for Systematic Reviews and Meta-Analyses (PRISMA) guidelines set out by Moher, Liberati, Tetzlaff, and Altman; PRISMA Group (Citation2009).
2.2. Compilation of databases
First, the research team identified a set of relevant search terms by using brainstorming techniques and by considering Medical Subject Headings (MeSH) terms for PubMed searches. They were chosen to cover the most commonly used terms in the PTSD and SOC literature. Secondly, we conducted a literature search on title, abstracts and keywords (if possible) in five databases: EBSCOhost (PsycINFO and PsycARTICLES), Published International Literature on Traumatic Stress (PILOTS), PubMed (including MEDLINE), Scopus, and Web of Science. Further to identifying relevant records in these databases, Google Scholar was used as an inclusive search engine to search for potentially relevant papers that cited previously identified records. Search words, search engines and hits per search engine are displayed in . The search phase was completed on 30 April 2018.
Figure 2. Search terms and search engines, as well as hits per included database.
2.3. Inclusion criteria
Studies were included that met the following criteria. (1) The study used a sample of participants who either had experienced an event they may have perceived as traumatic or came from a population with an increased risk of having experienced a traumatic or stressful life event (such as refugees or those accessing addiction services). Some of the studies did not ensure that the reported events fulfilled criterion A of a traumatic stressor according to DSM-IV-TR or DSM-5 (American Psychiatric Association, Citation2000, Citation2013). However, owing to the wide range of events in the literature, it was decided to include these samples and to assess the difference in diagnostic accuracy as a moderating variable. (2) Either the study either reported zero-order correlations between SOC and PTSD severity, or the authors sent us such a correlation coefficient. (3) SOC and PTSD severity were both assessed using well-established questionnaires or a clinical interview including a severity rating in the case of PTSD. Studies were excluded if they assessed psychological distress but did not specifically report PTSD symptomatology, or if they assessed symptoms less than 1 month following the potentially traumatic event (i.e. identifying symptoms of acute stress disorder, rather than PTSD). (4) Participants were older than 18 years at the time of the assessment, although studies with participants older than 18 years who had experienced traumatic events as children were included. (5) The study or at least the abstract and all relevant information was published in the English language.
2.4. Exclusion of studies
In total, 492 studies were identified through database searches. Of these, 132 papers were excluded as duplicates, resulting in 360 studies of which title, abstract and keywords were checked for potential elligibility. Thereby, 259 records were excluded, resulting in 101 articles, the full texts of which were checked for meeting the inclusion criteria. Of these 101 articles, 60 did not fulfil the inclusion criteria. However, if the paper contained substantial information on the relationship between SOC and PTSD severity but no correlation coefficient was reported (e.g. regression coefficients in a non-bivariate model), we contacted the authors by email and asked them to send us the relevant zero-order correlation. By this means, two additional correlations could be included. Subsequently, Google Scholar was used to identify and inspect all articles citing the hitherto included studies based on title and abstract. Hereby, two further studies could be identified. Thus, 45 studies (containing 47 samples) were used for the main analysis. (For a detailed overview see .)
Figure 3. Flowchart of the study selection process, adapted from the Preferred Reporting Items for Systematic Reviews and Meta-Analyses (PRISMA) group (Moher et al., Citation2009).
2.5. Coding of measures
The correlation (r) between SOC score and PTSD severity as main effect size was coded by two independent coders (SS and one student member of the research team) by making a note of all bivariate correlation coefficients reported for one sample as well as the sample size (n). Inter-rater agreements were 89% for r and 94% for n. All disagreements could be resolved by reassessing the relevant paper. In addition, one author (SS) coded all the aforementioned moderator variables for all included samples. Hence, for each sample the year of publication, the used version of SOC measurement (short vs long version of Antonovsky’s SOC scale vs other measurement), the PTSD measure [IES(-R) vs PDS vs other measurement] and participants’ mean age were coded. Moreover, the percentage of female participants, the certainty of criterion A fulfilment (criterion A ensured on an individual basis vs high-risk sample vs stressful life event not fulfilling criterion A), the type of trauma (accidental trauma vs professional trauma vs medical trauma vs Holocaust or war trauma) and the duration of the traumatic stressor (short vs long) were documented. In seven unclear cases, two supervisors (AH and TM) made an independent decision, which coincided in all cases.
2.6. Theory and meta-analytical procedure
2.6.1. Main meta-analysis
The meta-analysis followed the guidelines proposed by Field and Gillett (Citation2010), using R version 3.3.1 (R Development Core Team, Citation2017) and the metafor package (Viechtbauer, Citation2010). All analyses relied on a random-effects model owing to an assumed varying true effect between different studies. In addition, the random-effects model allows for conclusions applicable not only to the included samples but also to a broader population. Each analysis was based on a maximum-likelihood estimation of the mean weighted correlation, M(r), as an estimate of population effect size as well as its 95% confidence bounds (CIl and CIu) as an indicator of significance. Moreover, the variability of effect sizes in the population (τ2) and the Q statistic are reported to assess the remaining heterogeneity of effect sizes. A significant Q statistic is associated with substantial remaining heterogeneity. In addition, I2 was computed as a further estimation of heterogeneity (Higgins & Thompson, Citation2002). I2 describes the extent to which the observed variance reflects real differences in effect sizes and thereby can be regarded as signal-to-noise ratio. It ranges from 0% to 100%; 25% can be considered as low, 50% as moderate and 75% as high heterogeneity (Higgins, Thompson, Deeks, & Altman, Citation2003).
2.6.2. Calculation of sample effect sizes
The coded correlation between SOC scores and PTSD severity was used as the effect measure. In some cases, more than one correlation per sample was reported owing to follow-up surveys or the use of different PTSD scales. Correlations were aggregated by using Fisher’s Z transformation and a weighted mean correlation was calculated for each sample to avoid including a sample more than once. In one case, an odds ratio was transformed into a correlation coefficient using an online tool for effect size computation (Lenhard & Lenhard, Citation2016).
2.6.3. Outlier and influential analyses
Outlier and influential analyses were also conducted within the metafor package (Viechtbauer, Citation2010). Outliers were identified by computing studentized deleted residuals (SDRs) for each study. These represent the deviation of the correlation of a single sample from the weighted mean correlation of all other included samples. Studies with SDRs below −1.96 and above +1.96 were regarded as outliers. Cook’s distance (CD) and COVRATIO values were used to judge the influence of outliers on the mean correlation for each sample. CD can be interpreted as the Mahalanobis distance of the predicted average correlations of a meta-analysis with and without each sample. Studies with CD values greater than .45 were regarded as having substantial influence on the mean effect (Cook & Weisberg, Citation1982). The COVRATIO of a study describes the change in the variance–covariance matrix of the parameter estimates when excluding one sample. According to Viechtbauer and Cheung (Citation2010), a COVRATIO smaller than 1 indicates that the exclusion of the concerned study improves the precision of model parameters. In the following, the meta-analytical results are reported with and without outliers to allow for a direct comparison.
2.6.4. Moderator analyses
For the assessment of moderator effects, we used two methods: fractioning and meta-regression (Viechtbauer, Citation2010). Within the fractioning method used for nominally scaled variables such as SOC scale type, we conducted a separate meta-analysis for each level of the moderator variable. A significant moderating effect is assumed if the 95% confidence bounds of at least two levels of the moderator variable do not overlap. In contrast, meta-regression was used to examine the moderating effects of interval scaled variables (e.g. participants’ age). This version of regression analysis predicts effect sizes as a linear function of the sample’s value on a defined moderator variable. The significance of such moderator effects can be assessed by means of the QM statistic. In addition, zero-order correlations of moderator variables were calculated to evaluate confounding factors of each moderator analysis.
2.6.5. Identification of publication bias
As the analyses solely relied on published studies, the possibility of publication bias must be considered. Publication bias describes the phenomenon that significant results are more likely to be published than non-significant ones. In the presence of publication bias, a meta-analytical evaluation of the mean effect size can lead to a considerable overestimation of the true population effect. To identify a possible bias in the data, funnel plots (Light & Pillemer, Citation1984) and rank correlations (Begg & Mazumdar, Citation1994) were used. The non-parametric correlation coefficient Kendall’s τ describes the association of variances and effect sizes and thereby assesses funnel plot asymmetries. Furthermore, to correct for a potential influence of publication bias, the trim-and-fill method was applied (Duval & Tweedie, Citation2000). This approach assumes that all effect sizes are distributed normally around the mean population effect when displaying them in a funnel plot. In case of a violation of this normal distribution, the trim-and-fill algorithm supplements missing effect sizes, and a new main analysis based on the included and added samples is conducted. Its results indicate the findings of a meta-analysis in the absence of the publication bias.
2.6.6. Correcting for small samples
Smaller samples can have a larger impact on meta-analytical results in random-effects models, especially in the presence of publication bias. Henmi and Copas (Citation2010) developed a method to correct this biasing influence on the weighted mean effect size and its confidence boundaries by using fixed-effects assumptions and allowing additional heterogeneity. The results of all variants of the main analysis and the moderator analyses for the nominally scaled variables are also presented in a corrected version. For the interval scaled variables, this correction cannot be applied.
3. Results
3.1. Sample description
The total sample consisted of N = 10,883 participants out of 47 samples (reported in 45 articles). After outlier exclusion (see Section 3.4), the sample contained N = 7986 individuals out of 43 samples (reported in 41 articles). The mean weighted age was M = 38.33 years (SD = 9.41; without outliers: M = 38.47, SD = 10.38). Overall, 43% of the participants were female (without outliers: 41%). displays the included samples along with samples sizes, correlation coefficients and other sample characteristics (for an extended version including all moderator variables, see Appendix A).
Table 1. Included samples and their characteristics.
3.2. Overview of study results
presents the forest plot of all included samples (for detailed references of all studies, see Appendix B). The outcome axis ranges from −1 to .50 and shows the correlation coefficient r per sample and its confidence interval. Numerically higher negative correlations equate to a stronger negative relationship between SOC and PTSD symptoms, i.e. higher SOC is linked to less severe PTSD symptoms. It is of note that the effect sizes of all samples show a rather large range (−.15 ≥ r ≥ −.85). While the range of the middle 75% was smaller, it remained considerable (−.22 ≥ r ≥ −.58). However, all effect sizes were negative or showed at least a trend towards a negative relationship between SOC and PTSD symptom severity. Only in three samples (6.4%) did the confidence boundaries include zero, while all others reported significant negative correlations.
3.3. Meta-analytical results
The meta-analytical results are presented in . An analysis including all samples yielded a medium (Cohen, Citation1988) mean effect size of M(r) = −.41, indicating that higher levels of SOC are associated with less severe PTSD symptoms. As the 95% confidence boundaries [−.36 ≥ M(r) ≥ −.46] did not include zero, the population effect can be regarded as significant. However, the population variance τ2 = .02 shows that the included effect sizes are not homogeneous. Correspondingly, an I2-value of 89.35% and a significant Q-test for heterogeneity [Q(46) = 695.52, p < .001] highlight the amount of remaining variance. This provides a further rationale for conducting moderator analyses to identify variables that influence the variance of effect sizes.
Table 2. Results of the main analyses and nominally scaled moderator variables.
Table 3. Results for the interval scaled moderator variables.
Table 4. Pearson correlations of the moderator variables (outliers excluded).
3.4. Outlier and influence analyses
presents the results of the outlier and influence analyses. The SDRs did not exceed the defined cut-off value for substantial outliers, except for samples 8 and 23. The CD was below the cut-off of .45 for all included samples. Considering COVRATIO, samples 8 and 23 as well as samples 28 and 43 caused a considerable change in the variance–covariance matrix when excluded, and fell below the cut-off. Thus, with reference to all influence statistics, samples 8, 23, 28 and 43 were defined as outliers. All of them reported exceptionally large (samples 8, 23 and 28) or small (sample 43) effect sizes. To assess the impact of outlying studies on the result, the meta-analysis was conducted using a total sample including and excluding outlying studies.
provides the results of the main analysis without the outlying samples. While the mean correlation slightly decreased to r = −.39 [compared to M(r) = −.41 including the outliers], excluding the identified outliers led to a decrease in the variance of effect sizes from τ2 = .02 to τ2 = .01. The confidence boundaries of both main analyses were almost identical [−.36 ≤ M(r) ≤ −.46 vs −.35 ≤ M(r) ≤ −.43]. Thus, the results of the main analysis can be considered as robust against outliers. However, outlying studies may affect the moderator analyses to a greater extent, especially in the case of smaller subsample meta-analyses. Consequently, to avoid distorted results and the overestimation of the influence of moderating variables, the identified outliers were excluded from all moderator analyses. All results for the moderator analyses based on the total sample are provided in Appendix C. Patterns of findings did not differ, irrespective of outlier inclusion or exclusion.
3.5. Moderator analyses
The results of the moderator analyses for the nominally scaled variables are displayed in , whereas the interval scaled variables are shown in . Since the confidence intervals overlap, there is no significant moderating effect of the SOC scale version, PTSD measure, the rigour of DSM criterion A, type of trauma or the duration of the traumatic stressor. However, there are two moderator sublevels that can be considered as homogeneous. Traumas following Holocaust and war were related to less heterogeneity (I2 = 29.38), and can be regarded as a homogeneous subgroup [Q(6) = 8.32, p = .215]. With regard to the duration of the traumatic stressor, longer lasting traumas were associated with less heterogeneity (I2 = 14.70% vs I2 = 78.77%), reflected in a non-significant Q statistic [Q(8) = 9.59, p = .295].
Finally, no moderating effect was found for year of publication, gender imbalance per sample or participants’ mean age. However, including the outliers, the mean age per sample had a significant impact on the effect size per sample [QM(1) = 5.73, p = .017] and accounted for 14.21 % of the variance. (see Appendix C) shows the relationship between samples’ mean age and the reported correlation, highlighting both a trend towards stronger correlations between SOC and PTSD symptoms in higher age and a lack of studies in elderly populations. Therefore, the moderating effect was tested using a non-parametric weighted correlation which resulted in a significantly reduced association of age and the correlation coefficient per sample (rs = −.07, p < .001), which remained significant because of the large sample size.
3.5.1. Interrelatedness of moderator variables
displays the correlations between the investigated moderator variables. A more recent publication year was related to the investigation of high-risk samples instead of samples that ensured a stringent criterion A on an individual basis (r = .27). Samples with a higher proportion of females more frequently used the shorter version of the SOC scale (r = −.40) and the PDS instead of the IES(-R) (r = .32). Older samples were more frequently studied using versions of the PDS (r = .32), and tended to be high-risk populations (r = .29). The longer version of Antonovsky’s SOC scale was more often used in samples with ensured stringent criterion A (r = .31). The latter were also associated with the use of the IES(-R) for PTSD symptom assessment (r = .22). Longer traumatic stressors were more frequently studied in older samples (r = .67) and in high-risk populations compared to samples that ensured criterion A on an individual basis (r = .65). Furthermore, samples with longer traumatic stressors were more frequently assessed using the short version of the SOC scale (r = −.27).
3.6. Analysis of publication bias
The funnel plot showed no substantial asymmetry in terms of missing small effect sizes. Correspondingly, a rank correlation test on funnel plot asymmetry remained non-significant (Kendall’s τ = −.10, p = .315). In addition, the results of the trim-and-fill method to control for a potential influence of publication bias are displayed in for all samples including the outliers. The plot indicates that the algorithm added seven samples on the left side of the effect size distribution. This side represents numerically larger effect sizes, and consequently the inclusion of the artificially amended samples would increase the estimated mean effect to M(r) = −.44. Therefore, it is unlikely that the meta-analytical results are strongly influenced by publication bias. At the most, the present publication bias leads to an underestimation of the mean population effect.
Figure 4. Forest plot of the meta-analysis including all samples.
Figure 5. Results of the influence statistics as the basis for outlier identification. The outliers identified by the influence analyses are marked by a circle. Study numbers correspond to those in the forest plot.
Figure 6. Trim-and-fill funnel plot of the main analysis with all samples including the amended effect sizes (white points).
3.7. Influence of small samples
The correction based on Henmi and Copas (Citation2010) resulted in a larger mean effect size of M(r) = −.53 with wider confidence bounds [−.40 ≥ M(r) ≥ −.66] in comparison to M(r) = −.41, [−.36 ≥ M(r) ≥ −.46] resulting from the main analysis including all samples. Applying the same correction after outlier exclusion provided an only slightly increased mean population effect, i.e. M(r) = −.40 [−.35 ≥ M(r) ≥ −.45] in contrast to M(r) = −.39 [−.35 ≥ M(r) ≥ −.43]. Concerning the analyses of nominally scaled moderating variables, applying the correction did not result in a change in the pattern of results [mean change in M(r) = .03, SD = .05]. To conclude, the correction for small samples suggests that the mean effect size estimations are not strongly affected by small samples.
4. Discussion
This study, based on 47 samples, is the first to meta-analyse the relationship between SOC and PTSD symptom severity. The results show a significant negative correlation of M(r) = −.41, or M(r) = −.39 if corrected for outlying samples. The findings indicate that high levels of SOC are linked to less severe PTSD symptoms in the aftermath of a traumatic or stressful life event. Differences in SOC account for 17% (or 15% if corrected for outliers) of the variance in PTSD symptom severity. Moreover, the results of the trim-and-fill analyses underline that the mean correlation can be regarded as a conservative estimation. At the most, the current analysis underestimates the mean relationship between SOC and PTSD symptoms by missing larger effect sizes in terms of numerically greater negative correlations. Thus, the current meta-analysis clearly highlights the relevance of SOC as a crucial correlate of PTSD symptoms in the aftermath of a stressful or traumatic life event.
However, the mean effect size cannot be generalized to all PTSD samples owing to substantial remaining heterogeneity. Therefore, various moderator variables (i.e. SOC measure, PTSD measure, DSM criterion A, trauma type and duration of traumatic stressors) were investigated, but none of them significantly influenced the variance in sample effect sizes. Yet, smaller heterogeneity in some subgroups can be noted. For instance, studies investigating the relationship of SOC and PTSD symptom severity after Holocaust and war trauma [M(r) = −.47] can be considered as homogeneous based on Q statistics and a smaller I2-value. Moreover, a longer duration of the traumatic stressor (e.g. war experiences) was also linked to a strong association [M(r) = −.45] and the absence of heterogeneity. Furthermore, including the outliers, a significant moderating effect for age was found, showing a stronger association in elderly samples. However, as this effect was mainly driven by one outlying sample, it should be interpreted with caution.
The finding that Holocaust and war traumas were associated with a relatively strong relationship between SOC and PTSD symptom severity after the exclusion of the outlying samples is interesting in the context of the origin of the salutogenic theory, as Antonovsky initially developed his concept of salutogenesis based on qualitative interviews with Holocaust survivors (Mittelmark et al., Citation2017). In this context, SOC was defined as an underlying global orientation that enables individuals to cope in spite of exposure to adverse life events. Against this background, SOC may be particularly relevant – and in turn more strongly related to PTSD symptom severity – for traumatic experiences related to a fundamental erosion of central human assumptions (see shattered assumptions theory) (Janoff-Bulman, Citation1989), such as war-related experiences, which constitute an enduring human-induced traumatization. Its specific relevance to these stressors may also be reflected in the identified strong and less heterogeneous association of SOC and PTSD symptom severity for enduring traumatic stressors. As outlined in the aforementioned model, an initially high SOC may function in a protective manner during the traumatic experience itself, since it may provide the individual with confidence in their ability to cope with the enduring adversity by using (G)RR. Furthermore, in the aftermath of a trauma, individuals with higher SOC levels may recover over time and resume their prior assumptions of a per se structured and controllable world. In addition, they may even experience post-traumatic growth (Tedeschi & Calhoun, Citation1996). Such a positive psychological change in the aftermath of challenging life experiences has also been shown to be positively correlated with SOC, and particularly its meaningfulness component (Forstmeier, Kuwert, Spitzer, Freyberger, & Maercker, Citation2009; Nishi, Matsuoka, & Kim, Citation2010), and is in turn linked to a weaker psychopathological symptom burden in the long term (Kimhi, Eshel, Zysberg, Hantman, & Enosh, Citation2010; but see Hobfoll et al., Citation2007). However, further longitudinal studies need to establish a potentially causal relationship.
Furthermore, irrespective of its identified significant moderating effect in the sample including the outliers, no strong conclusions can be drawn with respect to the moderating role of age. Most of the included studies reported findings from middle-aged adults and only five studies investigated populations older than 60 years, of which one found an exceptionally large correlation (r = .85), between SOC and PTSD symptom severity (Ferrajão & Oliveira, Citation2016). In light of the numerically small non-parametric weighted correlation of r per sample and age and the non-significant moderator effect after excluding the aforementioned study as an outlier, this finding should be regarded as mainly outlier driven. Furthermore, all studies reporting findings in elderly people were predominantly concerned with war traumas and Holocaust survivors, which may have further boosted the mean correlation.
An important constraint of the current meta-analysis concerns the standard measurement of SOC: almost all studies used either the short or the long version of Antonovsky’s (Citation1987, Citation1993) SOC scale or language-specific short versions (Schumacher, Wilz, Gunzelmann, & Brähler, Citation2000). The fact that nearly all studies used one of the two outlined versions of Antonovsky’s SOC scale has to be noted: on the one hand, the consistent use of questionnaires derived from the same author may have reduced unsystematic variance that could have arisen owing to different measurements; on the other hand, the results are limited to the conceptualization of SOC within this specific instrument. As described above, the SOC scales by Antonovsky have been criticized because of psychometric and conceptual problems (Bachem & Maercker, Citation2018; Gruszczynska, Citation2006). These problems may have influenced the results of the current meta-analysis since Antonovsky’s SOC scales may predominantly assess the opposite of depression or anxiousness and general mental health. If this is the case, the mean correlation may have been boosted by the strong impairment of general mental health in PTSD and potential comorbid disorders (e.g. Smith, Goldstein, & Grant, Citation2016). To address the criticism concerning the SOC scales, Bachem and Maercker (Citation2018) developed a new scale to measure SOC: the Sense of Coherence Scale – Revised (SOC-R). In the current meta-analysis, we were unable to include a study using the new questionnaire, since none of the currently published studies using SOC-R assessed PTSD symptom severity. One study reporting correlations between SOC-R scores and childhood trauma found relatively weak correlations ranging between r = −.09 (physical neglect) and r = .12 (sexual abuse) (Mc Gee, Höltge, Maercker, & Thoma, Citation2017).
In summary, we found no significant moderating effect for any of the investigated variables. An explanation may be that owing to the smaller subsamples used for the moderator analyses, these analyses lacked power to detect potential effects. In particular, concerning the nominally scaled moderators, the small number of studies per level of moderator variable may account for the absence of significant effects by enlarging the confidence intervals. However, to deal with this issue, the Henmi and Copas (Citation2010) correction was applied, which did not produce a significant change in the patterns of findings. Regarding the interval scaled variables, all analyses were based on at least 41 samples and were thus not underpowered. Alternatively, the lack of moderating effects may be explained by complex interactions between the investigated moderators, e.g. age may be a moderator of the relationship between SOC and PTSD symptoms in the case of Holocaust and war traumas, but not for professional traumas. However, such effects could not be addressed in the current meta-analysis, as the subsamples for different combinations of moderating variables were too small in the currently available database. A further explanation for the present results may be that the remaining variance reflects random error due to poor study quality or unreported, systematically influencing factors.
The current meta-analysis is the first to emphasize the role of SOC as a robust correlate of PTSD symptom severity on a population level. However, in the theory of salutogenesis, SOC is conceptualized as a dispositional variable that influences the way in which individuals deal with adversity. All but one of the included studies assessed the relationship between both concepts using cross-sectional data collected in the aftermath of traumatic experiences or stressful life events. Hence, the current meta-analysis represents a snapshot of the investigated relationship and does not enable a better understanding of the temporal and causal influence of SOC on PTSD symptoms (or vice versa). The significant negative correlation could also simply reflect reduced SOC levels as a correlate of more severe PTSD symptoms. Moreover, it is also conceivable that a third variable (e.g. presence of depressive symptoms, general mental health issues) related to both SOC and PTSD symptoms may explain their association. Consequently, the current meta-analysis cannot solve the question of whether SOC functions as an early developed and stable resistance factor, or whether it is sensitive to traumatic experiences.
From a theoretical perspective, the focus on zero-order correlations may be problematic. There are two important theoretical approaches in PTSD research that may predict a non-linear relationship between SOC and PTSD, which cannot be investigated using a meta-analysis based on zero-order correlations. According to schema-based theories, individuals with high SOC levels (i.e. extremely positive schemas about themselves and the world) may be at higher risk for developing PTSD, as traumatic events cannot easily be integrated into their existing schemas (Horowitz, Citation1986). Similarly, based on the aforementioned shattered assumptions theory, it is plausible to assume that people with inflexible and rigid belief systems, such as people with extremely low or high SOC, have a greater risk for developing PTSD (e.g. Janoff-Bulman, Citation1989). However, since there were few data for the predicted non-linear relationship between SOC and PTSD, the current meta-analysis exclusively relied on zero-order correlations. Kazmierczak, Strelau, and Zawadzki (Citation2012) assessed both linear and curvilinear components of the relationship between SOC and PTSD symptoms after motor vehicle accidents and found evidence for a linear negative correlation. However, a curvilinear relationship was described for a subgroup of individuals with low PTSD risk factors. Correspondingly, Dudek and Szymczak (Citation2011) also found a curvilinear relationship between SOC and PTSD symptom severity on a descriptive level. However, this trend did not reach significance in spite of their large sample size.
Further studies are needed that simultaneously assess SOC and other resilience-related and health-benefiting factors, such as trait-resilience, self-efficacy, locus of control and coping mechanisms, as well as a wider range of outcome measures, including burnout symptoms, depression and general psychological distress. Based on the definition of SOC as a global orientation and its additional implications for dynamic coping processes, other resilience-related and health-benefiting factors may conceivably act as correlates or mediators of predisposing high SOC levels. Hence, studies could identify SOC’s incremental validity above other factors and how these correlate with SOC and mediate its relationship with outcome measures. Thereby, stronger conclusions could be drawn concerning the mechanisms by which SOC may influence different health outcomes.
With regard to further meta-analyses addressing the impact of SOC on PTSD, research needs to close existing gaps related to potential moderator variables. The current state of research precludes the examination of the relationships between SOC and PTSD symptom severity for distinct trauma types. In the present meta-analysis the different trauma types were confounded: it was not possible to assess the distinct effect of interpersonal versus accidental traumas or of type I (single-incident) versus type II (longer enduring exposure) traumas, as all interpersonal traumas were type II and all accidental traumas were type I. Moreover, findings on the correlation between SOC and accidental type II traumas, such as enduring natural disasters, were almost entirely missing.
Finally, future studies should make use of a wider variety of instruments to assess SOC. The current results suggest that the high mean correlation between SOC and PTSD symptoms may be influenced by the prevalent use of scales developed by Antonovsky (Citation1987, Citation1993). Therefore, it will be up to future studies to investigate the relationship between SOC and PTSD symptoms using both Antonovsky’s SOC scales (Citation1987, Citation1993) and SOC-R (Bachem & Maercker, Citation2018), and to examine and compare their predictive validities.
From a treatment research point of view, the relevance of SOC as an outcome of psychotherapy is crucial, as low levels of SOC may be a risk factor for physical and mental disorders (Eriksson & Lindström, Citation2006), including PTSD (Engelhard et al., Citation2003). If psychotherapy did not achieve the normalization of altered SOC levels, even successfully treated patients would still have an enhanced risk for redeveloping PTSD in case of exposure to another traumatic event. One study reported an increase in SOC following a trauma-focused group therapy for women who had been sexually abused during their childhood (Lundqvist, Svedin, Hansson, & Broman, Citation2006). However, a sufficient database to answer this question is still lacking. Hence, the current findings particularly highlight the relevance of further research focusing on the modification of SOC within the course of PTSD and its treatment. With respect to clinical practice, three types of studies are required. First, further prospective studies should evaluate the role of low SOC levels as a risk factor for PTSD development. Secondly, provided that low SOC constitutes a risk factor, it would be of interest to investigate whether SOC can be enhanced in high-risk populations by making use of SOC-targeting interventions (e.g. Ando, Natsume, Kukihara, Shibata, & Ito, Citation2011) and whether such training would result in a reduced risk of developing PTSD. Thirdly, SOC levels as part of the larger resilience framework should be increasingly assessed as an outcome measure of trauma-focused therapy (Reyes, Kearney, Lee, Isla, & Estrada, Citation2018).
To summarize, for the first time, the current meta-analysis provided an estimate of the population effect of the relationship between SOC and PTSD symptom severity, based on 47 independent samples including 10,883 individuals, showing a robust significant mean correlation of M(r) = −.41, M(r) = −.39 if excluding four outliers. Low SOC scores are associated with more severe PTSD symptoms in the aftermath of a traumatic or stressful life event. However, there is a significant amount of remaining heterogeneity among the effect sizes that could not be sufficiently explained by any of the considered moderator variables. Consequently, future prospective studies need to investigate SOC’s potential causal impact on the development and course of PTSD.
Acknowledgements
The authors wish to thank all researchers who conducted the individual studies and who contributed to the meta-analysis by sending unpublished correlations or unpublished manuscripts. They also thank Marlene Staginnus for proofreading the manuscript.
Disclosure statement
No potential conflict of interest was reported by the authors.
Notes
1. These findings show that SOC is the strongest predictor of PTSD symptom severity, above trait-resilience in paramedics (Streb, Häller & Michael, 2016) and above mindfulness in World War II survivors (Glück et al., Citation2016). Both studies use cross-sectional designs and can thus not provide a valid explanation of the identified incremental validity. Based on the salutogenic theory, one might argue that SOC measures reflect a more holistic assessment of coping processes than the other two concepts.
2. Antonovsky initially differentiated generalized (e.g. self-esteem, self-regulation competences) and specific resistance resources (e.g. clinical supervision, staff support systems). Neither Antonovsky nor the ensuing salutogenic research focused much on their distinction. Therefore, the current meta-analysis does not differentiate between them. If both generalized and specific resistance resources are addressed, this is highlighted by using the abbreviation (G)RR.
3. Seven publications use different SOC measures: Life Attitude Profile – Revised (LAP-R) in Mehnert et al. (Citation2012) and Sense of Coherence Scale – 9-item version (SOC-L9) in Streb et al. (Citation2014). In five other cases the precise name of the measure was not reported.
References
- Agaibi, C. E., & Wilson, J. P. (2005). Trauma, PTSD, and resilience: A review of the literature. Trauma, Violence, & Abuse, 6(3), 195–22.
- Almedom, A. M. (2005). Resilience, hardiness, sense of coherence, and posttraumatic growth: All paths leading to “light at the end of the tunnel”? Journal of Loss and Trauma, 10(3), 253–265.
- Almedom, A. M., & Glandon, D. (2007). Resilience is not the absence of PTSD any more than health is the absence of disease. Journal of Loss and Trauma, 12(2), 127–143.
- American Psychiatric Association. (2000). Diagnostic and statistical manual of mental disorders (4th ed., text rev.). Washington, DC: American Psychiatric Association.
- American Psychiatric Association. (2013). Diagnostic and statistical manual of mental disorders (5th ed.). Washington, DC: American Psychiatric Association.
- Ando, M., Natsume, T., Kukihara, H., Shibata, H., & Ito, S. (2011). Efficacy of mindfulness-based meditation therapy on the sense of coherence and mental health of nurses. Health, 3(2), 118.
- Antonovsky, A. (1979). Health, stress, and coping. San Francisco, CA: Jossey-Bass.
- Antonovsky, A. (1987). Unraveling the mystery of health: How people manage stress and stay well. San Francisco, CA: Jossey-Bass.
- Antonovsky, A. (1993). The structure and properties of the sense of coherence scale. Social Science & Medicine, 36(6), 725–733.
- Bachem, R., & Maercker, A. (2018). Development and psychometric evaluation of a revised sense of coherence scale. European Journal of Psychological Assessment, 34(3), 206–215. doi:10.1027/1015‐5759/a000323
- Baum, A., O’Keeffe, M. K., & Davidson, L. M. (1990). Acute stressors and chronic response: The case of traumatic stress1. Journal of Applied Social Psychology, 20(20), 1643–1654.
- Begg, C. B., & Mazumdar, M. (1994). Operating characteristics of a rank correlation test for publication bias. Biometrics, 50, 1088–1101.
- Braun-Lewensohn, O., Sagy, S., Sabato, H., & Galili, R. (2013). Sense of coherence and sense of community as coping resources of religious adolescents before and after the disengagement* from the Gaza Strip. The Israel Annals of Psychiatry and Related Disciplines, 50, 110–116.
- Brewin, C. R., Andrews, B., & Valentine, J. D. (2000). Meta-analysis of risk factors for posttraumatic stress disorder in trauma-exposed adults. Journal of Consulting and Clinical Psychology, 68(5), 748–766.
- Carmel, S., & Bernstein, J. (1989). Trait-anxiety and sense of coherence: A longitudinal study. Psychological Reports, 65(1), 221–222.
- Cederblad, M., Dahlin, L., Hagnell, O., & Hansson, K. (1994). Salutogenic childhood factors reported by middle-aged individuals. European Archives of Psychiatry and Clinical Neuroscience, 244(1), 1–11.
- Cohen, J. (1988). Statistical power analysis for the behavioral sciences (Vol. 2). Hillsdale, NJ: Lawrence Erlbaum Associates.
- Cook, R. D., & Weisberg, S. (1982). Residuals and influence in regression. New York, NY: Chapman & Hall.
- de Vries, G.-J., & Olff, M. (2009). The lifetime prevalence of traumatic events and posttraumatic stress disorder in the Netherlands. Journal of Traumatic Stress, 22(4), 259–267.
- DiGangi, J. A., Gomez, D., Mendoza, L., Jason, L. A., Keys, C. B., & Koenen, K. C. (2013). Pretrauma risk factors for posttraumatic stress disorder: A systematic review of the literature. Clinical Psychology Review, 33(6), 728–744.
- Dudek, B., & Szymczak, W. (2011). The role of cognitive schemata in the development of posttraumatic stress disorder: Results of cross-sectional and longitudinal studies. International Journal of Occupational Medicine and Environmental Health, 24(1), 29–35.
- Duval, S., & Tweedie, R. (2000). Trim and fill: A simple funnel-plot-based method of testing and adjusting for publication bias in meta-analysis. Biometrics, 56(2), 455–463.
- Engelhard, I. M., van den Hout, M. A., & Vlaeyen, J. W. (2003). The sense of coherence in early pregnancy and crisis support and posttraumatic stress after pregnancy loss: A prospective study. Behavioral Medicine, 29(2), 80–84.
- Eriksson, M., & Lindström, B. (2006). Antonovsky’s sense of coherence scale and the relation with health: A systematic review. Journal of Epidemiology & Community Health, 60(5), 376–381.
- Ferrajão, P. C., & Oliveira, R. A. (2016). The effects of combat exposure, abusive violence, and sense of coherence on PTSD and depression in Portuguese colonial war veterans. Psychological Trauma: Theory, Research, Practice, and Policy, 8(1), 1.
- Field, A. P., & Gillett, R. (2010). How to do a meta‐analysis. British Journal of Mathematical and Statistical Psychology, 63(3), 665–694.
- Flannery, R. B., & Flannery, G. J. (1990). Sense of coherence, life stress, and psychological distress: A prospective methodological inquiry. Journal of Clinical Psychology, 46(4), 415–420.
- Foa, E. B., Cashman, L., Jaycox, L., & Perry, K. (1997). The validation of a self-report measure of posttraumatic stress disorder: The posttraumatic diagnostic scale. Psychological Assessment, 9(4), 445–451.
- Forstmeier, S., Kuwert, P., Spitzer, C., Freyberger, H. J., & Maercker, A. (2009). Posttraumatic growth, social acknowledgment as survivors, and sense of coherence in former German child soldiers of World War II. The American Journal of Geriatric Psychiatry, 17(12), 1030–1039.
- Frenz, A. W., Carey, M. P., & Jorgensen, R. S. (1993). Psychometric evaluation of Antonovsky’s sense of coherence scale. Psychological Assessment, 5(2), 145.
- Glück, T. M., Tran, U. S., Raninger, S., & Lueger-Schuster, B. (2016). The influence of sense of coherence and mindfulness on PTSD symptoms and posttraumatic cognitions in a sample of elderly Austrian survivors of World War II. International Psychogeriatrics, 28(3), 435–441.
- Gruszczynska, E. (2006). What is measured by the orientation to life questionnaire? Construct validity of the instrument for the sense of coherence measurement. Polish Psychological Bulletin, 37(2), 74.
- Henmi, M., & Copas, J. B. (2010). Confidence intervals for random effects meta-analysis and robustness to publication bias. Statistics in Medicine, 29(29), 2969–2983.
- Higgins, J. P., & Thompson, S. G. (2002). Quantifying heterogeneity in a meta-analysis. Statistics in Medicine, 21(11), 1539–1558.
- Higgins, J. P., Thompson, S. G., Deeks, J. J., & Altman, D. G. (2003). Measuring inconsistency in meta-analyses. BMJ, 327(7414), 557–560.
- Hobfoll, S. E., Hall, B. J., Canetti-Nisim, D., Galea, S., Johnson, R. J., & Palmieri, P. A. (2007). Refining our understanding of traumatic growth in the face of terrorism: Moving from meaning cognitions to doing what is meaningful. Applied Psychology, 56(3), 345–366.
- Hoge, E. A., Austin, E. D., & Pollack, M. H. (2007). Resilience: Research evidence and conceptual considerations for posttraumatic stress disorder. Depression & Anxiety (1091-4269), 24(2), 139–152.
- Horowitz, M., Wilner, N., & Alvarez, W. (1979). Impact of Event Scale: A measure of subjective stress. Psychosomatic Medicine, 41(3), 209–218.
- Horowitz, M. J. (1986). Stress-response syndromes: A review of posttraumatic and adjustment disorders. Psychiatric Services, 37(3), 241–249.
- Janoff-Bulman, R. (1989). Assumptive worlds and the stress of traumatic events: Applications of the schema construct. Social Cognition, 7(2), 113–136.
- Kazlauskas, E., Gailiene, D., Vaskeliene, I., & Skeryte-Kazlauskiene, M. (2017). Intergenerational transmission of resilience? Sense of coherence is associated between Lithuanian survivors of political violence and their adult offspring. Frontiers in Psychology, 8. doi:10.3389/fpsyg.2017.01677
- Kazmierczak, I. E., Strelau, J., & Zawadzki, B. (2012). Search for a curvilinear relationship between the sense of coherence and the intensity of PTSD in MVA survivors. Anxiety, Stress, and Coping, 25(4), 443–455.
- Kessler, R. C., Aguilar-Gaxiola, S., Alonso, J., Benjet, C., Bromet, E. J., Cardoso, G., … Koenen, K. C. (2017). Trauma and PTSD in the WHO World mental health surveys. European Journal of Psychotraumatology, 8(sup5), 1353383.
- Kimhi, S., Eshel, Y., Zysberg, L., Hantman, S., & Enosh, G. (2010). Sense of coherence and socio-demographic characteristics predicting posttraumatic stress symptoms and recovery in the aftermath of the Second Lebanon War. Anxiety, Stress, and Coping, 23(2), 139–152.
- Kivimäki, M., Feldt, T., Vahtera, J., & Nurmi, J.-E. (2000). Sense of coherence and health: Evidence from two cross-lagged longitudinal samples. Social Science & Medicine, 50(4), 583–597.
- Lamoureux-Lamarche, C., Vasiliadis, H.-M., Préville, M., & Berbiche, D. (2016). Healthcare use and costs associated with post-traumatic stress syndrome in a community sample of older adults: Results from the ESA-Services study. International Psychogeriatrics, 28(6), 903–911.
- Lenhard, W., & Lenhard, A. (2016). Calculation of effect sizes. Psychometrica. doi:10.13140/RG.2.1.3478.4245
- Light, R. J., & Pillemer, D. B. (1984). Summing up. Cambridge, MA: Harvard University Press.
- Lundqvist, G. N., Svedin, C. G., Hansson, K., & Broman, I. (2006). Group therapy for women sexually abused as children: Mental health before and after group therapy. Journal of Interpersonal Violence, 21(12), 1655–1677.
- Mc Gee, S. L., Höltge, J., Maercker, A., & Thoma, M. V. (2017). Evaluation of the revised sense of coherence scale in a sample of older adults: A means to assess resilience aspects. Aging & Mental Health, 1–10. doi: 10.1080/13607863.2017.1364348
- Mehnert, A., Nanninga, I., Fauth, M., & Schäfer, I. (2012). Course and predictors of posttraumatic stress among male train drivers after the experience of ‘person under the train’ incidents. Journal of Psychosomatic Research, 73(3), 191–196.
- Mittelmark, M. B., Sagy, S., Eriksson, M., Bauer, G., Pelikan, J. M., Lindström, B., & Espnes, G. A. (Eds.). (2017). The handbook of salutogenesis. Springer International Publishing. Retrieved from www.springer.com/gp/book/9783319045993
- Moher, D., Liberati, A., Tetzlaff, J., Altman, D. G.; PRISMA Group. (2009). Preferred reporting items for systematic reviews and meta-analyses: The PRISMA statement. PLOS Medicine, 6(7), e1000097.
- Nishi, D., Matsuoka, Y., & Kim, Y. (2010). Posttraumatic growth, posttraumatic stress disorder and resilience of motor vehicle accident survivors. BioPsychoSocial Medicine, 4(1), 1.
- Olff, M. (2017). Sex and gender differences in post-traumatic stress disorder: An update. European Journal of Psychotraumatology, 8(sup4), 1351204.
- Ozer, E. J., Best, S. R., Lipsey, T. L., & Weiss, D. S. (2003). Predictors of posttraumatic stress disorder and symptoms in adults: A meta-analysis. Psychological Bulletin, 129(1), 52.
- R Development Core Team. (2017). R: A language and environment for statistical computing (Version 3.3.1). Vienna, Austria: R Foundation for Statistical Computing.
- Read, S., Aunola, K., Feldt, T., Leinonen, R., & Ruoppila, I. (2005). The relationship between generalized resistance resources, sense of coherence, and health among Finnish people aged 65-69. European Psychologist, 10(3), 244–253.
- Reyes, A. T., Kearney, C. A., Lee, H., Isla, K., & Estrada, J. (2018). Interventions for posttraumatic stress with resilience as outcome: An integrative review. Issues in Mental Health Nursing, 39(2), 166–178.
- Sareen, J. (2014). Posttraumatic stress disorder in adults: Impact, comorbidity, risk factors, and treatment. The Canadian Journal of Psychiatry, 59(9), 460–467.
- Schnyder, U., Büchi, S., Sensky, T., & Klaghofer, R. (2000). Antonovsky’s sense of coherence: Trait or state? Psychotherapy and Psychosomatics, 69(6), 296–302.
- Schnyder, U., Ehlers, A., Elbert, T., Foa, E. B., Gersons, B. P. R., Resick, P. A., … Cloitre, M. (2015). Psychotherapies for PTSD: What do they have in common? European Journal of Psychotraumatology, 6(1), 28186.
- Schnyder, U., Moergeli, H., Klaghofer, R., & Buddeberg, C. (2001). Incidence and prediction of posttraumatic stress disorder symptoms in severely injured accident victims. American Journal of Psychiatry, 158(4), 594–599.
- Schumacher, J., Wilz, G., Gunzelmann, T., & Brähler, E. (2000). The Antonovsky sense of coherence scale. Test statistical evaluation of a representative population sample and construction of a brief scale. Psychotherapie, Psychosomatik, Medizinische Psychologie, 50(12), 472–482.
- Smith, S. M., Goldstein, R. B., & Grant, B. F. (2016). The association between post-traumatic stress disorder and lifetime DSM-5 psychiatric disorders among veterans: Data from the national epidemiologic survey on alcohol and related conditions-III (NESARC-III). Journal of Psychiatric Research, 82, 16–22.
- Streb, M., Häller, P., & Michael, T. (2014). PTSD in paramedics: Resilience and sense of coherence. Behavioural and Cognitive Psychotherapy, 42(04), 452–463.
- Suominen, S., Blomberc, H., Helenius, H., & Koskenvuo, M. (1999). Sense of coherence and health – Does the association depend on resistance resources? A study of 3115 adults in Finland. Psychology & Health, 14(5), 937–948.
- Tedeschi, R. G., & Calhoun, L. G. (1996). The posttraumatic growth inventory: Measuring the positive legacy of trauma. Journal of Traumatic Stress, 9(3), 455–471.
- Veronese, G., & Pepe, A. (2014). Sense of coherence mediates the effect of trauma on the social and emotional functioning of Palestinian health providers. American Journal of Orthopsychiatry, 84(5), 597.
- Viechtbauer, W. (2010). Conducting meta-analyses in R with the metafor package. Journal of Statistical Software, 36(3), 1–48.
- Viechtbauer, W., & Cheung, M. W.-L. (2010). Outlier and influence diagnostics for meta-analysis. Research Synthesis Methods, 1(2), 112–125.
- Volanen, S. M., Suominen, S., Lahelma, E., Koskenvuo, M., & Silventoinen, K. (2007). Negative life events and stability of sense of coherence: A five-year follow-up study of Finnish women and men. Scandinavian Journal of Psychology, 48(5), 433–441.
- Walker, E. A., Katon, W., Russo, J., Ciechanowski, P., Newman, E., & Wagner, A. W. (2003). Health care costs associated with posttraumatic stress disorder symptoms in women. Archives of General Psychiatry, 60(4), 369–374.
Appendix A
Table A1. Included samples and their characteristics.
Appendix B
References of studies included in the meta-analysis
Arévalo, S., Prado, G., & Amaro, H. (2008). Spirituality, sense of coherence, and coping responses in women receiving treatment for alcohol and drug addiction. Evaluation and Program Planning, 31(1), 113–123.
Cassel, L., & Suedfeld, P. (2006). Salutogenesis and autobiographical disclosure among Holocaust survivors. The Journal of Positive Psychology, 1(4), 212–225.
Dudek, B., & Koniarek, J. (2000). Relationship between sense of coherence and post-traumatic stress disorder symptoms among firefighters. International Journal of Occupational Medicine and Environmental Health, 13(4), 299–305.
Dudek, B., & Szymczak, W. (2011). The role of cognitive schemata in the development of posttraumatic stress disorder: Results of cross-sectional and longitudinal studies. International Journal of Occupational Medicine and Environmental Health, 24(1), 29–35.
Ekblad, S., & Wennström, C. (1997). Relationships between traumatic life events, symptoms and Sense of Coherence subscale meaningfulness in a group of refugee and immigrant patients referred to a psychiatric outpatient clinic in Stockholm. Scandinavian Journal of Social Welfare, 6(4), 279–285.
Engelhard, I. M., van den Hout, M. A., & Vlaeyen, J. W. (2003). The sense of coherence in early pregnancy and crisis support and posttraumatic stress after pregnancy loss: a prospective study. Behavioral Medicine, 29(2), 80–84.
Ferrajão, P. C., & Oliveira, R. A. (2016). The effects of combat exposure, abusive violence, and sense of coherence on PTSD and depression in Portuguese colonial war veterans. Psychological Trauma: Theory, Research, Practice, and Policy, 8(1), 1.
Forstmeier, S., Kuwert, P., Spitzer, C., Freyberger, H. J., & Maercker, A. (2009). Posttraumatic growth, social acknowledgment as survivors, and sense of coherence in former German child soldiers of World War II. The American Journal of Geriatric Psychiatry, 17(12), 1030–1039.
François, G., Brouette, B., Etienne, A.-M., & Fontaine, O. (2000). Influence du ‘sense of coherence’ dans l’adaptation aux conséquences aversives du traumatisme. Revue Francophone de Clinique Comportementale et Cognitive, V (1), 20–27.
Frommberger, U., Stieglitz, R.-D., Straub, S., Nyberg, E., Schlickewei, W., Kuner, E., & Berger, M. (1999). The concept of ‘sense of coherence’ and the development of posttraumatic stress disorder in traffic accident victims. Journal of Psychosomatic Research, 46(4), 343–348.
Glück, T. M., Tran, U. S., Raninger, S., & Lueger-Schuster, B. (2016). The influence of sense of coherence and mindfulness on PTSD symptoms and posttraumatic cognitions in a sample of elderly Austrian survivors of World War II. International Psychogeriatrics, 28(03), 435–441.
Hepp, U., Moergeli, H., Büchi, S., Wittmann, L., & Schnyder, U. (2005). Coping with serious accidental injury: a one-year follow-up study. Psychotherapy and Psychosomatics, 74(6), 379–386.
Hollifield, M., Warner, T. D., Krakow, B. J., Jenkins, J. H., & Westermeyer, J. J. (2009). The range of symptoms in refugees of war: the New Mexico Refugee Symptom Checklist-121. Journal of Nervous and Mental Disease, 197(2), 117–125.
Hyun Ju, Y. (2017). Predictors of posttraumatic stress in psychiatric nurses. Korean Journal of Occupational Health Nursing, 26(3), 125–132.
Jonsson, A., Segesten, K., & Mattsson, B. (2003). Post-traumatic stress among Swedish ambulance personnel. Emergency Medicine Journal, 20(1), 79–84.
Kaiser, C. F., Sattler, D. N., Bellack, D. R., & Dersin, J. (1996). A Conservation of Resources approach to a natural disaster: sense of coherence and psychological distress. Journal of Social Behavior and Personality, 11(3), 459–476.
Kassen, M., & DiLalla, D. (2008). Maladaptive defense style and traumatic stress reactions in a specialized unit of the South African Police Service. Journal of Forensic Psychology Practice, 8(3), 262–279.
Kazlauskas, E., Gailiene, D., Vaskeliene, I., & Skeryte-Kazlauskiene, M. (2017). Intergenerational transmission of resilience? Sense of coherence is associated between Lithuanian survivors of political violence and their adult offspring. Frontiers in Psychology, 8. doi:10.3389/fpsyg.2017.01677
Kaźmierczak, I., Strelau, J., & Zawadzki, B. (2016). Post-traumatic cognitions as a mediator of the relationship between sense of coherence and post-traumatic stress disorder after motor vehicle accidents. Transportation Research Part F: Traffic Psychology and Behaviour, 41(Part A), 38–44.
Kindermann, D., Schmid, C., Derreza-Greeven, C., Huhn, D., Kohl, R. M., Junne, F., … Nikendei, C. (2017). Prevalence of and risk factors for secondary traumatization in interpreters for refugees: A cross-sectional study. Psychopathology, 50(4), 262–272.
Livneh, H., & Martz, E. (2014). Coping strategies and resources as predictors of psychosocial adaptation among people with spinal cord injury. Rehabilitation Psychology, 59(3), 329.
Mehnert, A., Nanninga, I., Fauth, M., & Schäfer, I. (2012). Course and predictors of posttraumatic stress among male train drivers after the experience of ‘person under the train’ incidents. Journal of Psychosomatic Research, 73(3), 191–196.
Nielsen, M. B., Matthiesen, S. B., & Einarsen, S. (2008). Sense of coherence as a protective mechanism among targets of workplace bullying. Journal of Occupational Health Psychology, 13(2), 128.
Nishi, D., Matsuoka, Y., & Kim, Y. (2010). Posttraumatic growth, posttraumatic stress disorder and resilience of motor vehicle accident survivors. BioPsychoSocial Medicine, 4(1), 1.
Noyman-Veksler, G., Herishanu-Gilutz, S., Kofman, O., Holchberg, G., & Shahar, G. (2015). Post-natal psychopathology and bonding with the infant among first-time mothers undergoing a caesarian section and vaginal delivery: Sense of coherence and social support as moderators. Psychology & Health, 30(4), 441–455.
Pham, P. N., Vinck, P., Kinkodi, D. K., & Weinstein, H. M. (2010). Sense of coherence and its association with exposure to traumatic events, posttraumatic stress disorder, and depression in eastern Democratic Republic of Congo. Journal of Traumatic Stress, 23(3), 313–321.
Ratzer, M., Brink, O., Knudsen, L., & Elklit, A. (2014). Posttraumatic stress in intensive care unit survivors–a prospective study. Health Psychology and Behavioral Medicine: An Open Access Journal, 2(1), 882–898.
Römisch, S., Leban, E., Habermas, T., & Döll-Hentschker, S. (2014). Evaluation, immersion, and fragmentation in emotion narratives from traumatized and nontraumatized women. Psychological Trauma: Theory, Research, Practice, and Policy, 6(5), 465.
Scheffer Lindgren, M., & Renck, B. (2008). ‘It is still so deep-seated, the fear’: psychological stress reactions as consequences of intimate partner violence. Journal of Psychiatric and Mental Health Nursing, 15(3), 219–228.
Schnyder, U., Büchi, S., Mörgeli, H., Sensky, T., & Klaghofer, R. (1999). Sense of coherence–a mediator between disability and handicap? Psychotherapy and Psychosomatics, 68(2), 102–110.
Schnyder, U., Wittmann, L., Friedrich-Perez, J., Hepp, U., & Moergeli, H. (2008). Posttraumatic stress disorder following accidental injury: rule or exception in Switzerland? Psychotherapy and Psychosomatics, 77(2), 111–118.
Sommer, I., & Ehlert, U. (2004). Adjustment to trauma exposure: prevalence and predictors of posttraumatic stress disorder symptoms in mountain guides. Journal of Psychosomatic Research, 57(4), 329–335.
Steinlin, C., Dölitzsch, C., Kind, N., Fischer, S., Schmeck, K., Fegert, J. M., & Schmid, M. (2017). The influence of sense of coherence, self-care and work satisfaction on secondary traumatic stress and burnout among child and youth residential care workers in Switzerland. Child & Youth Services, 38(2), 159–175.
Stramrood, C. A., Paarlberg, K. M., In’t Veld, E. M. H., Berger, L. W., Vingerhoets, A. J., Schultz, W. C. W., & Van Pampus, M. G. (2011). Posttraumatic stress following childbirth in homelike- and hospital settings. Journal of Psychosomatic Obstetrics & Gynecology, 32(2), 88–97.
Streb, M., Häller, P., & Michael, T. (2014). PTSD in paramedics: Resilience and sense of coherence. Behavioural and Cognitive Psychotherapy, 42(04), 452–463.
Tagay, S., Erim, Y., Brähler, E., & Senf, W. (2006). Religiosity and sense of coherence–Protective factors of mental health and well-being? Zeitschrift Für Medizinische Psychologie, 15(4), 165–171.
Tagay, S., Schlottbohm, E., Reyes-Rodriguez, M. L., Repic, N., & Senf, W. (2014). Eating disorders, trauma, PTSD, and psychosocial resources. Eating Disorders, 22(1), 33–49.
Teegen, F., & Handwerk, U. (2006). Deutsche Frontkrankensch western im II. Weltkrieg. Zeitschrift Für Gerontopsychologie & -Psychiatrie, 19(3), 127–138.
Tham, V., Christensson, K., & Lena Ryding, E. (2007). Sense of coherence and symptoms of post-traumatic stress after emergency caesarean section. Acta Obstetricia et Gynecologica Scandinavica, 86(9), 1090–1096.
van der Hal-van Raalte, E., van IJzendoorn, M. H., & Bakermans–Kranenburg, M. J. (2008). Sense of coherence moderates late effects of early childhood Holocaust exposure. Journal of Clinical Psychology, 64(12), 1352–1367.
Veronese, G., Fiore, F., Castiglioni, M., el Kawaja, H., & Said, M. (2012). Can sense of coherence moderate traumatic reactions? A cross-sectional study of Palestinian helpers operating in war contexts. British Journal of Social Work, 43(4), 651–666.
Veronese, G., & Pepe, A. (2014). Sense of coherence mediates the effect of trauma on the social and emotional functioning of Palestinian health providers. American Journal of Orthopsychiatry, 84(5), 597.
Veronese, G., & Pepe, A. (2017). Sense of coherence as a determinant of psychological well-being across professional groups of aid workers exposed to war trauma. Journal of Interpersonal Violence, 32(13), 1899–1920.
Wettergren, L., Langius, A., Bjorkholm, M., & Bjorvell, H. (1999). Post-traumatic stress symptoms in patients undergoing autologous stem cell transplantation. Acta Oncologica, 38(4), 475–480.
Zerach, G., & Levin, Y. (2018). Posttraumatic stress symptoms, burn-out, and compassion satisfaction among body handlers: The mediating role of sense of coherence and spirituality at workplace. Journal of Interpersonal Violence, 33(12), 1931–1957.
Appendix C
Table C1. Results of the main analyses and nominally scaled moderator variables (outliers included).
Table C2. Results for the interval scaled moderator variables (outliers included).
Figure C1. Moderating effect of age on the relationship between sense of coherence and post-traumatic stress disorder (PTSD) symptoms. Smaller dots indicate larger standard errors, i.e. more precise findings are shown as larger dots.