
ABSTRACT
Background: The diagnosis of complex posttraumatic stress disorder (CPTSD) has been suggested for inclusion in the 11th version of the International Classification of Diseases (ICD-11), with support for its construct validity coming from studies employing Latent Class Analysis (LCA) and Latent Profile Analysis (LPA).
Objective: The current study aimed to critically evaluate the application of the techniques LCA and LPA as applied in previous studies to substantiate the construct validity of CPTSD.
Method: Both LCA and LPA were applied systematically in one sample (n = 245), replicating the setup of previous studies as closely as possible. The interpretation of classes was augmented with the use of graphical visualization.
Results: The LCA and LPA analyses indicated divergent results in the same dataset. LCA and LPA partially supported the existence of classes of patients endorsing different PTSD and CPTSD symptom patterns. However, further inspection of the results with scatterplots did not support a clear distinction between PTSD and CPTSD, but rather suggested that there is much greater variability in clinical presentations amongst adult PTSD patients than can be fully accounted for by either PTSD or CPTSD.
Discussion: We argue that LCA and LPA may not be sufficient methods to decide on the construct validity of CPTSD, as different subgroups of patients are identified, depending on the statistical exact method used and the interpretation of the fit of different models. Additional methods, including graphical inspection should be employed in future studies.
HIGHLIGHTS
• The necessity of Complex PTSD (CPTSD) as a separate diagnosis is under debate. • We evaluated the contribution of latent modelling techniques to this debate.• Results indicated that these techniques are insufficient for settling this debate.
Antecedentes: El diagnóstico de Trastorno por Estrés Postraumático Complejo (TEPTC) ha sido sugerido para su inclusión en la 11ª versión de la Clasificación Internacional de Enfermedades (CIE-11), con el respaldo de su validez de constructo proveniente de estudios que emplean Análisis de Clases Latentes (LCA) y Análisis de Perfil Latente (APL).
Objetivo: El presente estudio tuvo como objetivo evaluar críticamente la aplicación de las técnicas LCA y APL, utilizadas en estudios anteriores, para corroborar la validez de constructo del TEPTC.
Método: Se aplicaron sistemáticamente, tanto la técnica LCA como la técnica APL, en una muestra (n = 245), que buscó replicar lo más fielmente posible las configuraciones empleadas en estudios previos. La interpretación de las clases se potenció con el uso de visualización gráfica.
Resultados: Los análisis LCA y APL indicaron resultados divergentes en el mismo conjunto de datos. LCA y APL apoyaron parcialmente la existencia de clases de pacientes que validan diferentes patrones de síntomas para el TEPT y el TEPTC. Sin embargo, una mayor inspección de los resultados con diagramas de dispersión no respaldó una distinción clara entre el TEPT y el TEPTC, sino que sugirieron que existe una variabilidad mucho mayor en las presentaciones clínicas entre los pacientes adultos con TEPT de lo que pueda explicarse ya sea por el TEPT o el TEPTC.
Discusión: Proponemos que los análisis LCA y APL pueden ser métodos insuficientes para decidir sobre la validez de constructo del TEPTC, ya que se identifican diferentes subgrupos de pacientes, que depende del método estadístico utilizado y la interpretación del ajuste de diferentes modelos. En futuros estudios deben emplearse métodos adicionales que incluyan la inspección gráfica.
背景: 复杂性创伤后应激障碍 (CPTSD) 的诊断已被建议纳入第11版《国际疾病分类》 (ICD-11) 中, 且有使用潜在类别分析 (LCA) 和潜在剖面分析 (LPA) 的研究支持其结构效度。
目标: 本研究旨在严格评估LCA和LPA技术在前人证实CPTSD结构效度的研究中的应用。
方法: 在一个245人的样本中系统地应用LCA和LPA, 尽可能重复前人研究的设置。使用图形可视化来提高对类别的解读。
结果: LCA和LPA分析在同一数据集中显示出不同的结果。 LCA和LPA部分支持存在不同PTSD和CPTSD症状模式的患者类别。但是, 用散点图进一步检查的结果并不支持PTSD和CPTSD之间有明确的差别, 而是表明成年PTSD患者临床表现的变异性要比其可被PTSD或CPTSD完全解释的可能性大得多。
讨论: 我们认为, LCA和LPA可能不足以确定CPTSD的结构效度, 因为根据所用的精确统计方法和对不同模型拟合度的解释, 识别出了不同的患者亚组。未来的研究应采用其他方法, 包括图形检查。
Clinical and epidemiological research has indicated a significant association between trauma exposure and a variety of psychological disorders including post-traumatic stress disorder (PTSD; e.g. Copeland, Keeler, Angold, & Costello, Citation2007), with an estimated lifetime prevalence in the general population of 6.1% in the USA (Goldstein et al., Citation2016). In the most recent version of the Diagnostic and Statistical Manual of Mental Disorders (DSM-5), PTSD has been categorized in the group of trauma- and stressor-related disorders, and is defined by symptoms of intrusions, avoidance, hyperarousal, and negative alterations in cognitions or mood (American Psychiatric Association, Citation2013). The 11th version of the International Classification of Diseases (ICD-11) is scheduled to include, in addition to PTSD, the related diagnosis of complex post-traumatic stress disorder (CPTSD; Maercker et al., Citation2013). About a quarter of all PTSD patients have been found to meet the criteria for this proposed diagnosis (Wolf et al., Citation2015), consisting of disturbances in three domains of self-organization (DSO) in addition to the core PTSD symptoms. These DSO symptoms pertain to (1) affective dysregulation (e.g. having temper outbursts), (2) negative self-concept (e.g. feelings of guilt or worthlessness), and (3) interpersonal problems (e.g. feeling socially isolated).
Support for the construct validity of the ICD-11 CPTSD diagnosis has been claimed in several empirical studies employing techniques aimed at identifying latent clusters of individuals (Brewin et al., Citation2017). These studies notably involve latent class analysis (LCA), which aims to identify substantively meaningful groups of people (also called classes) who are similar in their responses on categorically scored variables, and latent profile analysis (LPA), which does the same for responses on continuously scored variablesFootnote 1 . However, as we will explain, these techniques have a number of limitations. In addition, and as we will discuss, these methods have not been applied in a consistent manner.
Cloitre, Garvert, Brewin, Bryant, and Maercker (Citation2013) were the first to employ LPA to determine whether different classes could be identified according to the PTSD and CPTSD symptom profiles in a sample of individuals seeking treatment for interpersonal types of trauma (i.e. ranging from 9/11 experiences to childhood abuse; n = 302). The items used to evaluate the DSO construct were selected from existing instruments and based on face validity, with one item from the Modified PTSD Symptom Scale – Self-Report Severity (MPSS-SR; Falsetti, Resnick, Resick, & Kilpatrick, Citation1993) and five items from the 53-item Brief Symptom Inventory (BSI-53; Derogatis & Melisaratos, Citation1983). All six PTSD items were taken from the MPSS-SR. Three classes of individuals were identified based on the results of the LPA: (1) a low symptom class (32% of the sample) characterized by generally low scores on all types of symptoms (2) a PTSD class (32%) showing high scores on core PTSD symptoms, but low scores on DSO symptoms, and (3) a CPTSD class (36%), defined by high scores on both core PTSD symptoms and DSO symptoms. The results of this analysis were interpreted as supporting the ICD-11 distinction between PTSD and CPTSD.
Shortly after, Cloitre, Garvert, Weiss, Carlson, and Bryant (Citation2014) performed a LCA (n = 280 women with histories of childhood abuse) in order to investigate whether CPTSD is distinct from PTSD with comorbid Borderline Personality Disorder (BPD). For assessing DSO symptoms, the same six items as in the 2013 LPA were used, while six comparable items were used for assessing PTSD (i.e. from the Clinician-Administered PTSD Scale [CAPS]; Blake et al., Citation1995). In addition, nine items were included that measured BPD symptoms (from the Structured Clinical Interview for Axis II Disorders [SCID-II] DSM–IV BPD Module; First, Spitzer, Gibbon, & Williams, Citation1999). The results were interpreted as indicating four different symptom classes: (1) An overall low symptom class (20% of the total sample), (2) a PTSD class with a high level of PTSD symptoms, but low levels of DSO and BPD symptoms (26%), (3) a CPTSD class (28%) with high levels of PTSD and DSO symptoms, but low levels of BPD symptoms, and (4) an overall high symptom class (26%)Footnote 2 . Several more studies employing LCA and LPA have reported results that were interpreted as demonstrating distinct classes of PTSD and CPTSD. These studies were performed in different clinical and community samples of traumatized individuals, including samples of parents who lost a child, rape victims, victims of physical assault (all described in Elklit, Hyland, & Shevlin, Citation2014), individuals referred to a trauma centre for psychological therapy (Karatzias et al., Citation2017), adult survivors of institutional abuse (Knefel, Garvert, Cloitre, & Lueger-Schuster, Citation2015), a community sample of adolescents with interpersonal trauma (Perkonigg et al., Citation2016), and a trauma sample of children and adolescents (Sachser, Keller, & Goldbeck, Citation2017). Taken together, these studies have claimed growing support for the validity of distinct PTSD and CPTSD patient groups.
Methodological decisions have not been entirely consistent across these previous studies. Notably, in different studies, different statistical techniques (i.e. CFA, LCA and LPA) were reported without making explicit the arguments for choosing a particular method. For example, Cloitre et al. (Citation2013) first used LPA (which treats its observed variables as continuous), but several other studies used LCA on variables with the same measurement level (i.e. recoding 5 point scale variables into dichotomous variables). Since methods treating variables as continuous generally retain more information from the observed variables than categorical methods, it is unclear why LCA was chosen in these cases.
Moreover, previous studies have used different criteria to decide between models with differing numbers of latent groups. Most authors (Cloitre et al., Citation2013, Citation2014; Elklit et al., Citation2014; Karatzias et al., Citation2017; Knefel et al., Citation2015; Sachser et al., Citation2017) have referred to the same simulation study by Nylund, Asparouhov, and Muthén (Citation2007) in their decision for fit statistics to use as criteria. However, the same criteria have been given unequal weight across studies.
In addition to these methodological issues, the question can be raised how appropriate latent modelling techniques such as LCA/LPA are as methods for the purpose of settling the discussion on separate diagnostic categories for PTSD versus CPTSD, or whether alternative and/or additional methods are needed. After all, these techniques do what they are asked to do: Seek out the most plausible clusters of individuals in a given data set. Therefore, it is important to assess whether identified clusters of patients can be meaningfully interpreted as distinct from each other, that is, whether they represent different latent constructs, or whether they solely differ in terms of symptom severity. The current study aimed to critically evaluate the application of LCA and LPA as a means to settle the issue on the validity of PTSD vs. CPTSD as separate diagnoses, answering the question: Is the use of these methods a valid and decisive way to settle this issue? This was done by systematically applying these techniques in one and the same sample and using the same symptom items in both analyses. We evaluated the consistency of results of these analyses, and employed further graphical visualization in order to interpret the results of the LCA/LPA analyses. The current study thus was not intended as the next study in a line of studies that uses the same methodology in a new sample, nor was it intended to answer the question: Is a separate CPTSD diagnosis valid? The focus instead is on exploring the methodological, statistical, and conceptual caveats that accompany the use of LCA and LPA. In doing this, we attempted to replicate the methodology as employed by earlier LPA/LCA studies as closely as possible, while explicitly reporting the relevant analytic and methodological decisions involved and taking into account noted limitations pertaining to setup and data analysis of previous studies.
1. Method
1.1. Participants
The data for these analyses were obtained as part of a routine assessment at the start of treatment at a Dutch mental health institute between 2012 and 2015. Patients (n= 245) were asked permission to use their data anonymously for scientific research. Data of patients who objected were removed. According to the Medical Ethics Review Board of the University Medical Centre Groningen, the Declaration of Helsinki and the Dutch Medical Research Involving Humans Subjects Act concerning scientific research ethics approval was not applicable to the present study. All individuals were in treatment and had been diagnosed with PTSD. A majority reported multiple traumatization of different types (60%), and trauma before age 16 (65%). Furthermore, 76% reported trauma of an interpersonal nature, 49% reported physical abuse, and 42% reported sexual abuse.
The data are a subset of individuals who had a main diagnosis of PTSD in a larger archival dataset of n = 1427. However, only a selection of individuals had filled out the questionnaires that we selected to represent the PTSD and DSO symptom clusters; therefore, only 245 participants could be included in the current study. All participants had been diagnosed with PTSD by a clinician according to DSM-IV criteria. The mean sample score on the IES-R was 59.3 (range 6–88). This indicates relatively severe posttraumatic symptomatology in this sample, as a score of 33 on the IES-R has been reported as the best cut-off for a likely diagnosis of PTSD (Creamer, Bell, & Failla, Citation2003). Fifty-seven per cent of participants were diagnosed with at least one other DSM-IV axis 1 disorder, mostly mood/depressive disorder (39% of total sample). The sample had a mean age of 36.2 (SD = 12.24), and 68% was female. Education level was known for 206 participants (84%), of which 14% had a low education level (primary school education), 67% had a medium education level (any secondary education; low to medium levels of tertiary vocational education), and 19% was classified as having a high education level (higher levels of tertiary education). The current sample was comparable to the total archival dataset in terms of age, gender, and education levelFootnote 3 .
1.2. Measures
In line with previous studies, six PTSD and six DSO items were chosen as representative of the PTSD and DSO symptom clusters in the current analysis. In the selection of items to represent the DSO symptom clusters, previous authors have been relatively consistent, as most (Karatzias et al., Citation2017; Knefel et al., Citation2015; Perkonigg et al., Citation2016) have used the same BSI items as used by Cloitre et al. (Citation2013, Citation2014) to represent the DSO clusters. However, for other studies, the items selected to represent the symptom clusters were similar in content but sometimes taken from different measures (as in Elklit et al., Citation2014). For this study, we did not use the exact same items as in previous studies, but item content was similar to those items used in earlier studies (e.g. Cloitre et al., Citation2013, Citation2014; Elklit et al., Citation2014; Knefel et al., Citation2015; Perkonigg et al., Citation2016). All PTSD items were selected from the Impact of Events Scale – Revised (IES-R; Weiss & Marmar, Citation1997): Items 10 and 16 for the ‘Hyperarousal’ cluster, items 13 and 21 for the ‘Re-experiencing’ cluster, and items 17 and 19 for the ‘Avoidance’ cluster. CPTSD items were selected from the Outcome Questionnaire 45 (OQ-45; Lambert et al., Citation1996) and from the Symptom Questionnaire 48 (SQ-48; Carlier et al., Citation2012): Items 5 and 15 of the OQ-45 for the ‘Negative self-concept’ cluster items 18 and 30 of the OQ-45 for the ‘Disturbances in interpersonal relationships cluster and items 7 and 21 of the SQ-48 for the ‘Affective dysregulation’ cluster. All questionnaires were in Dutch. Responses were on a five-point scale ranging from 0 (‘not at all’) to 4 (‘almost always’) for the IES-R, and from 0 (‘never’) to 4 (‘very often’) for both the OQ-45 and the SQ-48. For the LCA, the 12 symptom items were coded dichotomously. Symptom scores of 0 and 1 (‘never’, ‘rarely’) were coded as 1 (‘symptom absent’), while symptom scores of 2, 3, and 4 (‘sometimes’, ‘often’, ‘(almost) all of the time’/‘very often’) were coded as 2 (‘symptom present’).Footnote 1 This coding follows most earlier mentioned papers, with the exception of Perkonigg et al. (Citation2016), where symptoms were coded as present when they were rated 3 or 4, and Sachser et al. (Citation2017), where different endorsement cut-offs were used for different items.
1.3. Statistical analyses
1.3.1. Assessing model fit
The current analysis has employed the most-often used measures to assess the fit of the different class-models originating from the LCA/LPA. Increasing the number of parameters in a model always increases the log-likelihood and the fit of that model, but it also makes the model less parsimonious. Most information criteria therefore assign a penalty to the calculated log-likelihood based on the number of estimated parameters. The difference between the Bayesian Information Criterion (BIC; Schwarz, Citation1978), the Akaike Information Criterion (AIC; Akaike, Citation1987), the sample-size adjusted BIC (SA-BIC, Sclove, Citation1987), and the integrated complete-data likelihood criterion (ICL; Biernacki, Celeux, & Govaert, Citation2000) is determined by how that penalty component is calculated.
Likelihood ratio tests form another type of evaluating model fit. Such tests evaluate the relative fit of a model by comparing a k-class solution to the k-1-class solution. The bootstrap likelihood ratio test (BLRT; McLachlan, Citation1987) employs a bootstrap resampling method to assess the p-value associated with the log of this likelihood ratio. A low p-value indicates that the k-class model performs significantly better than the k-1-class model. As yet, none of these criteria or tests have been proven to perform best in identifying the best-fitting model, which is why, mostly, a combination of these measures is used (Nylund et al., Citation2007; Tein, Coxe, & Cham, Citation2013). In addition, entropy values are computed, which refer to the uncertainty of classification of cases to clusters, and they are calculated using the individual posterior probabilities of class membership (Celeux & Soromenho, Citation1996). Values closer to 1 represent better fit and better separation between the classes.
1.3.2. LCA
Models with an increasing number of classes were estimated, until fit indices and likelihood-based tests indicated no further model improvement. Fit indices used were the BIC, the AIC, and the SA-BIC. The BLRT was also calculatedFootnote 4 . The LCA models were run in R using the R-package ‘poLCA’ (Linzer & Lewis, Citation2011).
Within poLCA, parameter estimates are obtained by a procedure that repeatedly improves estimates. This is stopped when no further improvements are obtained, or until a maximum number of iterations is reached. The starting values are the values at which such repetitions were started. Increasing the number of iterations (cycles within each estimation) and setting more different starting values for each repetition results in a greater likelihood that the global (rather than local) maximum of the log-likelihood function (and thus, the best possible solution) is reached. The maximum number of iterations was chosen as 10.000, and 500 different sets of starting values were used (thus going beyond the recommendations by Linzer & Lewis, Citation2011; Oberski, Citation2016). As such, the influence of chance was minimized while the reproducibility of the results was maximized.
1.3.3. LPA
The R-package ‘mclust’ was used to carry out the LPA (Scrucca, Fop, Murphy, & Raftery, Citation2016). This package allows for different types of models to be specified. The selected model was the one with equal variances across classes and zero covariances, as this is most in line with classical LPA and the default implementation in MPlus. For choosing the number of classes, in line with Nylund et al. (Citation2007) and Scrucca et al. (Citation2016), the BLRT, the BIC and the ICL were inspected. SA-BIC was not calculated for the LPA models, as Nylund et al. (Citation2007) have shown poor performance when the outcome variable is continuous (as it is in the LPA).
2. Results
Symptom endorsement was high, with most item endorsement rates >80%. Notably, the mean of item 21 of the SQ48 (‘I had difficulty controlling my anger’) was lower than all other item means (at 1.64) and its endorsement rate was also lowest (56.3%). In addition, removing this item from the CPTSD scale resulted in an increase of the Cronbach’s alpha from .76 to .79, despite the fact that the number of items was decreased. Based on this reliability assessment, we decided to omit this SQ-48 item 21 from all subsequent analysesFootnote 5 . Cronbach’s alpha of the PTSD scale was .77.
2.1. LCA
The latent class model estimations and their respective fit indices are provided in . The BIC was lowest for the two-class model, and next for the three-class model, while the SA-BIC and AIC were both lowest for the five-class model. The BLRT was statistically significant at α = .05 up until the five-class modelFootnote 6 . Since there is no gold standard for which fit statistic outperforms the others, this demonstrates how difficult it can be to select a model with conflicting fit indices. For substantive reasons, a five-class model did not seem appropriate following any current conceptualization of posttraumatic symptomatology and was therefore not investigated. Rather than choosing one model on the basis of fit indices, we chose to inspect two solutions that, in principle, could be in line with current theory. Therefore, the two- and three-class models were inspected.
Table 1. Latent class analysis models and fit indices.
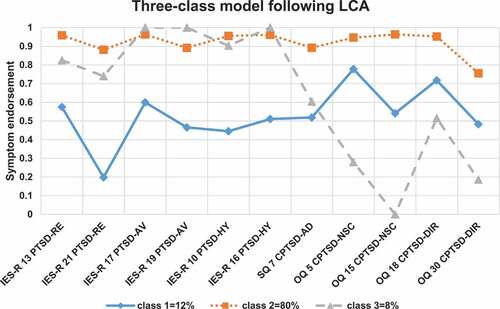
and provide per model the proportions per class of patients who endorsed single symptom items, and the proportions of participants for each class. Class sizes differed substantially. Both in the two-class model and in the three-class model, the largest class (76% and 80%, respectively) showed an overall high symptom endorsement pattern. These classes could be labelled ‘CPTSD’ classes, since their symptom pattern is congruent with a CPTSD diagnosis. Then, for the two-class model, the smallest class of 24% shows a similar CPTSD symptom structure, but with lower overall endorsement rates. For the three-class model, two smaller groups were identified, of which the 12% group showed a similar decreased overall symptom level and a rather small group (consisting of 8% of the sample) fits a PTSD without CPTSD profile.
Figure 1. Symptom endorsement patterns for the 2-class model following latent class analysis. Symptom abbreviations: RE = re-experiencing; AV = avoidance; HY = hyperarousal; AD = affective dysregulation; NSC = negative self-concept; DIR: disturbances in interpersonal relationships.
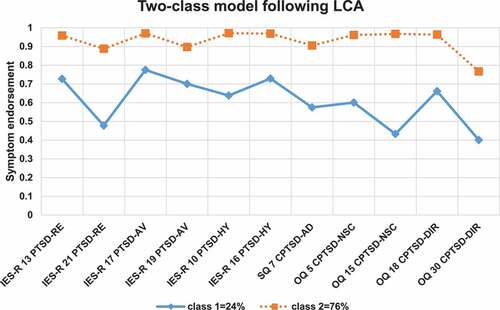
Figure 2. Symptom endorsement patterns for the 3-class model following latent class analysis. Symptom abbreviations: RE = re-experiencing; AV = avoidance; HY = hyperarousal; AD = affective dysregulation; NSC = negative self-concept; DIR: disturbances in interpersonal relationships.
2.2. LPA
The results of the LPA can be found in . Since BLRT p-values were significant for every model comparison (at α= .05), except the one comparing the seven-class model to the six-class model, they did not help much in choosing among the models. Instead, BIC- and ICL-values were inspected, with the BIC-values indicating the four-class model to perform best, and the ICL-values indicating a similar fit for the three-, and four-class models. Taken together, the four-class model seemed the most relevant to inspect.
Table 2. Latent profile analysis models and fit indices.
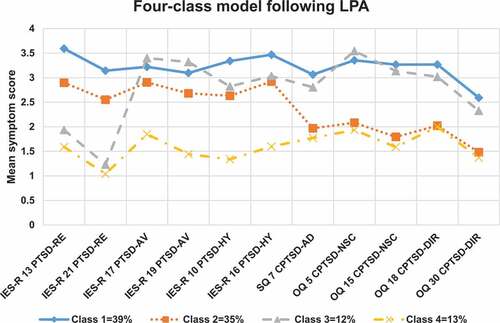
For this four-class model, the resulting item means per class and the proportions of patients in each class are displayed in . Three out of four classes in this model (class 1, 3, and 4 in the figure) showed similar symptom patterns (although with different mean symptom levels), all consistent with the conceptualization of CPTSD. Notably, one of these classes (of 12%) did have a relatively lower mean level of re-experiencing symptoms, with the mean of one re-experiencing item around 1. Another class, however, (class 2, consisting of 35% of the sample) showed a pattern of moderate to high PSTD symptoms, but slightly lower CPTSD symptoms. This might seem consistent with a conceptualization of PTSD and CPTSD as separate diagnoses. However, it is worth noting that even in this ‘PTSD’ class CPTSD symptoms are still moderately endorsed. Also, the PTSD class size differed substantially across the LCA three-class and LPA four-class analyses; the class that was identified as a PTSD class in the LCA results contained 8% of the patients (in the three-class model), while the comparable PTSD class in the LPA results contained 35% of the patients.
Figure 3. Class proportions and mean scores on each item for each class, for the 4-class model (with spherical clusters of unequal size) resulting from the latent profile analysis. Symptom abbreviations: RE = re-experiencing; AV = avoidance; HY = hyperarousal; AD = affective dysregulation; NSC = negative self-concept; DIR: disturbances in interpersonal relationships.
In order to study to what extent classes were actually distinct, shows the distribution of the number of reported PTSD symptoms versus the number of reported CPTSD symptoms (jittered by small random values to avoid points to overlap exactly), sorted by group membership retrieved from the LCA three-class model. Similarly, shows the distribution of sum scores of PTSD versus CPTSD symptoms (scored 1–5) sorted by group membership retrieved from the LPA four-class model.
Figure 4. Jittered scatterplot with the sum of present PTSD symptoms (items scoring >1 on a 0–4 scale) versus the sum of present CPTSD-specific items (items scoring >1 on a 0–4 scale). Colour of points corresponds to class membership of the three-class model following latent class analysis; (blue) diamond = class 1 (CPTSD with low symptom endorsement), (red) square = class 2 (CPTSD), (grey) triangle = class 3 (PTSD).
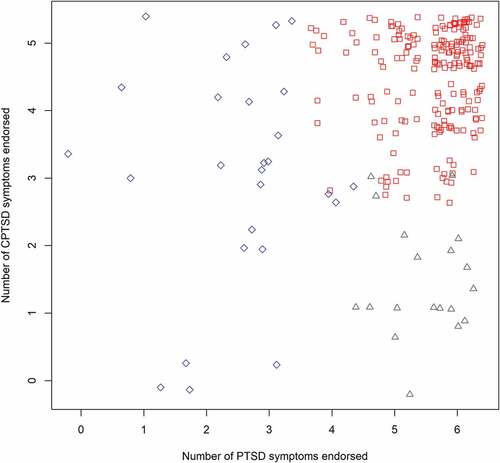
Figure 5. Jittered scatterplot with the sum of the scores on all six PTSD symptom items (scored 1–5) versus the sum of the scores on all CPTSD-specific items (scored 1–5) that were included in the latent profile analysis. Colour of points corresponds to class membership of the four-class model following latent profile analysis; (blue) diamond = class 1, (red) square = class 2, (grey) triangle = class 3 (PTSD), (orange) cross = class 4.
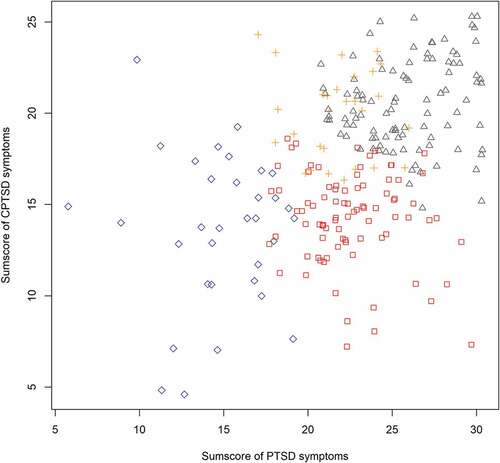
These figures clearly demonstrate that there are no natural well-separated clusters in these dataFootnote 7 . Upon closer inspection, one can see that in both figures, each cluster approximately covers a different quadrant of the plot. The cluster in the right upper side of the plot is the largest, indicating a relatively high level of symptoms. Moreover and surprisingly, and inconsistent with the theory of separate PTSD vs. CPTSD clusters, there are some few participants with very low PTSD scores and high CPTSD scores. In addition, there appears to be a diagonal line around which most participants’ scores lie, running from the bottom left to the top right of the figure. This implies that generally, greater PTSD symptom severity also relates to greater CPTSD severity. Most importantly, however, the figures make it clear that, even though the LCA and LPA analyses yielded classes of patients, these classes cannot be associated with clearly distinct symptom profiles. That is, the classes are very close to each other (and even overlap slightly), and there are many patients near the class borders. This implies that many patients from one class score comparably to patients from other classes. Rather than showing a quantitative or qualitative difference between the classes, these data at most show a gradual difference between the classes defined by the LPA.
3. Discussion
The goal of the current study was to critically assess the contribution of techniques commonly used in previous research (i.e. LCA and LPA) to inform about the validity of distinct PTSD and CPTSD diagnoses. To this end, both LCA and LPA were systematically applied in the same sample, replicating the methodology as employed by earlier LPA/LCA studies. The results were thoroughly analysed and supplemented with the use of graphical visualization.
The results of the three-class model obtained through LCA appeared to support a categorical distinction between PTSD and CPTSD patients. This was in line with other studies that have employed LCA (Cloitre et al., Citation2014; Elklit et al., Citation2014; Perkonigg et al., Citation2016). However, graphical inspection of the LCA results suggested that the indicated clusters were not well separated. Scatterplots indicated that an individual in the ‘PTSD’ group did not necessarily differ much with regard to DSO symptom level when compared to someone in the ‘CPTSD’ group. Thus, the LCA helped to identify clusters, but subsequent analyses showed that these clusters were not consistent with the conceptualization of distinct PTSD vs. CPTSD groups. Importantly, in dichotomizing symptoms into absent versus present (as is common practice in LCA models; Nylund-Gibson & Choi, Citation2018), information concerning symptom level is discarded. However, information on symptom level is vital in providing unambiguous classes interpretation and in the current application of LCA. The very question of a distinction between PTSD and CPTSD classes pertains not only to whether symptoms are endorsed but also to what degree symptoms are endorsed. In addition, the two-class model retrieved through the LCA seemed to be an equally adequate description of the current sample. In this model, a PTSD class showing no CPTSD symptoms could not be identified, as the classes only differed in symptom severity.
LPA does take into account symptom levels but the results were inconclusive. The analysis did result in one class resembling a PTSD symptom profile, but for this class, DSO items were also moderately endorsed by the participants (around the level of ‘2ʹ, which indicates that the average member of this class is also to some extent troubled by DSO symptomatology). Thus, when symptom level information was retained (as is done in the LPA), no clear clusters distinct in content were observed. Moreover, shows that when viewing the summed raw scores for the participants in all classes, an array of simple and complex traumatic psychopathology can be seen across all traumatized patients. The identified clusters are directly adjacent, which again indicates the arbitrary nature of strict borders between them. The scatterplots and LPA results thus indicated that patients with CPTSD and PTSD symptom profiles may differ more gradually than qualitatively.
Interestingly, the results of the methodologically most sophisticated study so far by Wolf et al. (Citation2015) also did not indicate a clear PTSD vs. CPTSD group. This study included a direct comparison of several models, that is confirmatory factor models, latent profile models, and several FMMs (i.e. hybrid models including both latent classes and factors; these models assume that individuals may be differentiated by classes, but their responses are also influenced by one or more underlying dimensional variables). The results of this study indicated that the groups differed from each other based on their level of severity along both a latent PTSD and CPTSD dimension but did not differ in terms of the type of psychopathology endorsed (i.e. PTSD vs. PTSD and CPTSD).
Some limitations of the current study are worth addressing. First, the current sample appeared to show quite a high level of both PTSD and DSO symptoms. Endorsement rates for PTSD and DSO symptoms in this study (mostly between 80% and 90%) were generally higher than in earlier similar studies, where in most studies scores fell between 40% and 60% (Cloitre et al., Citation2014; Knefel & Lueger-Schuster, Citation2013). The relatively high rates of both PTSD and DSO symptom endorsement could help explain the relative small size of the PTSD class that was found in the LCA analysis in the current study (about 8%). This is smaller than the size of the PTSD class in several previous studies, despite their inclusions of sometimes highly traumatized individuals (Cloitre et al., Citation2013, Citation2014; Elklit et al., Citation2014; Knefel et al., Citation2015; Perkonigg et al., Citation2016). However, even the small ‘class’ was quite widely spread over the space in , and not well separated from the other ‘classes’. Also, the class that resembled a PTSD profile most in the LPA was not small (i.e. about 35% of the entire sample). Sample size was relatively small in this study. It was, however, comparable to previous studies (e.g. Cloitre et al., Citation2014). The simulation study by Nylund et al. (Citation2007) showed that fit indices in LCA’s are more reliable when sample size increases from 200 to 1000. We recommend that the current analyses are performed in other, larger samples.
We recognize that the current results may not be generalizable to the larger population of individuals with a history of trauma. In the general population, there may exist a subgroup with high DSO and low PTSD symptoms, and it would be worthwhile to assess the existence/prevalence of such a symptom profile. However, the current study aimed to specifically assess the PTSD and CPTSD symptom profiles as proposed for the ICD-11. Both proposed diagnoses fully encompass the spectrum of PTSD symptoms, which is why we selected a sample of patients with symptoms that were clinically classified as PTSD symptoms.
Our analyses indicated that there may be different subgroups of adult psychiatric patients diagnosed with PTSD identified depending on the statistical methods used and the interpretation of the fit of different models tested. This neither rules in nor rules out CPTSD but suggests that there is much greater variability in clinical presentations amongst adult PTSD patients than can be fully accounted for by either PTSD or CPTSD. Most importantly, our results indicate that LPA and even more, LCA may not be ideal methods to settle the validity issue for separate PTSD vs. CPTSD constructs. Future studies should be supplemented with the use of graphical visualization of the group clustering.
It is critical to note that latent variable identification techniques (such as LCA and LPA) do not uncover ‘hidden’ groups that necessarily hold nosological utility; rather, they give the best fit of a model to the data. Also, these techniques do not give an indication of how well clusters are separated. The popularity of such methods might be explained by the apparent implication that results show clear (i.e. separate) clusters which are then assumed to represent a qualitatively distinct group of people with an existing disease entity. However, one should keep in mind that the classes formed are relative to each other and do not necessarily hold inherent meaning or clinical significance. When clusters are badly separated, the classification of an individual into a specific cluster becomes somewhat arbitrary. In other words, any two participants in the current study could have reported highly similar symptomatology, but they might have been classified into different clusters. This is far from a trivial point, as this classification can have far-reaching clinical consequences, most importantly, differential treatment. Moreover, diagnostic utility does not equal ontological truth. Dalenberg, Glaser, and Alhassoon (Citation2012) have argued that, in addition to statistical evidence, any argument for a PTSD subtype also necessitates an element of clinical meaningfulness. This meaningfulness can be represented by differential functional impairment, different trajectories of the disorder, differing risk factors, differing effective treatments, and/or differing comorbidities. These factors should be considered before concluding that a diagnostic categorization is warranted or not.
Acknowledgments
We thank Annet Nugter from GGZ Noord-Holland-Noord for assistance with data collection. This research did not receive any grant from funding agencies in the public, commercial, or not-for-profit sectors. The authors report no potential conflicts of interest.
Disclosure statement
No potential conflict of interest was reported by the authors.
Correction Statement
This article has been republished with minor changes. These changes do not impact the academic content of the article.
Notes
1 Following publication, we discovered that the item numbering of the IES-R items in this article was different from the item numbering in the official IES-R (Weiss & Marmar, 1996). We subsequently learned that this difference was because the IES-R items were presented in a slightly different order to the patients in the mental health organisation test system. This means that items 10, 16, 13, 21, 17, and 19 as presented here are items 10, 21, 9, 14, 11, and 22 in the official IES-R, respectively. Importantly, however, the content of all included items was consistent with the item selection of relevant previous papers, reflecting the appropriate items for capturing the PTSD clusters as intended.
1. In a few studies, Confirmatory Factor Analysis (CFA) was used to investigate the construct validity of CPTSD (e.g. Nickerson et al., Citation2016). CFA can be used to indicate to what extent CPTSD and PTSD scales measure different latent constructs along which people may or may not differ gradually, although a simple correlation between the two scales could be similarly informative. It is important to note that, by definition, CFA cannot be used as an argument to support the idea that PTSD and CPTSD should be viewed as representative of two separate patient groups. Consider, for example, CFA in studies with schizophrenia patients. These have yielded separate clusters for positive, negative, and disorganization symptoms (e.g. Grube, Bilde, & Goldman, Citation1998), but these clusters are still regarded as constitutive of a (single) diagnosis of schizophrenia.
2. The profile for this last group was not completely consistent with a hypothesized ‘PTSD with comorbid BPD’ group, as such a group would have been expected to score high on PTSD and BPD symptoms but not so on the CPTSD symptoms.
3. The n= 1427 sample was 71% female and had a mean age of 35.9 (SD = 11.9). Education level was known for 63%, of which 23% were classified as having low-level education, 63% medium level, and 14% high-level education.
4. Since the BLRT could not be computed in poLCA, we ran an analogous LCA in Latent Gold to compute its corresponding p-values.
5. We did perform an additional LCA and LPA with the SQ-48 item 21 included. Overall, the results indicated worse fit. Following the LCA, results were comparable to the current results. Following the LPA, fit indices again indicated a four-class model to fit relatively well, but the symptom profile was somewhat different for this four-class model. Classes now mainly differed in terms of symptom level, and on endorsement to the newly included item. One class (of 29%) was now mainly identified by relatively high endorsement of the included affect dysregulation item. In addition, still no class with a simple PTSD symptom profile (with high PTSD and low disorganization item levels) could be identified following this analysis.
6. BLRT was calculated following an analogous LCA that was performed in Latent Gold. The outcome of this LCA (including relative size of fit statistics and cluster profiles) was nearly identical to the outcome of the LCA performed in poLCA.
7. When item 21 of the SQ-48 was included in the analysis, the jittered scatterplot of the new LPA results showed classes to be even less distinct than before, with classes overlapping to a greater extent.
References
- Akaike, H. (1987). Factor analysis and AIC. Psychometrika , 52(3), 1–11.
- American Psychiatric Association . (2013). Diagnostic and statistical manual of mental disorders (5th ed.). Washington, DC: American Psychiatric Association.
- Biernacki, C. , Celeux, G. , & Govaert, G. (2000). Assessing a mixture model for clustering with the integrated completed likelihood. IEEE Transactions on Pattern Analysis and Machine Intelligence , 22(7), 719–725.
- Blake, D. D. , Weathers, F. W. , Nagy, L. M. , Kaloupek, D. G. , Gusman, F. D. , Charney, D. S. , & Keane, T. M. (1995). The development of a clinician-administered PTSD scale. Journal of Traumatic Stress , 8(1), 75–90.
- Brewin, C. R. , Cloitre, M. , Hyland, P. , Shevlin, M. , Maercker, A. , Bryant, R. A. , … Reed, G. M. (2017, December). A review of current evidence regarding the ICD-11 proposals for diagnosing PTSD and complex PTSD. Clinical Psychology Review , 58, 1–15.
- Carlier, I. V. E. , Schulte-Van Maaren, Y. W. M. , Wardenaar, K. J. , Giltay, E. J. , Van Noorden, M. S. , Vergeer, P. , & Zitman, F. G. (2012). Development and validation of the 48-item symptom questionnaire (SQ-48) in patients with depressive, anxiety and somatoform disorders. Psychiatry Research , 200(2–3), 904–910.
- Celeux, G. , & Soromenho, G. (1996). An entropy criterion for assessing the number of clusters in a mixture model. Journal of Classification , 13(2), 195–212.
- Cloitre, M. , Garvert, D. W. , Brewin, C. R. , Bryant, R. A. , & Maercker, A. (2013). Evidence for proposed ICD-11 PTSD and complex PTSD: A latent profile analysis. European Journal of Psychotraumatology , 4(1), 20706.
- Cloitre, M. , Garvert, D. W. , Weiss, B. , Carlson, E. B. , & Bryant, R. A. (2014). Distinguishing PTSD, complex PTSD, and borderline personality disorder: A latent class analysis. European Journal of Psychotraumatology , 5, 25097.
- Copeland, W. E. , Keeler, G. , Angold, A. , & Costello, E. J. (2007). Traumatic events and posttraumatic stress in childhood. Archives of General Psychiatry , 64(5), 577–584.
- Creamer, M. , Bell, R. , & Failla, S. (2003). Psychometric properties of the impact of event scale - revised. Behaviour Research and Therapy , 41(12), 1489–1496.
- Dalenberg, C. J. , Glaser, D. , & Alhassoon, O. M. (2012). Statistical support for subtypes in posttraumatic stress disorder: The how and why of subtype analysis. Depression and Anxiety , 29(8), 671–678.
- Derogatis, L. R. , & Melisaratos, N. (1983). The brief symptom inventory: An introductory report. Psychological Medicine , 13, 595–605.
- Elklit, A. , Hyland, P. , & Shevlin, M. (2014). Evidence of symptom profiles consistent with posttraumatic stress disorder and complex posttraumatic stress disorder in different trauma samples. European Journal of Psychotraumatology , 5, 24221.
- Falsetti, S. A. , Resnick, H. S. , Resick, P. A. , & Kilpatrick, D. G. (1993). The modified PTSD symptom scale: A brief self-report measure of posttraumatic stress disorder. The Behavior Therapist , 16, 161–162.
- First, M. B. , Spitzer, R. L. , Gibbon, M. , & Williams, J. B. W. (1999). Structured clinical interview for DSM-IV axis I disorders . New York: Biometrics Research Department, New York State Psychiatric Institute.
- Goldstein, R. B. , Smith, S. M. , Chou, S. P. , Saha, T. D. , Jung, J. , Zhang, H. , … Grant, B. F. (2016). The epidemiology of DSM-5 posttraumatic stress disorder in the USA: Results from the national epidemiologic survey on alcohol and related conditions-III. Social Psychiatry and Psychiatric Epidemiology , 51(8), 1137–1148.
- Grube, B. S. , Bilder, R. M., & Goldman, R. S. (1998). Meta-analysis of symptom factors in schizophrenia. Schizophrenia Research, 31(2–3), 113–120. doi:10.1016/S0920-9964(98)00011-5
- Karatzias, T. , Shevlin, M. , Fyvie, C. , Hyland, P. , Efthymiadou, E. , Wilson, D. , … Cloitre, M. (2017). Evidence of distinct profiles of Posttraumatic Stress Disorder (PTSD) and Complex Posttraumatic Stress Disorder (CPTSD) based on the new ICD-11 Trauma Questionnaire (ICD-TQ). Journal of Affective Disorders , 207, 181–187.
- Knefel, M. , Garvert, D. W. , Cloitre, M. , & Lueger-Schuster, B. (2015). Update to an evaluation of ICD-11 PTSD and complex PTSD criteria in a sample of adult survivors of childhood institutional abuse by Knefel & Lueger-Schuster (2013): A latent profile analysis. European Journal of Psychotraumatology , 6(1), 25290.
- Knefel, M. , & Lueger-Schuster, B. (2013). An evaluation of ICD-11 and complex PTSD criteria in a sample of adult survivors of childhood institutional abuse. European Journal of Psychotraumatology , 4(1), 22608.
- Lambert, M. J. , Burlingame, G. M. , Umphress, V. , Hansen, N. B. , Yancher, S. C. , Vermeersch, D. , & Clouse, G. C. (1996). The reliability and validity of a new psychotherapy outcome questionnaire. Clinical Psychology and Psychotherapy , 3(4), 249–258.
- Linzer, D. , & Lewis, J. (2011). poLCA: An R package for polytomous variable latent class analysis. Journal of Statistical Software , 42(10). doi:10.18637/jss.v042.i10
- Maercker, A. , Brewin, C. R. , Bryant, R. A. , Cloitre, M. , Reed, G. M. , van Ommeren, M. , … Saxena, S. (2013). Proposals for mental disorders specifically associated with stress in the International Classification of Diseases-11. The Lancet , 381(9878), 1683–1685.
- McLachlan, G. J. (1987). On bootstrapping the likelihood ratio test stastistic for the number of components in a normal mixture. Applied Statistics , 36(3), 318.
- Nickerson, A. , Cloitre, M., Bryant, R. A., Schnyder, U., Morina, N., & Schick, M. (2016). The factor structure of complex posttraumatic stress disorder in traumatized refugees. European Journal of Psychotraumatology, 7, 33253. doi:10.3402/ejpt.v7.33253
- Nylund, K. L. , Asparouhov, T. , & Muthén, B. O. (2007). Deciding on the number of classes in latent class analysis and growth mixture modeling: A Monte Carlo simulation study. Structural Equation Modeling: A Multidisciplinary Journal , 14(4), 535–569.
- Nylund-Gibson, K. , & Choi, A. Y. (2018). Ten frequently asked questions about latent class analysis. Translational Issues in Psychological Science , 4(4), 440–461.
- Oberski, D. L. (2016). Mixture models: Latent profile and latent class analysis. In J. Robertson & M. Kaptein (Eds.), Modern statistical methods for HCI (pp. 275–287). (Human–Computer Interaction Series). Springer International Publishing Switzerland.
- Perkonigg, A. , Höfler, M. , Cloitre, M. , Wittchen, H. , Trautmann, S. , & Maercker, A. (2016). Evidence for two different ICD-11 posttraumatic stress disorders in a community sample of adolescents and young adults. European Archives of Psychiatry and Clinical Neuroscience , 266(4), 317–328.
- Sachser, C. , Keller, F. , & Goldbeck, L. (2017). Complex PTSD as proposed for ICD-11: Validation of a new disorder in children and adolescents and their response to trauma-focused cognitive behavioral therapy. Journal of Child Psychology and Psychiatry and Allied Disciplines , 58(2), 160–168.
- Schwarz, G. (1978). Estimating the dimension of a model. The Annals of Statistics , 6(2), 461–464.
- Sclove, S. L. (1987). Application of model-selection criteria to some problems in multivariate analysis. Psychometrika , 52(3), 333–343.
- Scrucca, L. , Fop, M. , Murphy, T. B. , & Raftery, A. E. (2016). Mclust 5: Clustering, classification and density estimation using Gaussian finite mixture models. The R Journal , 8(1), 289–317.
- Tein, J.-Y. , Coxe, S. , & Cham, H. (2013). Statistical power to detect the correct number of classes in latent profile analysis. Structural Equation Modeling: A Multidisciplinary Journal , 20(4), 640–657.
- Weiss, D. S. , & Marmar, C. R. (1997). The impact of event scale—Revised. In J. P. Wilson , T. M. Keane , J. P. Wilson , & T. M. Keane (Eds.), Assessing psychological trauma and PTSD (pp. 399–411). New York, NY, USA: Guilford Press.
- Wolf, E. J. , Miller, M. W. , Kilpatrick, D. , Resnick, H. S. , Badour, C. L. , Marx, B. P. , … Friedman, M. J. (2015). ICD–11 complex PTSD in U.S. national and veteran samples: Prevalence and structural associations with PTSD. Clinical Psychological Science , 3(2), 215–229.