
ABSTRACT
Background: Despite the well-known deleterious health effects of childhood adversity (CA) and adulthood trauma (AT) and ageing of the global population, little is known about self-reported CA and AT in older populations. Existing findings are mixed due to methodological and sampling artefacts, in particular, recall and selection biases, and due to age-period-cohort effects.
Objectives: We aim to first, provide data on the prevalence of retrospective self-reported CA and AT in a large population-based sample of older adults and, second, to discuss the data in the context of major methodological and sampling artefacts, and age-period-cohort effects.
Method: Data are derived from the U.S. population-based Health and Retirement Study (N = 19,547, mean age = 67.24 ± 11.33, 59% female). Seven birth-cohorts were included (<1924, 1924–1930, 1931–1941, 1942–1947, 1948–1953, 1954–1959, >1959).
Results: Overall, 35% of participants reported CA and 62% AT, with strong variability among birth-cohorts. Opposing trends were observed regarding prevalence of CA and AT. As age of cohorts increased, prevalence of CAs decreased while that of ATs increased. Investigating the distributions of incidence of specific ATs across age and period per cohort revealed incidence of exposure was associated with (1) age (e.g. having lost a child), (2) time-period (e.g. major disaster), and (3) cohort (e.g. military combat).
Conclusions: Retrospective self-reported CA and AT in older samples should be interpreted with caution and with regard to major methodological challenges, including recall and selection biases. Untangling fact from artefact and examining age, period, and cohort effects will help elucidate profiles of lifetime exposures in older populations.
Antecedentes: A pesar de los ampliamente conocidos efectos nocivos de la adversidad en la infancia (AI) y el trauma en la adultez (TA) y el envejecimiento de la población global, se sabe poco respecto a AI y TA auto-reportados en poblaciones mayores. Los hallazgos existentes son heterogéneos debido a artefactos metodológicos y de muestreo, en particular sesgos de memoria y de selección, y debido a efectos de la edad, período y cohorte.
Objetivos: Apuntamos primero a entregar información sobre la prevalencia de AI y TA retrospectivos auto-reportados en una amplia muestra poblacional de adultos mayores y, segundo, discutir los datos en el contexto de los mayores artefactos metodológicos y de muestreo, y de los efectos de la edad, período y cohorte.
Método: Los datos provienen del Estudio de Población de Salud y Jubilación en EE.UU. (N=19,547, edad promedio = 67.24±11.33, 59% mujeres). Fueron incluidas siete cohortes de nacimiento (<1924, 1924-1930, 1931-1941, 1942-1947, 1948-1953, 1954-1959, >1959).
Resultados: En términos generales, 35% de los participantes reportó AI y un 62% TA, con una marcada variabilidad entre las cohortes. Se observaron tendencias opuestas en relación a la prevalencia de AI y TA. A medida que la edad de las cohortes aumentó, la prevalencia de AI disminuyó, mientras que la de TA aumentó. Al investigar las distribuciones de incidencia de AI específicos según edad y período por cohorte se reveló que la incidencia de exposición se asoció con (1) la edad (por ej. Perder un hijo), (2) período de tiempo (por ej. desastre grave), y (3) la cohorte (por ej. combate militar).
Conclusiones: AI y TA retrospectivos auto-reportados en muestras de adultos mayores deberían ser interpretados con precaución y en consideración de importantes dificultades metodológicas, incluyendo sesgo de memoria y de selección. Distinguir entre hecho y artefacto y examinar los efectos de edad, período y cohorte ayudará a elucidar los perfiles de exposición a lo largo de la vida en poblaciones mayores.
背景 : 尽管童年期逆境 (CA) 和成年期创伤 (AT) 对健康的有害影响以及全球人口老龄化众所周知, 但对于老年人群自评CA和AT知之甚少。由于方法学和抽样误差, 特别是回忆和选择偏差, 以及年龄-时期-队列的影响, 现有结果混杂。
目标 : 我们首先旨在提供大量老年人群样本回溯性自评CA和AT流行率的数据, 其次, 在主要方法学和抽样误差以及年龄-时期-队列效应的背景下讨论数据。
方法 : 数据来自美国人群的健康与退休研究 (样本量N = 19,547, 平均年龄= 67.24±11.33, 女性占59%) 。入组七个出生队列 (<1924, 1924-1930, 1931-1941, 1942-1947, 1948-1953, 1954-1959, > 1959) 。
结果 : 总体而言, 参与者中35%报告了CA, 62%报告了AT, 在出生队列之间有巨大差异。观察到关于CA和AT流行率的相反趋势。随着队列年龄增加, CA流行率下降而AT流行率上升。每个群体进行跨年龄, 跨时期针对特定AT发生率分布的考查, 发现暴露的发生率与 (1) 年龄 (例如丧子), (2) 时间段 (例如重大灾难) 和 (3) 队列 (例如军事战争) 相关。
结论 : 在老年样本中, 回溯性自评CA和AT应谨慎解释, 并应考虑主要的方法学挑战, 包括回忆和选择偏差。从表象中厘清事实并考查年龄, 时期和队列的影响, 将有助于阐明老年人群终身暴露情况。
1. Introduction
Childhood adversity (CA) and adulthood trauma (AT) are common in the general population and are known to have deleterious effects on health across the lifespan and into late life (Anda et al., Citation2006; Dube et al., Citation2001; Dube, Felitti, Dong, Giles, & Anda, Citation2003; Felitti et al., Citation1998; Glaesmer, Brähler, Gündel, & Riedel-Heller, Citation2011; Green et al., Citation2010; Kessler et al., Citation2009; Kessler, Alonso, Benjet, Bromet, & Cardoso et al., Citation2017). Due to major demographic shifts in the last century, the ratio of people over, compared to under, age 65 increased dramatically, especially in western societies (Bongaarts, Citation2009). Despite the widely reported serious negative health impact of CA and AT and the ageing of the world’s population, little is known about prevalence and incidence of self-reported CA and AT in older populations. Moreover, methodological challenges in the measurement of CA and AT may have led to inconsistent findings across the studies that have examined this issue. Therefore, the aim of the current study is to present data on the prevalence of CA and AT from a large, population-based study of older adults from the US, and to discuss them in the context of methodological artefacts that may influence the data.
Population-based studies of CA and AT show varying prevalence and incidence rates due to differences in conceptualization and assessment of these experiences. The prevalence of CA has been found to be high, with 40-70% of children and adolescents being exposed to some kind of adversity, and multiple adversities are more common than singular (Copeland, Keeler, Angold, & Costello, Citation2007; Green et al., Citation2010; Hussey, Chang, & Kotch, Citation2006; Kessler et al., Citation2010). The prevalence of lifetime trauma is also high with 60-90% of the general population being exposed to traumatic experiences, of which about a third experience four or more events (Benjet et al., Citation2016; Kilpatrick et al., Citation2013; Norris, Citation1992; Ogle, Rubin, Berntsen, & Siegler, Citation2013). CA and AT have been found to increase risk for a broad range of psychiatric disorders across the life-course (Carr, Martins, Stingel, Lemgruber, & Juruena, Citation2013; Green et al., Citation2010; Kessler et al., Citation2010; McLaughlin, Conron, Koenen, & Gilman, Citation2010). Moreover, CA and AT increase risk for major medical illnesses and premature mortality (Brown et al., Citation2009; Clemens et al., Citation2018; Dube et al., Citation2003; Felitti et al., Citation1998; Glaesmer et al., Citation2011; O’Donovan et al., Citation2015; Riedl et al., Citation2019). Thus, CA and AT are highly prevalent risk factors for ill health.
In contrast with the reasonable assumption that people accumulate more traumatic experiences as they age, a review of more than 30 studies found a trend across samples of decreasing self-reported traumatic life events and stressful life events with age (Hatch & Dohrenwend, Citation2007). Population-based data from 68,894 participants assessed in 24 countries in the World Mental Health Survey indicated that younger cohorts (age<65) had lower odds of self-reported exposure to collective violence, but higher odds for self-reported exposure to interpersonal violence, sexual violence, accident/injuries, unexpected death of a loved one, or being mugged (Benjet et al., Citation2016). However, other studies support this assumption and have found increasing lifetime prevalence rates with age. Data from 10,641 participants in the Australian National Survey of Mental Health showed a linear increase of self-reported trauma exposure with age only in the men and an inverted U-shaped distribution in women due to combat-related exposures in men only (Creamer & Parslow, Citation2008). A population-based study of 2,510 participants in Germany also found older cohorts (both males and females) to have greater exposure to self-reported trauma (Hauffa et al., Citation2011). Others observed varying prevalence rates across various age ranges for self-reported specific traumatic events rather than for overall trauma scores (Krause, Shaw, & Cairney, Citation2004). In regard to age distribution of specific events, it has been shown that some events (e.g. sexual assaults) occurred more often at younger ages, whereas other events (e.g. unexpected death of a loved one) were more frequent after the transition to adulthood (Ogle et al., Citation2013; Ogle, Rubin, & Siegler, Citation2013). Taken together, these studies suggest high but varying prevalence of CA and AT across samples. Contrasting data exists to support either increasing or decreasing prevalence rates with age, depending on the specific events assessed, characteristics of the sample, and the location.
While major differences in prevalence of CA and AT may be due to differences in measurement and study samples, studies also contain some specific methodological and sampling artefacts. For example, recall biases due to prolonged periods of recall or cognitive decline, and selection biases due to selective mortality and institutionalization may both lead to an underreporting of exposures (Arrighi & Hertz-Picciotto, Citation1994; Brown et al., Citation2017; Buckley, Keil, McGrath, & Edwards, Citation2015; Hardt & Rutter, Citation2004). Furthermore, cohort differences might be apparent due to effects of age, time-period, or an interaction between these effects. Age effects are variations due to changes across the life course that are internal to individuals (Keyes & Li, Citation2012; Yang & Land, Citation2013). Age-specific stages in life exist at which individuals are at highest risk for a specific incident; therefore, pure age effects should be consistent across cohorts (e.g. miscarriage, having a spouse with dementia). Period effects emerge related to changes over time in certain events or social and epidemiologic circumstances (e.g. the AIDS epidemic) (Keyes & Li, Citation2012; Yang & Land, Citation2013). Age x period interactions are period effects that vary with age-related vulnerabilities (e.g. military combat during war times occurring in young adulthood). Cohort effects are differences among individuals defined by shared temporal experiences (e.g. the baby boom generation’s increase in suicide and depression risk)(Keyes & Li, Citation2012). In the epidemiological literature, the age-period-cohort identification problem describes the problem that relates from the perfect collinearity between these variables in some cases and therefore the difficulty of separating these effects (Bell & Jones, Citation2013; Yang & Land, Citation2013).
Despite the large prevalence of CA and AT, the well-known risk to population health caused by CA and AT, and the rapid ageing of the worlds’ population, we know relatively little about the prevalence of childhood adversity and trauma in older individuals. Existing findings are mixed due to differences in assessments, methodological artefacts, and due to the collinearity of age-period-cohort effects. Therefore, the aim of the current study is to provide data on the prevalence of CA and AT from a sample of older adults in the U.S. population-based Health and Retirement Study (HRS). Further, we will examine differences in exposure by exploring the distributions of the incidence of AT across age and time-period and discuss observed findings in the context of major methodological and sampling artefacts inherent to older populations in an attempt to separate real cohort effects from methodological artefacts.
2. Methods
2.1. Participants
Participants were drawn from HRS, a U.S. population-based longitudinal study of more than 43,000 Americans over the age of 50 and their spouses (spouses can be younger than 50) (Fisher & Ryan, Citation2018). The original study population, the HRS cohort, was sampled in 1992 and included all adults in the USA born during the years 1931–1941 who resided in households, with a 2:1 oversample of African American and Hispanic populations and a slight oversampling of Florida state residents. The HRS sample is based on a ‘multi-stage area probability design involving geographical stratification and clustering and oversampling of certain demographic groups’ (Sonnega et al., Citation2014, p. 577). Later, a second study, called ‘Asset and Health Dynamics Among the Oldest Old’ (AHEAD), was conducted to capture the cohort born between 1890 and 1923. These two studies were then merged with two new cohorts the ‘Children of the Depression’ (CODA, 1924–30), and the ‘War Babies’ (1942–47) building up the total HRS sample. HRS now undertakes a steady-state design, refreshing the overall sample every 6 years with younger birth cohorts not previously represented in the sample. Early Baby Boomers (1948–53) were added in 2004, and Mid Baby Boomers (1954–59) were included in 2010 (Sonnega et al., Citation2014). Spouses of these cohorts, can either be part of a specific birth cohort, or might have been born after 1954 (n = 777) (Fisher & Ryan, Citation2018; Sonnega et al., Citation2014). HRS is sponsored by the National Institute on Ageing (grant number NIA U01AG009740) and is conducted by the University of Michigan. Starting in 2006, the study implemented a psychosocial questionnaire that included assessments of CA and AT (Clarke, Fisher, House, Smith, & Weir, Citation2008; Smith, Ryan, Sonnega, & Weir, Citation2017).
2.2. Procedure
After the phone-interview section of HRS took place, participants were given a leave-behind questionnaire assessing psychosocial domains (Clarke et al., Citation2008; Smith et al., Citation2017). Response rates for these questionnaires were high over the waves and varied between 73-88% (Smith et al., Citation2017). Prior to each interview, participants were provided with written study information, all respondents were read a confidentiality statement, and they gave their oral consent by agreeing to do the interview. Ethical approval for the HRS Study was granted from the University of Michigan Institutional Review Board, and the study has been conducted according to the principles of the Declaration of Helsinki.
For the analyses in the current paper, data were combined from the assessments of 2008 and 2010 (Health and Retirement Study, Citation2008 HRS Core (Final) (v.3.0) public use dataset); Health and Retirement Study (Citation2010) HRS Core (Final) (v.5.1) public use dataset. If participants did not take part in these waves or did not fill out the questionnaires, data from the 2006 wave (Health and Retirement Study, Citation2006 HRS Core (Final) (v.3.0) public use dataset) were used for missing values of the 2010 wave, and from the 2012 assessments (Health and Retirement Study, Citation2012 HRS Core (Final) (v.2.0) public use dataset) for missing values of the 2008 wave. We selected participants from the original sample who had completed all items for either CA or AT. A total of 19,547 participants met these inclusion criteria; 9.52% of participants were included from 2006, 35.58% from the year 2008, 41.85% from the year 2010, and 13.05% from 2012 assessments. Number of participants included from each cohort varied (n per cohort: AHEAD = 1,369; CODA = 2,171; HRS = 6,181; War-Babies = 2,570; Early-Baby-Boomers = 3,440; Mid-Baby-Boomers = 3,039; Later-Birth-Years = 777).
2.3. Measures
2.3.1. Childhood adversities
CAs were evaluated between 2006 and 2012 using all items from the measure developed by Krause et al. (Citation2004). Respondents were presented with four potentially adverse exposures and asked whether they experienced each one before the age of 18. These exposures included: repeating a school year, having trouble with the police (item added in 2008), having parents who drank alcohol or used drugs so often that it caused problems in the family, and physical abuse by a parent (Clarke et al., Citation2008; Smith et al., Citation2017).
2.3.2. Adulthood trauma
ATs were assessed using all items from the questionnaire developed by Krause et al. (Citation2004). Participants were presented seven potentially traumatic experiences and were asked if they experienced each one at any point in their life. Participants that were exposed were supposed to indicate the year of most recent incidence. Experiences that were reported before the age of 18 were excluded from the adulthood trauma scores. AT included: having lost a child; experiencing a major fire, flood, earthquake or natural disaster; firing a weapon in combat or been fired upon in combat; having a spouse, partner, or child addicted to drugs or alcohol; being a victim of a serious physical attack or assault; having or having had a life-threatening illness or accident; having a spouse or child that experienced a life-threatening illness or accident (Clarke et al., Citation2008; Smith et al., Citation2017).
2.3.3. Sociodemographic variables
All other variables were derived from the RAND HRS Detailed Imputations File 2014 (V2). These files were developed at RAND with funding from the National Institute on Ageing and the Social Security Administration. The following variables were retrieved from this file for analyses in the current paper: Age (year of trauma assessment – year of birth), gender (male/female), race/ethnicity (Caucasian [non-Hispanic], African American [non-Hispanic], Hispanic, Other [non-Hispanic]) and parental education (<8 years vs. ≥8 years of education; if data regarding the education of the father was missing, data from maternal education was used instead).
2.4. Analytic plan
Sample demographics are reported, followed by total scores for CA and AT, and an overall combined score. Prevalence rates of specific CAs and ATs are reported as percentages of total and cohort-specific participants exposed. Distributions of incidences of most recent ATs by age of participants are displayed by plotting the ratio of number of participants exposed per age divided by the total number of participants exposed to the respective AT (). Due to the decreasing sample size among older ages, we upweighted exposures in older ages in . Upweighting was achieved by multiplying the ratio (exposure per age/number exposed) by the invert of the proportion of the remaining sample at a specific age (e.g. if 10% of the sample reached the age of 80, each exposure at this age was upweighted by the factor 10, or if 20% of the sample reached the age of 70, each exposure at this age was upweighted by the factor 5). We plotted the distribution of the ages of incidence to ATs to the point at which 10% of the sample was left, limiting the largest adjusting weight to factor 10. Furthermore, in the distributions of incidences to ATs over time-period per cohort are displayed until 2006. This plot was created using the ‘densityplot’- function from the lattice-package (Sarkar, Sarkar, & KernSmooth, Citation2018), the selected bandwidth of the kernel function was 1. The statistical software used was R (Version 3.5.2, Citation2018), Boston, MA, USA. Missing data was deleted listwise (R Core Team, Citation2013).
3. Results
3.1. Sociodemographic
In total, 19,547 participants were included in the analyses. Participants mean age was 67.24 years (SD 11.33) with an age range from 25 to 105 (96% >50 years). More than half of the participants were female (59%). Over two thirds of participants were non-Hispanic Caucasian (71%), 16% were non-Hispanic African American, 11% were Hispanic, and 3% reported ‘Other’ as race/ethnicity. One-fifth of the participants reported their parents had less than 8 years of school (20%).
3.2. Childhood adversity and adulthood trauma across cohorts
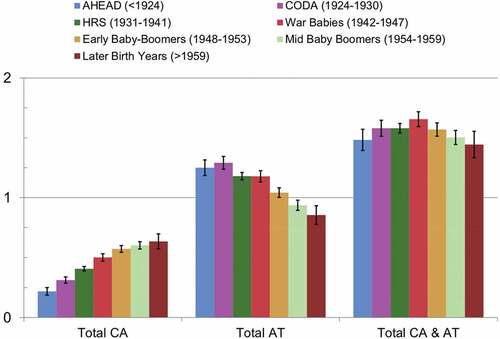
Overall, 35% of the sample reported having experienced at least one CA. Looking at cohort-specific rates, we observed a difference between cohorts with the youngest cohort having the highest rate (43%) and the oldest cohort having the lowest rate (18%). Similar trends were found when investigating cumulative scores: older cohorts reported fewer CAs compared to younger cohorts (see ). The opposite trend was observed for AT. In the full sample, 62% reported exposure to at least one AT. The highest rates were found for the oldest two cohorts with almost 70% reporting an exposure, compared to slightly over 50% in the youngest cohort. The same trend was found for the cumulative ATs with more exposure in older cohorts (see and ). Combining both CAs and ATs into an overall cumulative stressor score levelled these contrary trends, resulting in almost similar levels of overall stressor exposure across the cohorts.
Table 1. Prevalence of childhood adversities and adulthood trauma across birth-cohorts
Figure 1. Means of total self-reported CA, AT and CA&AT scores by birth-cohort. Error bars indicate 95% confidence intervals
3.3. Prevalence of specific childhood adversities across cohorts
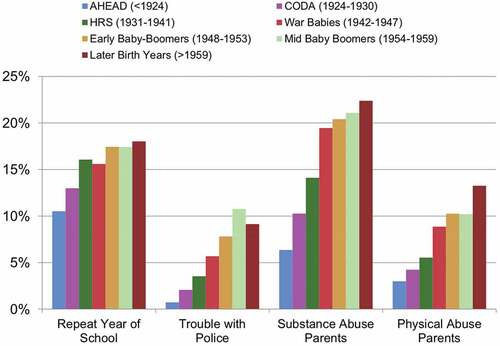
Prevalence rates of CAs across cohorts differed greatly, with linear trends towards higher rates among younger cohorts for all four CAs investigated (see and ). The largest difference between oldest and youngest cohorts was observed for substance abuse of parents, the second largest for parental physical abuse, the third largest for trouble with the police, and the smallest for repeating a year of school.
Figure 2. Self-reported prevalence rates in per cent of per CA across birth-cohorts
3.4. Prevalence and incidence of specific adulthood trauma
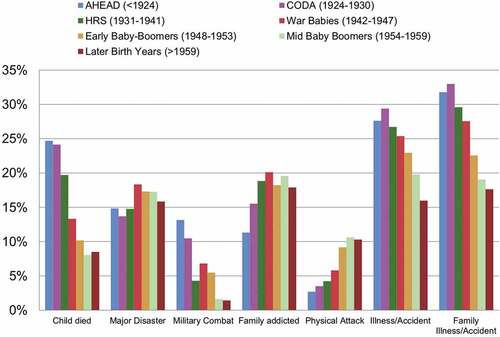
Prevalence rates of ATs differed largely among cohorts ( and ). Some exposures were found to be more prevalent in older cohorts, namely losing a child, having had an illness/accident, and having a spouse, partner or child have an illness/accident. Being exposed to a major disaster was equally prevalent in all cohorts. Military combat had a distinct pattern with the youngest cohort showing smaller prevalence rates compared to older cohorts. Having a family member with substance abuse problems was less prevalent in the oldest two cohorts and equally prevalent in the other cohorts. The prevalence for physical attack was higher in younger cohorts than in older cohorts (specific prevalence for ATs across cohorts is displayed in ).
Figure 3. Self-reported prevalence rates in per cent per AT across birth-cohorts. Family relates to spouse, partner, or children
If participants reported an AT, they were asked to indicate the exact year of the most recent exposure. Response rates for the exact year varied between 73-92%. The highest response rate was observed for loss of a child and the lowest for substance abusing family members (Child died: 91%, Major Disaster: 85%, Military Combat: 79%, Family addicted: 74%, Physical Attack: 78%, Illness/Accident: 87%, Family Illness/Accident: 86%). Participants that did not indicate an exact year of most recent exposure were excluded from further analyses.
Overall, the oldest two cohorts had slightly decreased response rates for the indication of the exact year compared to younger cohorts (AHEAD: 77%; CODA: 81%; HRS: 83%; War-Babies: 87%; Early-Baby-Boomers: 86%; Mid-Baby-Boomers: 84%; Later-Birth-Years: 85%). Distributions of age at incidence of most recent exposures to AT are shown in . The distributions of AT incidences showed distinct patterns. Incidence of losing a child peaked in young adulthood, followed by a decline in mid-life and an increase towards old age. The incidence of experiencing a major disaster was equally distributed across ages. Military combat peaked in young adulthood. Incidence of substance abuse of a spouse, partner, or child increased until the age of 40, after which it stayed stable for the rest of the lifetime. Incidence of physical attacks peaked in young adulthood followed by a decline over the life-course. Incidence of having an illness/accident, and having a family member with illness/accident, increased steadily over the life-course (see ).
Figure 4. Distribution of age at incidence of most recent AT. Ratio of number of exposures per age and total number exposed. Plot is smoothened to account for variations between years to see overall trends
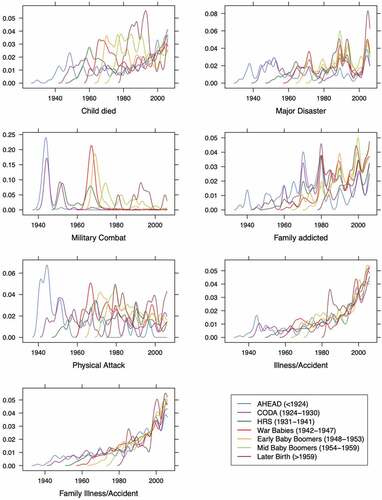
Density plots for the distribution of the year of incidence of ATs for each birth cohort are displayed in . These plots combine the perspective of age at incidence of most recent AT for each cohort across time-periods and allow certain observed age-specific effects to be seen for different cohorts across time-periods. For example, the incidence of losing a child peaked in young adulthood and in old age for all cohorts; however, the older the cohorts, the smaller the peak in young adulthood. Major Disasters, however, peaked across all birth cohorts in the same specific years (e.g. in 2005, with Hurricane Katrina). For military combat, certain cohorts show specific incidence patterns that are likely specific to the US. The AHEAD and CODA cohort likely fought in WWII (1944–1945); the CODA and HRS cohorts likely fought in the Korean War (1950–1953); and the HRS, War Babies and Early Baby Boomer cohorts likely fought in the Vietnam War (1965–1973), explaining the three major peaks. Incidence of spouse, partner or child with substance abuse increases over the life-course for all cohorts. Most cohorts tend to have peaks at the start of each decade starting in 1970. For incidence of severe physical attacks, all the cohorts show the same age-dependent curve that peaks in young adulthood and declines over the rest of the life. For the AHEAD cohort, the physical attack incidence curve mirrors the cohorts’ combat-exposure curve, suggesting the incidence of physical attack may be due to war-related aggression. The incidence of personal illness or accidents peaks for all cohorts in old age with an additional smaller peak in young adulthood, and incidence of family member illness or accident displays almost the same pattern.
Figure 5. Distribution of year of incidence of AT per birth-cohort. Lines are kernel density distributions with bandwidth=1 for each AT per cohort, created with ‘densityplot’ from the lattice package
4. Discussion
In this large population-based study of 19,547 older adults, we found that 35% of participants reported exposure to at least one CA and 62% reported exposure to at least one AT. Lifetime prevalence rates varied strongly among cohorts; in regard to CA, an overall trend of decreasing lifetime prevalence rates across age cohorts was found. In contrast, prevalence of AT increased with the age of cohorts. In the case of specific CAs, the largest differences in prevalence between earliest and latest birth-cohort were observed for substance abuse of parents followed by physical abuse of parents. For specific ATs, it would be reasonable to predict higher rates in older cohorts due to their longer duration of risk for exposure. However, findings did not support this assumption. Some ATs are more prevalent in older cohorts than expected, such as loss of a child, illness/accident, and family illness/accident. Others are almost equally distributed across cohorts, such as exposure to a major disaster. Furthermore, some ATs were even more prevalent in younger cohorts (e.g. having a family member with substance abuse, and serious physical attacks). Finally, military combat shows a distinct pattern related to major wars during certain periods. Overall, these data indicate that reports of CA tend to decrease, and reports of AT tend to increase with cohort age, with variation in the patterns for specific CAs and ATs.
The overall observed prevalence rates are in line with previous research; however, findings are at the lower boundary of what other studies have found regarding prevalence of both CA (Copeland et al., Citation2007; Green et al., Citation2010; Hussey et al., Citation2006; Kessler et al., Citation2010) and AT (Benjet et al., Citation2016; Kilpatrick et al., Citation2013; Norris, Citation1992; Ogle et al., Citation2013). Possible explanations include the rather narrow conceptualization and operationalization of CA and AT, as well as the methodological and sampling artefacts inherent in studies of older populations. With regard to overall trends in prevalence across age or cohorts, other studies found evidence of both decreasing (Benjet et al., Citation2016; Hatch & Dohrenwend, Citation2007) and increasing prevalence with age (Creamer & Parslow, Citation2008; Glaesmer et al., Citation2011; Hauffa et al., Citation2011). In our study, we observed both major trends of decreasing and increasing prevalence rates of earlier and later cohorts depending on the stressor. Decreasing prevalence with age of cohorts was observed for CA but increasing prevalence with age of the cohorts for AT. Combining CA and AT scores levelled these opposing trends.
Several different explanations could underlie our observed results. First, observed cohort differences in prevalence rates might be explained by real cohort differences in occurrences of CAs or ATs. In the case of ATs, differences might also be due to the separate or combined influence of age and time-period on incidence of an AT, which leads to observed cohort differences in prevalence. Influence of age, for example, can be seen for loss of a child and personal illness/accident, which both have very specific distributions of incidence. As the incidence of these events is much more likely to have occurred by older ages, early birth cohorts are less likely to have already experienced such an exposure. Effects of period might influence a cohorts’ prevalence, as some events could have happened before the birth of some participants. Furthermore, an interaction between age and period effects might explain the incidence of military combat, which likely occurred only in those who were young enough to deploy to combat at the time of major conflicts. These data highlight the importance of accounting for age and period in stress research, even in samples with a restricted age range, such as our sample of mostly older individuals.
Second, differences in reported prevalence might be a result of cohort effects in the perception and willingness to report certain events. While debating possible cohort effects in the prevalence of depression in the 1980s, Klerman et al. (Citation1985) argued that people in different cohorts, attribute different meaning and display different attitudes towards certain phenomena, and therefore might label and remember them differently. Older people for instance were shown to be less likely to report emotional problems such as depression compared to younger individuals (Hasin & Link, Citation1988). For example, some cohorts might be less likely to reveal certain events due to shame, fear of prejudice, or social desirability. Retrospective accounts of previous events might also be desirable reconstructions and narratives that are more consistent with current behaviour, as has been discussed in relation to family violence (Widom, Citation1989). Thus, beyond cohort effects in occurrence, our findings may in part be a result of cohort effects in perception and reporting.
Third, methodological and selection artefacts might contribute to the observed differences in prevalence between cohorts. We expect recall bias to lead to an overall underreporting of exposures (Hardt & Rutter, Citation2004). This effect might be strongest for CAs and ATs with incidence in early adulthood (e.g. physical attack), due to prolonged recall periods. Additionally, age-related cognitive decline may lead to a recall bias of even larger magnitude in the older cohorts. This argument is supported by the observation that older cohorts overall were less likely to indicate the exact year of exposure to AT (response rate oldest cohort: 77%, and youngest cohort: 85%). Selection bias, in particular, selective mortality and institutionalization or healthy survivor effects, may in part explain the low prevalence of CA and AT, especially in older cohorts (Heiss, Citation2011; Zajacova & Burgard, Citation2013). In occupational cohorts, it has been shown that individuals who remain in a cohort tend to be healthier than those who drop out, which is known to decrease estimates of the adverse effect of an exposure (Arrighi & Hertz-Picciotto, Citation1994; Picciotto & Hertz-Picciotto, Citation2015). CA has previously been reported to be associated with morbidity and premature mortality (Brown et al., Citation2009; Clemens et al., Citation2018; Felitti et al., Citation1998; Riedl et al., Citation2019). In particular, the accumulation of adversities and inequalities ‘may lead to premature mortality; therefore, nonrandom selection may give the appearance of decreasing inequality in later life’ (Ferraro & Shippee, Citation2009, p. 336). Our data are consistent with the idea that self-report of stressors across the lifespan might underestimate the actual prevalence of stressors in older cohorts due to recall biases and loss of participants with high levels of past stressor exposure due to morbidity and mortality.
In the case of CAs investigated, we observed an overall trend of lower prevalence in older cohorts. As discussed, these effects might be related to methodological artefacts associated with long recall periods, cognitive decline, and selective attrition due to morbidity and mortality. Nonetheless, the magnitude of cohort differences varied greatly among specific CAs with the largest differences for substance abuse by parents. A review conducted by Keyes, Li, and Hasin (Citation2011) showed that younger birth cohorts, especially those born after WWII, were more likely to engage in more risky drinking behaviours. A large US population-based survey also showed alcohol use and dependence to be more common in birth-cohorts born after Prohibition (1933) and after World War II (1945) (Grant, Citation1997). This is in line with our findings of largely increasing prevalence rates for ‘parental substance abuse in childhood’ and ‘having a family member with substance abuse in adulthood’ especially for the HRS (1931–1941) and the War Babies (1942–1947), compared to the earlier cohorts. In the case of parental physical abuse, our findings are consistent with previous research that also found lower rates of retrospectively reported physical abuse in older participants (Draper et al., Citation2008; Dube et al., Citation2003; Logan-Greene, Green, Nurius, & Longhi, Citation2014). Beyond recall and selection biases, three major trends in the US might explain these findings. First, corporal punishment was long viewed as the norm and therefore not as abuse. In 1968, 94% of parents physically punished their children, this rate declined to 68% in 1994 (Straus & Mathur, Citation1996), and further to 37% in 2014 (Finkelhor, Turner, Wormuth, Vanderminden, & Hamby, Citation2019). Second, efforts around child protection and awareness of abuse grew greatly around the 1960s (Myers, Citation2008). Third, U.S. Department of Health and Human Services (Citation1999) found that between one-third and two-thirds of child maltreatment cases were affected in some way by substance use. This is in line with our finding of about half of the cases with parental physical abuse also reporting parental substance abuse. The decline in corporal punishment alongside the change in awareness of physical abuse might have led to cohort differences in the perception, the willingness to report, and labelling of early life physical punishment. Combined with an increase in parental substance abuse and methodological and sampling artefacts, this might explain the higher rates of self-reported parental physical abuse in younger cohorts.
In the case of the specific ATs investigated, differences in prevalence of having lost a child are largely due to the difference in age of incidence of such an experience, which peaks in young adulthood and towards old age. Furthermore, fertility rates strongly declined from the 1960s onwards (Guyer, Freedman, Strobino, & Sondik, Citation2000), child mortality rates dropped (Behrman & Field, Citation2003), and overall life expectancy grew (Guyer et al., Citation2000), all explaining the lower prevalence in younger birth cohorts. Regarding major disasters, we assume the findings of rather stable prevalence across cohorts to be related to two factors. First, recall bias may reduce reports of early experiences of natural disaster in older cohorts, and second, data exists showing an actual increase in natural disasters in the second half of the last century worldwide (Emergency Events Database, Citation2019). Cohort differences for combat-related exposures are mainly explained by age-period interactions in incidence, in that young adults in specific periods (major wars) volunteered or were drafted into war regions for limited time periods in young adulthood (see , military combat). After conscription ended in 1973 and the military moved to an all-volunteer army, military personnel nowadays often do multiple tours in different war zones. Overall about 40% military service members were deployed multiple times into recent conflict zones, suggesting the age of incidence for most recent military traumatic exposures may be increasing (Institute of Medicine of the National Academies, Citation2010).
5. Limitations
Beyond the strengths of having a large population-based sample of older individuals that fell into several distinct cohorts and reported on both CA and AT, our findings need to be considered in light of some important limitations. First and foremost, compared to the broad concepts of trauma and stress, the implemented questionnaire with eleven items (four in childhood and seven in adulthood) is a rather narrow assessment of mostly event-based measures of potentially adverse and traumatic exposures. Additionally, the indication of the exact year of exposure for AT focused only on the most recent incidence. Furthermore, the items asking for substance abuse of parents in childhood and family members in adulthood focus on prolonged stressors, which makes it hard to indicate the exact year of exposure, leading to artefacts in the data (peaks occurred around full decades: 1970, 1980, 1990, 2000). Second, and related to the first limitation, assessments of CA and AT are based on retrospective self-reports and therefore subject to numerous problems, such as prolonged recall periods, cognitive decline, false memory, and bias due to mood state and symptomatology, that have been extensively discussed in previous literature (Baldwin, Reuben, Newbury, & Danese, Citation2019; Hardt & Rutter, Citation2004; Maughan & Rutter, Citation1997; Reuben et al., Citation2016; Sheikh, Citation2018). A recent meta-analysis reported a poor overlap between prospective and retrospective measures of childhood maltreatment (Baldwin et al., Citation2019). However, they found greater agreement for more clear-cut forms of adversity, meaning that most of the exposures in our study – the major traumas – might still have a high level of agreement over time (Baldwin et al., Citation2019). Third, the sample is U.S. population-based; therefore, some findings and patterns might only be representative for the U.S. (e.g. military combat) and others only for certain areas (e.g. Hurricanes in south-eastern states). Additionally, upon study enrolment, participants had to be fully registered household residents, which might lead to an underestimation of prevalence rates due to exclusion of people with temporary or no housing. Lastly, as the HRS study only recruited adults over 50 and their spouses, less than 4% of the total sample are younger than age 50. Having additional younger birth cohorts would increase generalizability of findings.
6. Implications
The present data highlight the high prevalence of lifespan trauma exposure in older samples. However, there are stark differences in lifetime prevalence based on age, period, and cohort effects. Thus, studies of self-reported CA and AT in older samples have to be interpreted in the light of methodological limitations highlighted in our study. Methods from sociology and epidemiology will be useful in making sense of self-reported stressor exposure data. For example, new models, methods and empirical applications from age-period-cohort (APC) analysis might be fruitful to apply in lifespan stress and trauma research (Keyes & Li, Citation2012; Yang & Land, Citation2013). Our work here adds to a growing literature that highlights problems with some stress measurement techniques (Epel et al., Citation2018; Kagan, Citation2016; Slavich, Citation2019). In future studies, a combination of prospective and retrospective, as well as self- and observer-rated measures might help to reduce recall biases. Using more sophisticated stress and trauma measurement questionnaires (Slavich & Shields, Citation2018; Teicher & Parigger, Citation2015), conducting interviews with trained raters and employing memory enhancement techniques might be of interest for future research. A better understanding of the timing and distribution of stressors, and differences among age, period, and cohort effects in the population will allow us to target interventions that aim to reduce the negative impact of stressors to those most likely to benefit. As little is known about CA and AT in older populations, further research is warranted to tackle these important issues.
7. Conclusion
Conflicting findings on the prevalence of CA and AT in older populations might be due to both facts, because the specific age and period of a sample will influence results, and artefacts, because there are several potential methodological issues that might cause biases in the data. Data on retrospective self-reported exposure to CA and AT in older samples should be interpreted with caution and with regard to their major methodological challenges. Recall biases might lead to underreporting of events and in this way conceal real cohort effects. Selection biases due to selective mortality of the most highly exposed individuals likely lead to underestimates of overall prevalence in the oldest-old. Untangling fact from artefact and differentiating among age-period-cohort effects will help distinguish more accurate profiles of lifetime stressor exposures in older populations.
Disclosure statement
No potential conflict of interest was reported by the authors.
Data availability
The Health and Retirement Study was conducted by the University of Michigan. All data analyzed in this study is openly available. Data is accessible at https://hrspubs.sites.uofmhosting.net.
Additional information
Funding
References
- Anda, R. F., Felitti, V. J., Bremner, J. D., Walker, J. D., Whitfield, C., Perry, B. D., ..., Giles, W. H. (2006). The enduring effects of abuse and related adverse experiences in childhood. A convergence of evidence from neurobiology and epidemiology. European Archives of Psychiatry and Clinical Neuroscience, 256(3), 174–14.
- Arrighi, H. M., & Hertz-Picciotto, I. (1994). The evolving concept of the healthy worker survivor effect. Epidemiology, 5(2), 189–196.
- Baldwin, J. R., Reuben, A., Newbury, J. B., & Danese, A. (2019). Agreement between prospective and retrospective measures of childhood maltreatment: A systematic review and meta-analysis. JAMA Psychiatry (Chicago, Ill.), 76(6), 584–593.
- Behrman, R. E., & Field, M. J. (2003). When children die: Improving palliative and end-of-life care for children and their families. Washington, DC, USA: National Academies Press.
- Bell, A., & Jones, K. (2013). The impossibility of separating age, period and cohort effects. Social Science & Medicine, 93, 163–165.
- Benjet, C., Bromet, E., Karam, E. G., Kessler, R. C., McLaughlin, K. A., Ruscio, A. M., ..., Koenen, K. C. (2016). The epidemiology of traumatic event exposure worldwide: Results from the World Mental Health Survey Consortium. Psychological Medicine, 46(2), 327–343.
- Bongaarts, J. (2009). Human population growth and the demographic transition. Philosophical Transactions of the Royal Society B: Biological Sciences, 364(1532), 2985–2990.
- Brown, D. W., Anda, R. F., Tiemeier, H., Felitti, V. J., Edwards, V. J., Croft, J. B., & Giles, W. H. (2009). Adverse childhood experiences and the risk of premature mortality. American Journal of Preventive Medicine, 37(5), 389–396.
- Brown, D. M., Picciotto, S., Costello, S., Neophytou, A. M., Izano, M. A., Ferguson, J. M., & Eisen, E. A. (2017). The healthy worker survivor effect: Target parameters and target populations. Current Environmental Health Reports, 4(3), 364–372.
- Buckley, J. P., Keil, A. P., McGrath, L. J., & Edwards, J. K. (2015). Evolving methods for inference in the presence of healthy worker survivor bias. Epidemiology, 26(2), 204–212.
- Carr, C. P., Martins, C. M. S., Stingel, A. M., Lemgruber, V. B., & Juruena, M. F. (2013). The role of early life stress in adult psychiatric disorders: A systematic review according to childhood trauma subtypes. The Journal of Nervous and Mental Disease, 201(12), 1007–1020.
- Clarke, P., Fisher, G., House, J., Smith, J., & Weir, D. (2008). Guide to content of the HRS psychosocial leave-behind participant lifestyle questionnaires: 2004 & 2006. Ann Arbor, MI: University of Michigan.
- Clemens, V., Huber-Lang, M., Plener, P. L., Brahler, E., Brown, R. C., & Fegert, J. M. (2018). Association of child maltreatment subtypes and long-term physical health in a German representative sample. European Journal of Psychotraumatology, 9(1), 1510278.
- Copeland, W. E., Keeler, G., Angold, A., & Costello, E. J. (2007). Traumatic events and posttraumatic stress in childhood. Archives of General Psychiatry, 64(5), 577–584.
- Creamer, M., & Parslow, R. (2008). Trauma exposure and posttraumatic stress disorder in the elderly: A community prevalence study. The American Journal of Geriatric Psychiatry : Official Journal of the American Association for Geriatric Psychiatry, 16(10), 853–856.
- Draper, B., Pfaff, J. J., Pirkis, J., Snowdon, J., Lautenschlager, N. T., Wilson, I., ..., Depression, & Early Prevention of Suicide in General Practice Study Group. (2008). Long‐term effects of childhood abuse on the quality of life and health of older people: Results from the depression and early prevention of suicide in general practice project. Journal of the American Geriatrics Society, 56(2), 262–271.
- Dube, S. R., Anda, R. F., Felitti, V. J., Chapman, D. P., Williamson, D. F., & Giles, W. H. (2001). Childhood abuse, household dysfunction, and the risk of attempted suicide throughout the life span: Findings from the adverse childhood experiences study. JAMA, 286(24), 3089–3096.
- Dube, S. R., Felitti, V. J., Dong, M., Giles, W. H., & Anda, R. F. (2003). The impact of adverse childhood experiences on health problems: Evidence from four birth cohorts dating back to 1900. Preventive Medicine, 37(3), 268–277.
- Emergency Events Database. (2019). OFDA/CRED international disaster database. U. C. D. Louvain (Ed.). Belgium: Brussels.
- Epel, E. S., Crosswell, A. D., Mayer, S. E., Prather, A. A., Slavich, G. M., Puterman, E., & Mendes, W. B. (2018). More than a feeling: A unified view of stress measurement for population science. Frontiers in Neuroendocrinology, 48, 146–169.
- Felitti, V. J., Anda, R. F., Nordenberg, D., Williamson, D. F., Spitz, A. M., Edwards, V., Koss, M. P., & Marks, J. S. (1998). Relationship of childhood abuse and household dysfunction to many of the leading causes of death in adults. The adverse childhood experiences (ACE) study. American Journal of Preventive Medicine, 14(4), 245–258.
- Ferraro, K. F., & Shippee, T. P. (2009). Aging and cumulative inequality: How does inequality get under the skin? Gerontologist, 49(3), 333–343.
- Finkelhor, D., Turner, H., Wormuth, B. K., Vanderminden, J., & Hamby, S. (2019). Corporal punishment: Current rates from a national survey. Journal of Child and Family Studies, 28, 1–7.
- Fisher, G. G., & Ryan, L. H. (2018). Overview of the health and retirement study and introduction to the special issue. Work Aging Retire, 4(1), 1–9.
- Glaesmer, H., Brähler, E., Gündel, H., & Riedel-Heller, S. G. (2011). The association of traumatic experiences and posttraumatic stress disorder with physical morbidity in old age: A German population-based study. Psychosomatic Medicine, 73(5), 401–406.
- Grant, B. F. (1997). Prevalence and correlates of alcohol use and DSM-IV alcohol dependence in the USA: Results of the national longitudinal alcohol epidemiologic survey. Journal of Studies on Alcohol, 58(5), 464–473.
- Green, J. G., McLaughlin, K. A., Berglund, P. A., Gruber, M. J., Sampson, N. A., Zaslavsky, A. M., & Kessler, R. C. (2010). Childhood adversities and adult psychiatric disorders in the national comorbidity survey replication I: Associations with first onset of DSM-IV disorders. Archives of General Psychiatry, 67(2), 113–123.
- Guyer, B., Freedman, M. A., Strobino, D. M., & Sondik, E. J. (2000). Annual summary of vital statistics: Trends in the health of Americans during the 20th century. Pediatrics, 106(6), 1307–1317.
- Hardt, J., & Rutter, M. (2004). Validity of adult retrospective reports of adverse childhood experiences: Review of the evidence. Journal of Child Psychology and Psychiatry, 45(2), 260–273.
- Hasin, D., & Link, B. (1988). Age and recognition of depression: Implications for a cohort effect in major depression. Psychological Medicine, 18(3), 683–688.
- Hatch, S. L., & Dohrenwend, B. P. (2007). Distribution of traumatic and other stressful life events by race/ethnicity, gender, SES and age: A review of the research. American Journal of Community Psychology, 40(3–4), 313–332.
- Hauffa, R., Rief, W., Brähler, E., Martin, A., Mewes, R., & Glaesmer, H. (2011). Lifetime traumatic experiences and posttraumatic stress disorder in the German population: Results of a representative population survey. The Journal of Nervous and Mental Disease, 199(12), 934–939.
- Health and Retirement Study. (2006). HRS Core (Final) (v.3.0) public use dataset. Produced and distributed by the University of Michigan with funding from the National Institute on Aging (grant number NIA U01AG009740). Ann Arbor, MI, (2014).
- Health and Retirement Study. (2008). HRS Core (Final) (v.3.0) public use dataset. Produced and distributed by the University of Michigan with funding from the National Institute on Aging (grant number NIA U01AG009740). Ann Arbor, MI. (2014).
- Health and Retirement Study. (2010). HRS Core (Final) (v.5.1) public use dataset. Produced and distributed by the University of Michigan with funding from the National Institute on Aging (grant number NIA U01AG009740). Ann Arbor, MI. (2017).
- Health and Retirement Study. (2012). HRS Core (Final) (v.2.0) public use dataset. Produced and distributed by the University of Michigan with funding from the National Institute on Aging (grant number NIA U01AG009740). Ann Arbor, MI. (2017).
- Health and Retirement Study (2014). RAND HRS Detailed Imputations File (V2). Produced by the RAND center for the study of aging, with funding from the national institute on aging and the social security administration (February 2018). (pp. 309–310). Santa Monica, CA.
- Heiss, F. (2011). Dynamics of self-rated health and selective mortality. Empirical Economics, 40(1), 119–140.
- Hussey, J. M., Chang, J. J., & Kotch, J. B. (2006). Child maltreatment in the USA: Prevalence, risk factors, and adolescent health consequences. Pediatrics, 118(3), 933–942.
- Institute of Medicine of the National Academies. (2010). Operation enduring freedom and operation Iraqi freedom: Demographics and impact (Chapter 2). In Returning home from Iraq and Afghanistan: Preliminary assessment of readjustment needs of veterans, service members, and their families (pp. 17–38). Washington, DC: The National Academies Press.
- Kagan, J. (2016). An overly permissive extension. Perspectives on Psychological Science, 11(4), 442–450.
- Kessler, A.-G., Alonso, S., Benjet, J., Bromet, C., Cardoso, E. J., Degenhardt, G., ..., Ferry, F. J. E. J. o. P. (2017). Trauma and PTSD in the WHO world mental health surveys. European Journal of Psychotraumatology, 8(sup5), 1353383.
- Kessler, R. C., Aguilar-Gaxiola, S., Alonso, J., Chatterji, S., Lee, S., Ormel, J., ..., Wang, P. S. (2009). The global burden of mental disorders: An update from the WHO World Mental Health (WMH) surveys. Epidemiology and Psychiatric Sciences, 18(1), 23–33.
- Kessler, R. C., McLaughlin, K. A., Green, J. G., Gruber, M. J., Sampson, N. A., Zaslavsky, A. M., & Williams, D. R. (2010). Childhood adversities and adult psychopathology in the WHO world mental health surveys. The British Journal of Psychiatry : the Journal of Mental Science, 197(5), 378–385.
- Keyes, K. M., & Li, G. (2012). Age–period–cohort modeling. In Injury research (pp. 409–426). Boston, MA: Springer.
- Keyes, K. M., Li, G., & Hasin, D. S. (2011). Birth cohort effects and gender differences in alcohol epidemiology: A review and synthesis. Alcoholism: Clinical and Experimental Research, 35(12), 2101–2112.
- Kilpatrick, D. G., Resnick, H. S., Milanak, M. E., Miller, M. W., Keyes, K. M., & Friedman, M. J. (2013). National estimates of exposure to traumatic events and PTSD prevalence using DSM-IV and DSM-5 criteria. Journal of Traumatic Stress, 26(5), 537–547.
- Klerman, G. L., Lavori, P. W., Rice, J., Reich, T., Endicott, J., Andreasen, N. C., ..., Hirschfield, R. M. A. (1985). Birth-cohort trends in rates of major depressive disorder among relatives of patients with affective disorder. Archives of General Psychiatry, 42(7), 689–693.
- Krause, N., Shaw, B. A., & Cairney, J. (2004). A descriptive epidemiology of lifetime trauma and the physical health status of older adults. Psychology and Aging, 19(4), 637–648.
- Logan-Greene, P., Green, S., Nurius, P. S., & Longhi, D. (2014). Distinct contributions of adverse childhood experiences and resilience resources: A cohort analysis of adult physical and mental health. Social Work in Health Care, 53(8), 776–797.
- Maughan, B., & Rutter, M. (1997). Retrospective reporting of childhood adversity: Issues in assessing long-term recall. Journal of Personality Disorders, 11(1), 19–33.
- McLaughlin, K. A., Conron, K. J., Koenen, K. C., & Gilman, S. E. (2010). Childhood adversity, adult stressful life events, and risk of past-year psychiatric disorder: A test of the stress sensitization hypothesis in a population-based sample of adults. Psychological Medicine, 40(10), 1647–1658.
- Myers, J. E. B. (2008). A short history of child protection in America. Family Law Quarterly, 42(3), 449–463.
- Norris, F. H. (1992). Epidemiology of trauma: Frequency and impact of different potentially traumatic events on different demographic groups. Journal of Consulting and Clinical Psychology, 60(3), 409.
- O’Donovan, A., Cohen, B. E., Seal, K. H., Bertenthal, D., Margaretten, M., Nishimi, K., & Neylan, T. C. (2015). Elevated risk for autoimmune disorders in Iraq and Afghanistan veterans with posttraumatic stress disorder. Biological Psychiatry, 77(4), 365–374.
- Ogle, C. M., Rubin, D. C., Berntsen, D., & Siegler, I. C. J. C. P. S. (2013). The frequency and impact of exposure to potentially traumatic events over the life course. Clinical Psychological Science, 1(4), 426–434.
- Ogle, C. M., Rubin, D. C., & Siegler, I. C. (2013). The impact of the developmental timing of trauma exposure on PTSD symptoms and psychosocial functioning among older adults. Developmental Psychology, 49(11), 2191.
- Picciotto, S., & Hertz-Picciotto, I. (2015). Commentary: Healthy worker survivor BiasA still-evolving concept. Epidemiology, 26(2), 213–215.
- R Core Team. (2013). R: A language and environment for statistical computing.
- Reuben, A., Moffitt, T. E., Caspi, A., Belsky, D. W., Harrington, H., Schroeder, F., … Danese, A. (2016). Lest we forget: Comparing retrospective and prospective assessments of adverse childhood experiences in the prediction of adult health. Journal of Child Psychology and Psychiatry, 57(10), 1103–1112.
- Riedl, D., Beck, T., Exenberger, S., Daniels, J., Dejaco, D., Unterberger, I., & Lampe, A. (2019). Violence from childhood to adulthood: The influence of child victimization and domestic violence on physical health in later life. Journal of Psychosomatic Research, 116, 68–74.
- RStudio Team. (2018). RStudio: Integrated development for R. Boston, MA: RStudio, Inc.. Retrieved from http://www.rstudio.com/
- Sarkar, D., Sarkar, M. D., & KernSmooth, S. (2018). Package ‘lattice’: Recuperado el.
- Sheikh, M. A. (2018). Childhood adversities and chronic conditions: Examination of mediators, recall bias and age at diagnosis. International Journal of Public Health, 63(2), 181–192.
- Slavich, G. M. (2019). Stressnology: The primitive (and problematic) study of life stress exposure and pressing need for better measurement. Brain, Behavior, and Immunity, 75, 3–5.
- Slavich, G. M., & Shields, G. S. (2018). Assessing lifetime stress exposure using the stress and adversity inventory for adults (Adult STRAIN): An overview and initial validation. Psychosomatic Medicine, 80(1), 17.
- Smith, J., Ryan, L. H., Sonnega, A., & Weir, D. R. (2017). Psychosocial and lifestyle questionnaire 2006–2016. Ann Arbor, MI, USA: Survey Research Center, Institute for Social Research.
- Sonnega, A., Faul, J. D., Ofstedal, M. B., Langa, K. M., Phillips, J. W., & Weir, D. R. (2014). Cohort profile: The health and retirement study (HRS). International Journal of Epidemiology, 43(2), 576–585.
- Straus, M. A., & Mathur, A. K. (1996). Social change and the trends in approval of corporal punishment by parents from 1968 to 1994. In D. Frehsee, Horn, W., and Bussman, K. (Ed.), Violence against children (pp. 91–105). Berlin and New York: Walter de Gruyter.
- Teicher, M. H., & Parigger, A. (2015). The ‘maltreatment and abuse chronology of exposure’ (MACE) scale for the retrospective assessment of abuse and neglect during development. PloS One, 10(2), e0117423.
- U.S. Department of Health and Human Services. (1999). Blending perspectives and building common ground: A report to congress on substance abuse and child protection. Washington, DC: US Government Printing Office.
- Widom, C. S. (1989). Does violence beget violence? A critical examination of the literature. Psychological Bulletin, 106(1), 3.
- Yang, Y., & Land, K. C. (2013). Age-period-cohort analysis: New models, methods, and empirical applications. Boca Raton, FL: Chapman and Hall/CRC.
- Zajacova, A., & Burgard, S. A. (2013). Healthier, wealthier, and wiser: A demonstration of compositional changes in aging cohorts due to selective mortality. Population Research and Policy Review, 32(3), 311–324.