
ABSTRACT
Urinary extracellular vesicles (UEVs) appear an ideal source of biomarkers for kidney and urogenital diseases. The majority of protocols designed for their isolation are based on differential centrifugation steps. However, little is still known of the type and amount of vesicles left in the supernatant. Here we used an isolation protocol for UEVs which uses hydrostatic filtration dialysis as first pre-enrichment step, followed by differential centrifugation. Transmission electron microscopy (TEM), mass spectrometry (MS), western blot, ELISA assays and tuneable resistive pulse sensing (TRPS) were used to characterise and quantify UEVs in the ultracentrifugation supernatant. TEM showed the presence of a variety of small size vesicles in the supernatant while protein identification by MS matched accurately with the protein list available in Vesiclepedia. Screening and relative quantification for specific vesicle markers showed that the supernatant was preferentially positive for CD9 and TSG101. ELISA tests for quantification of exosome revealed that 14%, was left in the supernatant with a particle diameter of 110 nm and concentration of 1.54 × 10¹⁰/ml. Here we show a comprehensive characterisation of exosomes and other small size urinary vesicles which the conventional differential centrifugation protocol may lose.
Responsible Editor Takahiro Ochiya, Nat Cancer Center Research Institute, Japan
Introduction
Urinary extracellular vesicles (UEVs) are small lipid membrane enclosed structures of heterogeneous size and composition [Citation1–Citation3]. They are secreted by all epithelial cell types lining the nephron and the urinary tract [Citation4–Citation6]. UEVs present a distinct surface glycoprotein assembly [Citation7–Citation9] and a complex proteome [Citation1,Citation4,Citation10,Citation11] containing signalling molecules like transcription factors [Citation12] and a variety of RNA species [Citation13,Citation14] that could act directly on specific target cells [Citation15,Citation16]. Accordingly, one important role for UEVs appears to be information exchange between epithelial cells along the whole nephron [Citation17,Citation18]. Based on these qualities, the interest in UEVs also as sources for new biomarkers has been increasing rapidly. In addition to their proposed biological value, methods for efficient UEV harvesting have been widely investigated [Citation19–Citation21]. The conventional isolation method for UEVs is based on differential centrifugation steps, which includes extended ultracentrifugation to pre-enrich vesicles from a diluted solution like urine. However, independent from the workflow and applications, the supernatant originating from the first ultracentrifugation step is usually discarded, with loss of up to 40% of their whole quantity. These discarded vesicles are positive for markers like tumour susceptibility gene 101 (TSG101) [Citation22].
In this communication, we characterise these normally discarded vesicles and provide their relative quantitation based on particle count and vesicle marker positivity.
Materials and methods
The majority of reagents were purchased from Sigma-Aldrich (St Louis, MO) unless specified otherwise in the text.
Urine samples
Urine samples were collected from healthy volunteers among the laboratory staff, aged 20–44 (N = 4). First morning void urine was processed within 3 h without adding protease inhibitors. Written informed consent was obtained from all participants. This study was approved by The Research Ethics Committee of Dublin City University (DCUREC/2014/222). All the experiments were performed in accordance with the declaration of Helsinki. A total of 25 litres of urine samples were collected and processed as detailed below.
Vesicle purification
Hydrostatic filtration dialysis (HFD) was utilised to enrich UEVs according to the original publication [Citation23] with minor modifications [Citation24], followed by differential centrifugation (see Supplemental Figure 1A). Briefly, pooled urine samples were centrifuged at a relative centrifugal force (RCF) of 2000 g (5000 rpm max speed) calculated at an average radius of 100 mm in a swing bucket rotor Benchtop Universal 320 centrifuge (clearance factor k = 10,153) (Hettich Zentrifugen, Tuttingen, Germany) for 30 min at room temperature (RT) (without braking). Before storing at –80°C, 50 ml of a stock solution made of 1 M sodium citrate and 5 mM ethylenediaminetetraacetic acid disodium salt (EDTA), pH 7.4, was added to 950 ml of supernatant 2000 g (SN) [Citation24]. After thawing the sample, 0.1 mg of silver chloride and 4.5 mg sodium dichloroisocyanurate was added [Citation24] and then the filtration-concentration-dialysis (HFD) was performed at RT using a cellulose ester dialysis membrane with molecular weight cut-off (MWCO) of 1000 kDa (Spectra/Por Biotech MWCO 1,000,000 MWCO; Spectrum Laboratories, Rancho Dominguez, CA). Five ml per tube of the retained solution above the 1000 kDa cut-off (HFDa) was then centrifuged at 40,000 g (18.185 rpm) calculated at maximum radius 108 mm of a fixed angle JA-20 rotor (clearing factor or k factor = 769; adjusted k factor kadj = 930.2 [Citation25]; Beckman Coulter, Fullerton, CA) for 1 h at RT. The 40,000 g supernatant fraction (5 ml per tube) was then ultracentrifuged at 200,000 g (44,000 rpm) calculated at maximum radius 91.9 mm of 70 Ti fixed-angle rotor (k factor = 44; kadj = 111.4 [Citation25] (Beckman Coulter) for 2 h at RT using a Beckman XL-80 Ultracentrifuge (Beckman Coulter). For both centrifugation steps polycarbonate tubes were used and all the pellets sedimented at 40,000 g (HFDa-P40) and 200,000 g (HFDa-P200) were re-suspended in 0.5 ml per tube of mQ water and 40 ml of the final supernatant 200,000 g (HFDa-SN200) was reduced in volume by vacuum concentration up to 5 ml.
Transmission electron microscopy (TEM)
HFDa-SN200 (5 μg total protein in 10 μl of PBS) was fixed in 4% (w/v) paraformaldehyde in phosphate buffer solution (PBS) at 4°C for 20 min. Ten μl was then spotted onto a Formvar/Carbon 200 mesh nickel electron microscopy grid (Agar Scientific, Essex, UK) and dried. The grids were washed three times, 3 min each with PBS and incubated in 2% (v/v) glutaraldehyde for 25 min and after 8× 2 min washes in PBS, grids were contrasted in 2% (w/v) uranyl acetate (UA) for 1 h. After 2× 5 min washes in PBS, grids were transferred to solution made of 2% paraformaldehyde in polyvinyl alcohol (PVA) and 4% UA (PVA/UA), pH 4, for 20 min and then washes with PVA for 10 min. After staining, samples were observed using a JEM 1,011 transmission electron microscope at 80 kV.
Protein assay, gel electrophoresis and western blot
Protein quantification was performed by Coomassie microassays [Citation26]. The volume equivalent of 10 μg of protein for each fraction was dried in vacuum concentration (MiVac concentrator duo pump, Genevac, Ipswich, UK) and then solubilised in 40 μl of 7 M urea, 2 M thiourea, 5% (w/v) sodium dodecyl sulfate (SDS), 40 mM Tris-HCl, pH 6.8, 0.5 mM ethylenediaminetetraacetic acid (EDTA), 20% (v/v) glycerol (non-reducing condition; NR) and 50 mM dithiothreitol (DTT) (reducing condition; R). Samples were incubated overnight (ON) at RT [Citation23]. Proteins were separated by SDS-PAGE [Citation27] and stained either with colloidal Coomassie G-250 [Citation28] or transferred to 0.45 μm nitrocellulose membrane (Whatman, Springfield, UK) [Citation29]. Nitrocellulose membranes were saturated with Odyssey blocking buffer (LI-COR Biosciences, Lincoln, Ma) and incubated in Odyssey blocking diluted 1:1 with PBS and 0.15% (v/v) Tween-20 with specific antibody: Mouse anti-THP 0.5 μg/ml; mouse anti-CD63 0.5 μg/ml; mouse anti-CD9 0.5 μg/ml; mouse anti-CD81, rat anti-dipeptidyl dipeptidase 4 (DDP4) 0.5 μg/ml and mouse anti-neprilysin (NEP) 0.5 μg/ml (R&D Systems Inc., Minneapolis, MN); mouse anti-CD9 1.0 μg/ml (Merck Millipore, Bellerica, MA); mouse anti-CD9, CD63, CD81, Rab5b and flotilin 1 1.0 μg/ml (HansaBioMed, Tallinn, Estonia); mouse anti-programmed cell death interacting protein (ALIX) 0.5 μg/ml; (Thermo Scientific, Waltham, MA), rabbit anti-tumour susceptibility gene 101 (TSG101) 0.5 μg/ml; and mouse anti-β-actin 0.5 μg/ml (Sigma Aldrich, Dorset, UK); rabbit anti-human Apo A1 1.0 μg/ml (Dako, Glostrup, Denmark). After 3× 10 min washes in PBS-Tween (0.15%, v/v), membranes were incubated with either red (excitation 680 nm, emission 700 nm) or infrared (displayed in green colour excitation 780 nm, emission 800 nm) dye-coupled secondary antibody 0.1 μg/ml (LI-COR Biosciences) in Odyssey blocking solution diluted at 1:1 with PBS and 0.15% (v/v) Tween-20, 1 h at RT. Acquisition of the fluorescent signal was performed by Odyssey infrared imaging system with resolution set at 169 µm (LI-COR Biosciences). Quantification of the signal was performed by Odyssey Infrared Laser Scanner software on single channel (LI-COR Biosciences).
Diagonal SDS-PAGE
Two-dimensional (2D) SDS-PAGE was performed according to a standard protocol [Citation30], with some modifications. Briefly, for the first dimension the protein solubilisation and separation was carried out under non-reducing (NR) conditions, 60 µg of protein was denatured in 60 µl of a buffer containing 7 M urea, 2 M thiourea, 40 mM Tris-HCl, pH 6.8, 5% SDS, 0.4 mM EDTA, 20% glycerol, at 20°C ON in agitation in a thermomixer (TherMixer C Eppendorf, Hamburg, Germany). Gels were run at 15 mA (constant) in gradient gel (T 6–18%; C 2.6%), size 86 × 68 × 1 mm3. At the end of the run, strips of acrylamide gel of the size of the well were cut and they were reduced first in a buffer made of 6 M urea, 100 mM Tris-HCl, pH 8.8, 5% SDS, 0.4 mM EDTA, 20% (v/v) glycerol, 1% (w/v) plus DTT for 20 min and then alkylated with the above buffer containing 2.6% (w/v) iodoacetamide (IAA) for 20 min under agitation. Strips were then placed on top of a T 6–18%; C 2.6% gradient gel size 86 × 68 × 1.5 mm and sealed with a 0.5% (w/v) agarose low electroendosmosis, low melting point running buffer. At the end of the separation carried out at 20 mA (constant), gels were stained either with colloidal Coomassie or transferred to 0.45 µm nitrocellulose membrane as describe above.
Mass spectrometry analysis
Sample preparation for mass spectrometry (MS) analysis was performed according to Liu and colleagues [Citation31]. Briefly, SN200 (200 μg as dry pellet) was resolubilised and reduced by solution made of 10 mM tris(carboxyethyl)phosphine (TCEP), 8 M urea, 0.1 mM EDTA and 0.2 M Tris buffer, pH 8.8, in dark for 1 h at RT, followed by alkylation with 20 mM IAA in dark for 2 h. Finally, 40 mM N-acetylcysteine (NAC) was used to quench the excess of IAA. The sample was then ultrafiltered using Vivaspin 15 R 10 kDa MWCO membranes (Sartorius Stedim Biotech GmbH, Göttingen, Germany) at 2000 g, at RT, using 3× 10 ml washes with 50 mM Tris-HCl pH 8.0. The retained washed fraction (200 μl) was digested by sequencing grade modified trypsin (Promega Corp, Madison, WI) in a ratio of 1 μg of trypsin for 50 μg of total protein, at +37°C ON. The sample was then ultrafiltered using a 30 kDa MWCO Vivaspin 15 R device. The retained and washed (3× 10 ml) 30 kDa fraction (external proteome) was incubated with 1% (w/v) sodium deoxycholate (DOC) to solubilise the membrane of UEVs and release the equivalent of the intraluminal proteome which underwent reduction and alkylation as described above, without urea. Sample was digested by sequencing grade trypsin in presence of 1% DOC in a ratio of 1 μg of trypsin for 50 μg of total protein, at +37°C ON. Finally, the internal proteome was acidified with 1% (v/v) formic acid (FA) to precipitate DOC and then the supernatant, along with the external proteome, was cleaned up by Sep-Pak C18 cartridge (Waters Associates, Milford, MA) according to manufacturer’s instructions. Cleaned up samples were re-suspended in 20 ml of 0.1% (v/v) TFA in 2% (v/v) acetonitrile (ACN) solution and 1 μg of peptide mixture estimated at 280 nm by Nanodrop ND-1000 (Thermo Scientific, Waltham, MA) was analysed using a nano LC system (Ultimate 3000 nanoRSLC system, Dionex, Sunnyvale, CA) coupled to an LTQ Orbitrap XL mass spectrometer (Thermo Fisher Scientific); peptides were eluted with the following binary gradients: solvent A (2% ACN and 0.1% formic acid in LC-MS grade water) and 0–65% solvent B (80% ACN and 0.08% formic acid in LC-MS-grade water) for 60 min using a nanoRPC column (PepMap C18, 7 mm id 250 mm, 3 mm particle and 100 Å pore size (Dionex)). The linear trap quadrupole was operated in a data dependent acquisition mode with the Xcalibur software (Thermo Scientific, Dublin, Ireland). Full mass spectra were recorded in profile mode over a mass range of 300–2000 m/z and tandem mass spectra recorded in profile mode. Dynamic exclusion was enabled with an exclusion duration of 30 s. Protein identification searches were performed using the information in the tandem mass spectra by searching against the UniProtKB/Swissprot protein database (Homo sapiens species) using MASCOT search engine (Version 2.3, Matrix Science, London, UK). Searches were carried out with trypsin specificity (one missed cleavage allowed), 0.5 Da for MS and 0.5 Da for MSMS (oxidations of Methionine and Propionamide Cys were set as variable modifications). A MASCOT score 40 was considered significant.
RNA extraction and analysis
A urine exosome RNA isolation kit (Norgen Biotek, Thorold, Canada) and mirVanaTM miRNA isolation kit were used for RNA extraction from an aliquot of 500 µg per each fraction in triplicate according to manufacturer’s instructions. RNA was eluted from the columns using 50 μl of elution buffer and quantity and quality determined spectrophotometrically by Nanodrop ND-1000, Qubit Fluorometer using RNA HS Assay Kit (Life Technologies, Carlsbad, CA) and by capillary electrophoresis (Agilent 2100 Bioanalyzer, Agilent Technologies, Foster City, CA). RNA was analysed with the Agilent small RNA kit (Agilent technologies) according to the manufacturer’s protocol. Additionally, Qubit dsDNA HS Assay Kit (Life Technologies) was used to analyse any DNA co-purification.
Fluorophore-linked immunosorbent assay (FLISA) and ELISA for vesicle quantitation
Ninety-six well microplate high-binding proteins (Greiner bio-one, Kremsmünster, Austria) were coated with 35 µl of HFDa and differential centrifugation fractions at a concentration of 0.3 µg/µl in sterile PBS and incubated ON at +4°C. After three washes with PBS, 100 µl/well of Odyssey® blocking solution was added and incubated at +4°C ON. Following 3× 10 min washes in PBS Tween-20 0.15% (v/v) (PBST), monoclonal antibody anti-tetraspanin, CD9 (R & D System, Merck Millipore and HansaBioMed), CD63 (R&D Systems and HansaBioMed) and CD81 (R&D System and HansaBioMed) were added in a final volume of 100 µl at concentration of 1 µg/µl in Odyssey® blocking diluted 1 to 1 with PBS and 0.15 (v/v) Tween-20 and incubated overnight at RT. After 3× 10 min washes with PBST, goat anti-mouse IgG (H + L), was applied for 2 h at RT in a dilution of 1∶5000 in Odyssey® blocking solution diluted 1 to 1 in PBS and 0.15 (v/v) Tween-20 followed by 3× 10 min washes in PBST and 2× 10 min washes in PBS. Visualisation and quantification was carried out with LI-COR Odyssey® scanner and software (LI-COR Biosciences). Quantification was performed on single channel with the analysis software provided as per manual instructions. Infrared Imaging System Scan resolution was set at 169 µm.
ExoTESTTM quantification kit for urinary exosomes (Catalogue number HBM-RTK-POF/TU HansaBioMed, Tallinn, Estonia) was used according to manufacturer’s instructions.
Tuneable resistive pulse sensing
Tuneable resistive pulse sensing (TRPS) measurements were performed with qNano instrument (Izon Ltd, Christchurch, New Zealand) according to manufacturer’s instructions. Polyurethane nanopore membrane NP150 (analysis range 85–300 nm) (Izon Ltd) was utilised, stretched at 46 mm and the voltage set at 0.62 V. Multipressure at 2, 4 and 6 mbar, respectively, was applied to determine the particle concentration. Electrolyte solution was made of 50 mM Tris pH 7.4 and 0.05% (v/v) Triton X 100 filter with a Millipore Millex GS 0.22 μm syringe filter (Merck Millipore). Current pulse signals were collected using Izon Control Suite 3.1.2.268 software (Izon Ltd). Blockade counts setting in this study was fixed at minimum of 800 events or 10 min recording. Calibration was made using standard polystyrene particles of 100 nm (CPC100b; Izon Ltd). UEV fractions were sonicated for 5 min, filtered, with a Millipore Millex GS
Results
Isolation of UEVs from the pool of urines from healthy donors was performed by the HFD method followed by differential centrifugation protocol (see Supplemental Figure 1A) [Citation23]. The protein pattern, the detection of TSG101 and tetraspanin CD63 recapitulated the results obtained in the original publication [Citation23] where vesicle markers like TSG101 and CD63 were still present in the final supernatant.
TEM of UEVs isolated by HFD and differential centrifugation
The analysis of the 200,000 g supernatant (SN200) by TEM () confirmed the physical presence of vesicles in the fraction. Qualitative images at 40,000 (Panels A and B) and 50,000 (Panels C and D) magnification revealed small intact vesicles with a “cup- or saucer-shape” (arrows) morphology as characteristic distortion of vesicles caused by sample preparation for TEM and widely reported in literature, along with roundish vesicles within 30–50 nm size range (stars) (panels A1, A2, B1, B2, C1, C2, D1 and D2). Filamentous structures, most likely consisting of Tamm–Horsfall glycoprotein (THP) are still visible (Panel C and D). Apparently they seemed to connect different vesicles to each other in interweaved pattern which suggests a potential binding or absorption of the vesicles onto the filaments.
Figure 1. Transmission electron micrograph of vesicles in the 200,000 g supernatant. Ten μg of protein was adsorbed on the grid and negative stained by uranyl acetate. Images were taken at ×40,000 (A and B) and ×50,000 (C and D) magnifications. This magnification was used as in published literature to identify exosomes and exosome-like particles based on their diameter (20–100 nm): exosomes (arrows) and exosome-like vesicles (stars). Figures on the right are enlargements of area of the same field to better visualise the morphology.
Mass spectrometry for UEV protein identification in ultracentrifugation supernatants
Two hundred micrograms equivalent of UEV protein of the ultracentrifugation supernatant were prepared for MS analysis according to Liu et al [Citation31]. This approach aimed to decrease the interference of ever present Tamm-Horsfall (THP) glycoprotein and distinguish the “external” from the “internal proteome”. A total of 182 proteins with at least two unique peptides were identified, 149 of which were in the “external proteome” and 113 were found in the “internal proteome”. The full list is reported in Supplemental . ) shows the Venn diagram of the protein identifications as per gene name of the “external” and “internal proteome” with respect to the set of genes-proteins listed in the Vesiclepedia and in the specific subset of the urinary vesicle database [Citation32]. Out of 180 gene-protein entries, 166 were common to the UEV data set, 10 of which matched with vesicles originated from other tissue and reported in Vesiclepedia. Only two were unique for the SN200 (). These two included multivesicular body protein 12A, which belongs to complex 3 of the Endosomal Sorting Complex Required for Transport (ESCRT), and mucin-20, a membrane protein localised on the apical plasma membrane of proximal tubules [Citation33] which was earlier identified at mRNA level in the UEVs [Citation34]. The majority of the other 9 entries shared with Vesiclepedia data set consisted of immunoglobulins. A more detailed gene ontology analysis according to the updated version of Protein ANalysis THrough Evolutionary Relationships (PANTHER version 10.0) classification system [Citation35] retrieved from Vesiclepedia and SN200 (,)) was performed to check the distribution as per cellular components. The distribution of the hits showed a closely similar distribution with a proportionally higher amount of extracellular region and matrix proteins in the SN200 (see Supplemental ).
Table 1. List of protein identifications unique in SN200 (yellow) and in common with vesicles enriched from other sources and not found in urine (blue).a Protein identifications found only in one replica.
Table 2. Summary of the relative quantification in FLISA (blue), western blot (black), tuneable resistive pulse sensing (TRPS) and ELISA (ExoTESTTM). Values are expressed as percentage of the amount detected in HFDa [HFDa-X/HFDa × 100, where X is either P40 or P200 or SN200]. Red italic values are based on the ratio of the particle number in each fraction to the sum of the particles of all the fractions [HFDa-X/(HFDa-P40 + HFDa-P200 + HFDa-SN200) *100, where X is either P40 or P200 or SN200]. aR&D Systems antibody; bHansaBioMed antibody; cMerck Millipore antibody.
Figure 2. Mass spectrometry analysis. A Venn diagram showing the distribution of the number of identified protein present in the HFD-SN200 (180 gene proteins) with respect to the all human protein found in EVs (8450 gene proteins) and UEVs (4834 gene proteins) in the repository available in Vesiclepedia. Gene ontology classification per cell component of the identified proteins in the UEVs available in Vesiclepedia (B) [Citation33] and HFDa-SN200 (C) according to the Panther classification system (www.panther.org) [Citation35].
![Figure 2. Mass spectrometry analysis. A Venn diagram showing the distribution of the number of identified protein present in the HFD-SN200 (180 gene proteins) with respect to the all human protein found in EVs (8450 gene proteins) and UEVs (4834 gene proteins) in the repository available in Vesiclepedia. Gene ontology classification per cell component of the identified proteins in the UEVs available in Vesiclepedia (B) [Citation33] and HFDa-SN200 (C) according to the Panther classification system (www.panther.org) [Citation35].](/cms/asset/59c125d0-9973-4c5b-b94e-14b68fa70d9e/zjev_a_1267896_f0002_oc.jpg)
Western blot screening of UEV markers
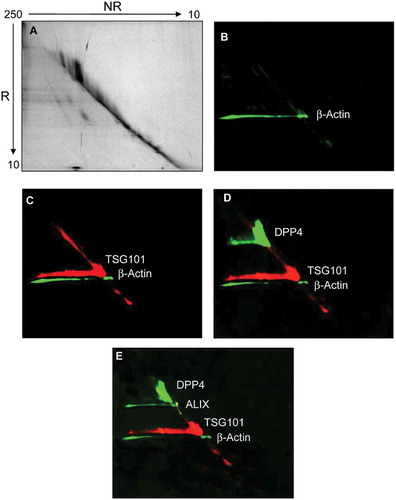
The detection of selected UEV markers identified by MS analysis was carried out using western blots (WBs), first denaturing the samples either with or without reducing agent (DTT) prior to electrophoresis. Initially, this analysis was used to detect the change of THP molecular weight (from 80 to 100 kDa without and with DTT, respectively) and to better distinguish programmed cell death interacting protein (Alix), neprilysin (NEP) and dipeptidyl peptidase 4 (DPP4), which all have an apparent molecular weight (MW) close to THP. confirms that in reducing (R) conditions THP has an apparent MW of 100 kDa while preserving the 24 disulfide bonds (NR) of THP, the apparent MW shifts to 80 kDa ()). Detection of DPP4 ()), Alix ()) and NEP ()) showed the presence of these three antigens in the HFDa-SN200 in NR (DPP4) and R conditions (Alix, NEP) respectively. A further screening of other markers showed that anti-tumour suppressor gene 101 (TSG101) ()) and tetraspanin CD63 ()) are detected in both conditions while CD81 ()) and CD9 (two different antibodies )) the hybridisation with the antibody performed in NR, recognising the antigens in the HFDa-SN200. CD63 was detected at 37 kDa in a specific sharp band by the antibody from R&D Systems. CD63 is a heavily glycosylated protein with molecular weight isoforms which span between 30 and 70 kDa depending on the glycosylation grade which can be different for different cell lines and/or stimulation [Citation36,Citation37]. Conversely, assuming apolipoprotein A1 and β-actin as internal negative controls (since they were not identified in MS in SN200), detection of the signal was visible in the pellets while absent in the HFDa-SN200. Interestingly, DPP4, TSG101, Alix, THP and β-actin in P40 appeared in WB at higher MW than their respective monomeric forms, suggesting that disulfide bonds could be involved in this oligomerisation. Conversely, THP showed signs of polymerisation in the HFDa-P200 and the HFDa-SN200 fractions but not in HFDa-P40 suggesting that different isoforms of THP which can form interchain disulfide bonds, are present in HFDa and can be separated by centrifugation. Additionally, a diagonal SDS gel electrophoresis was performed to check further selected antigens detectable in reducing conditions (). WB analysis confirmed the presence of homo-/heteropolymeric complexes stabilised by interchain disulfide bonds. Pellet HFDa-P40 was chosen to avoid any potential massive interference of THP during the separation. Alix, TSG101, DPP4 and β-actin polymers were efficiently resolved in the second dimension in the presence of DTT. The majority of TSG101 signal fell on the “diagonal”; nonetheless a smear lying on the diagonal is visible and either a poor resolution or more complex supramolecular organisation like multiple monoubiquitination [Citation38] should be taken into consideration.
Figure 3. SDS-polyacrylamide gel electrophoresis (SDS-PAGE) and western blot (WB) analyses of UEV yield after hydrostatic filtration dialysis (HFD) and differential centrifugation. Ten μg of protein was loaded in each lane and stained with colloidal Coomassie (A). Lane 1 HFDa; Lane 2, HFDa-P40; Lane 3 HFDa-P200 g; Lane 4 HFDa-SN200. Western blots were probed with antibodies against: (B) dipeptidyl dipeptidase 4 (DDP4); (C) Tamm–Horsfall protein (THP); (D) neprilysin (NEP); (E) programmed cell death 6-interacting protein (ALIX); (F) tumour susceptibility gene 101 (TSG101); (G) tetraspanin CD63 (R&D Systems antibody); (H) tetraspanin CD81 (R&D Systems antibody); (I) tetraspanin CD9 (Merck Millipore antibody); (J) tetraspanin CD9 (R&D Systems antibody); (K) Anti ApoA1, (L) β-actin. Molecular weights are expressed in kilo Daltons (kDa).
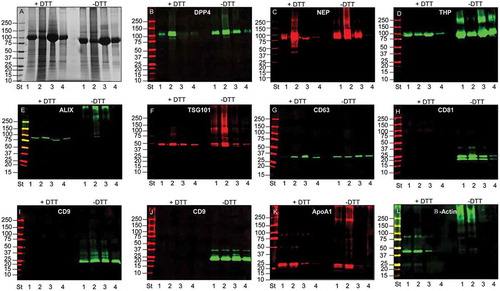
Figure 4. Diagonal SDS-polyacrylamide gel electrophoresis and western blot (WB) analyses of UEV recovered at 40,000 g. Thirty μg of protein was loaded in the first dimension. The gel was stained with colloidal Coomassie (A). Consecutive detection in WB of: (B) β-actin, (C) tumour susceptibility gene 101 (TSG101), (D) dipeptidyl dipeptidase 4 (DDP4); (E) programmed cell death 6-interacting protein (ALIX) in this chronological order. NR: non-reducing (-DTT), R: reducing (+DTT).
Extraction and electrophoresis profile of sRNA
sRNA was extracted initially using a column-based method specifically designed first to capture urinary exosomes and then the RNA content (Norgen Biotek). Additionally a lysis phenol and column based method dedicated to miRNA extraction (mirVana™) was utilised when no RNA was detected in HFDa-SN200. The mirVana™ did not detect sRNA and overall, discrepancies between the spectrophotometer (Nanodrop) and fluorescence (Qubit) measures were observed for both extraction methods (see Supplemental Table 3). Thus, supposing a potential presence of DNA could be the cause, a fluorescent assay was employed to evaluate the presence of DNA. Only MirVana™ gave a positive reading just above the detection limit for the HFDa-SN200 (Supplemental Table 3).
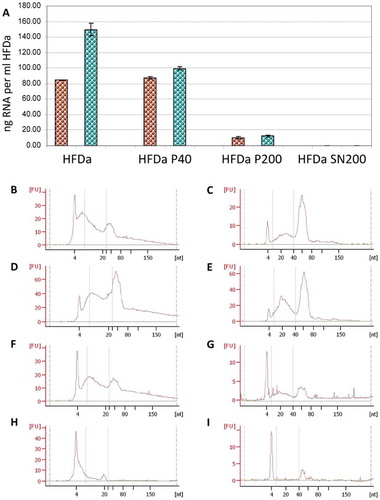
According to the fluorescence assay, the majority of RNA was extracted from HFDa-P40 with both extraction methods ()). Vesicles recovered in HFDa-P200 provided a minimal amount of the sRNA extracted whilst no RNA in HFDa-SN200 was captured. The profile of the sRNA extracted from the differential centrifugation fractions was evaluated with the Agilent small chip RNA. It revealed a typical electropherograms for UEVs [Citation39,Citation40] which was similar for all the fractions, with both methods. However, some differences in the profiles for the HFDa, HFDa-P40 and HFDaP200 were noticed. The mirVana kit gave a higher enrichment of 40–80 nt RNA (asterisk *) than the microRNA fraction (10–40 nt) (hash tag #) ()). Conversely, in the Norgen profile an equal enrichment for both RNA types (* and #) ()) was seen. The electropherograms of HFDa-SN200 confirms the result with a substantial lack of RNA for both methods.
Figure 5. sRNA yield and profile in the differential centrifugation pellets and supernatant. RNA extraction was performed in triplicate (see Supplemental Table 3) and the quantity was assessed by fluorescence assay and referred per ml of HFDa: (A) brown, Norgen RNA isolation kit; green, mirVana™ RNA quality was evaluated using the Agilent 2100 Bioanalyzer using small Chip for HFDa (B,C); HFDa-P40 (D,E), HFDa-P200 (E,F) and HFDa-SN200 (G,H). Norgen RNA isolation kit (B, D, F and H) mirVana™ (C, E, G and I) profiles are representative of triplicate (Supplemental Figures S2 and S3).
Relative quantification of exosome markers by FLISA and western blots
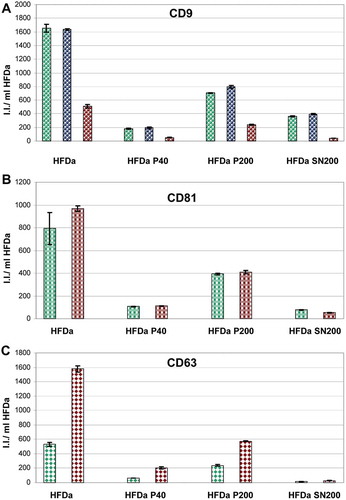
A FLISA-based analysis for the detection of tetraspanin, CD9, CD63 and CD81 was developed to assess the relative amount of the three tetraspanins using seven different monoclonal antibodies. shows the integrated fluorescent intensity (I.I.) of the three antigens expressed per ml of HFDa. Independently from the affinity of each antibody in recognising the respective antigens, the majority of the signal (~45–50%) detected in HFDa is by vesicles, most likely exosomes, sedimented in HFDa-P200. The rest of the signal was split between HFDa-P40 and HFDa-SN200 in different ratio depending on the type of antibody. In HFDa-SN200 two out of three anti-CD9 antibodies showed twice the reactivity than in HFDa-P40. Conversely, CD81 signal in HFDa-SN200 was 3.6 and 6.5 times less than in HFDa-P40 and HFDa-P200, respectively, whilst traces of CD63 with both antibodies were detected in HFDa-SN200. Taken together, the HFDa-SN200 fraction appears rich in CD9 positive vesicles.
Figure 6. Plots of the fluorescent integrated intensity (I.I.) per ml of HFDa ± standard deviation of vesicles-immobilised FLISA (Supplemental Figure S4) per each fraction obtained from the differential centrifugation protocol. (A) CD9 (green R&D Systems antibody, blue Merck Millipore antibody, red HansaBioMed antibody); (B) CD81; (green R&D Systems antibody, red HansaBioMed antibody); (C) CD63 (green R&D Systems antibody, red HansaBioMed antibody).
A more exhaustive characterisation of all the fractions recovered from HFDa, centrifugation pellets (HFDa-P40 and HFDa-P200) and final supernatant (HFDa-SN200) was carried out using WB. shows the column charts of the fluorescent intensities (I.I.) expressed per ml of HFDa for the electrophoresis bands of: CD9 ((A–C)), CD81 ()), CD63 ()), TSG101 ()), Alix ()), Rab5 ()) and flotilin 1 ()). Tetraspanins, CD63, CD9, CD81, Rab5 and flotilin 1 samples were denatured without DTT, whilst for TSG101, Alix and CD63, DTT was added to the samples prior to electrophoresis. Detection of these seven established vesicle markers revealed a distribution across the three fractions characteristic for each antigen without an apparent link between them. Tetraspanin, CD9, CD63 and CD81 confirmed the relative quantification and distribution seen for HFDa-P40, HFDa-P200 and HFDa-SN200 in the FLISA.
Figure 7. Plots of the fluorescent integrated intensity (I.I.) per ml of HFDa ± standard deviation of three independent western blots (Supplemental Figure S5, S6 and S7) per each fraction obtained from the differential centrifugation protocol. (A,B,C) CD9 (green R&D Systems antibody, blue Merck Millipore antibody, red HansaBioMed antibody); (D,E) CD81; (bright green represent the upper band and green the lower band of R&D Systems antibody, bright red represents the upper band and red the lower ban of HansaBioMed antibody); (F,G) CD63 (lime is the detection of the sample in non-reducing condition (NR) and green is in reducing condition (R) for R&D Systems antibody, dark red HansaBioMed antibody in NR); (H) TSG101 (plum Sigma antibody); (I) Alix (Indigo Thermo Fisher antibody); (J) Rab5 (red HansaBioMed antibody); (K) Flotilin 1 (red HansaBioMed antibody).
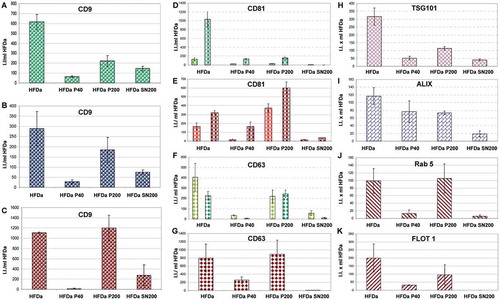
Interesting to notice, the pattern of CD63 with the two antibodies used was different. A specific band at 37 kDa for the R&D Systems antibodies was observed whilst the HansaBioMed antibody appears to recognise a strong band at around 50 kDa which corresponds to the canonical glycosylated isoform. However, it recognises an additional less intense band at 37 kDa indirectly suggesting that the epitope at 37 kDa is indeed the CD63 antigen. The ESCRT proteins TSG101 (H) and Alix ()) were half and a quarter of the signal detected for HFDa-P200, respectively. No signal for flotilin 1 ()) in the HFDa-SN200 was visible confirming the MS data. Detection of Rab5 showed a minimal detection at the correct molecular weight (25kDa) while the bulk of the signal (see Supplemental Figure S5) was visible at very high molecular weight (375 kDa). Interestingly, several of the antigens, including Alix, TSG101, β-actin ( panel E,F,J,L), Rab5 (Supplemental Figure S5) and flotilin 1 (Supplemental Figure S7) detected in NR conditions (-DTT) showed the presence in WB of bands at high molecular weight which then were resolved at the correct MW with DTT.
Particle quantification by TRPS and vesicle quantification
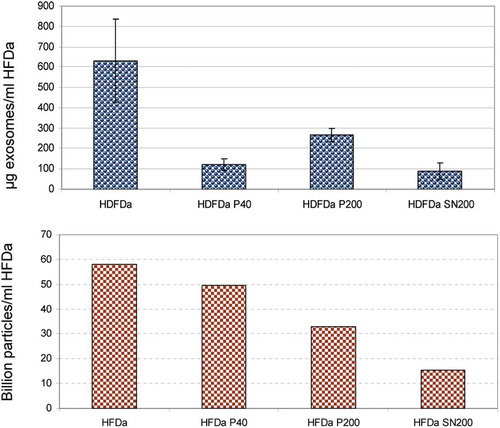
TRPS measurements were performed using a nanopore membrane size suitable for particles in the range of 85–300 nm (NP150). Multi pressure protocol according to the manufacturer’s instructions was applied to obtain a more accurate estimation of particle counts. All the samples were filtered using a 0.22 µm syringe filter. This was an unavoidable step to decrease the complexity of the samples along with an appropriate dilution of the fractions in order to obtain a stable current baseline during and across all the measures. Membrane pore stretch, voltage current and pressure values were the same and they were set to compromise a good and stable readout for all the 4 fractions with a background noise ≤15 pA. shows a representative particle size distribution (PSD) and concentration at the pressure of 4 mbar. Interestingly, the distribution of vesicles in the HFDa-SN200 is more similar to the HFDa-P40 rather than HFDa-P200. In parallel, exosome concentration was established using a double sandwich ELISA assay. Exosome levels particle number in the differential centrifugation fractions were expressed per ml of HFDa. shows that the majority of exosomes are collected in HFDa-P200 according to the sedimentation coefficients. However, it is interesting to note that the bulk of the particles recorded in the TRPS analysis were in HFDa-P40 while a still important amount was left in the HFDa-SN200 as shown in panel B.
Figure 8. Size distribution of vesicles in HFDa and subfractions. The size distribution of fractionated UEVs was established after calibrating the samples (UEVs) with respect to 100 nm standard particles (CPC100b) at pressure of 4 mbar.
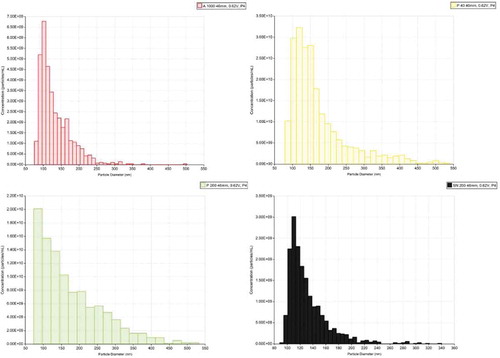
Figure 9. Comparative distribution of exosomes vs particle numbers. Quantification of exosomes by ExoTEST™ ELISA kit (A) and TRPS particle counts based on the multipressure analysis (B) HFDa 5.82 × 10¹⁰, HFDa-P40 4.96 × 10¹⁰, HFDa-P200 3.29 × 10¹⁰, HFDa-SN200 1.54 × 10¹⁰.
sums up the results obtained by the relative quantification performed in FLISA, WB, TRPS and sandwich ELISA. Results are expressed as percentage of recovery in each fraction with respect to the starting material (HFDa). Overall it appears that in FLISA nearly 50% and more than the 10% of the vesicles positive for CD9, 63 and 81 are recovered in HFDa-P200 and HFDa-P40, respectively, whilst around 25% of vesicles CD9 positives are left in the HFDa-SN200 with traces of the other two tetraspanins detectable. The result from the sandwich-ELISA agrees, to some extent, with the CD9 results in FLISA although the capture antibody epitope is not disclosed. The relative quantification based on WB showed much more variability especially for those antigens detected in NR conditions. The formation of complexes by disulfide bonds, as shown in and and S5, S6, S7, apparently affected the resolution and in the analysis of each antigen we exclude all those bands bigger or smaller than the nominal molecular weight. However, it seems that there is a good agreement for the tetraspanins detected in FLISA and WB.
Discussion
Here we provide a comprehensive characterisation of the remnant urinary vesicle fraction which is normally discarded after the final ultracentrifugation steps of currently used vesicle isolation protocols. The two-step differential centrifugation protocol represents the most widely used method to concentrate UEVs in a manageable volume [Citation2,Citation41–Citation45]. Alternative methods employing nanomembrane ultrafiltration concentrators [Citation46] and microfiltration devices [Citation47] have been proposed. However, they are less useful for wide use due to losses resulting in excessive adsorption of exosomes and soluble protein remaining on the surface of the filter membrane [Citation20,Citation48]. Thus, differential centrifugation has been considered the gold standard for UEV isolation. Nonetheless, it is not either fully satisfactory as the sedimentation efficiency and vesicle recovery in the pellet depends on several factors like rotor type (clearing factor or k factor), g force used, centrifugation time and viscosity of the solution [Citation25,Citation48]. Furthermore, vesicle recovery in the ultracentrifugation pellet is not complete and a variety of vesicle types, in various amounts, are still present in the supernatant [Citation25]. Extended centrifugation time, up to overnight runs, can be performed to increase the yield [Citation25] while strongly reducing practical usefulness when large numbers of samples need to be processed. In order to overcome some of the aforementioned problems we developed a completely new workflow to pre-enrich UEVs based on hybrid filtration–dialysis system which was named “hydrostatic filtration dialysis” (HFD) [Citation23]. This agrees also well with the latest reports in which ultrafiltration seems to outperform ultracentrifugation in terms of quality and quantity of the yield [Citation49,Citation50].
Here, after the HFD enrichment, UEVs were fractionated by the conventional two step differential centrifugation protocol. Supplemental confirms the results previously published [Citation23]. Vesicle markers like TSG101 and CD63 (R&D Systems antibody) were detected by WB in both pellets and in the final supernatant. This shows that a significant amount of vesicles are left in the conventional isolation protocol. Screening and relative quantification of different vesicle (exosome) markers (, , and Supplemental Figures S1, S5, S6, S7) confirmed that depending on the antibody and the antigen, 10–65% () of HFDa signal was recovered in the pellet of the first centrifugation (HFDa-P40). This could be explained with the high concentration ratio (>100 times) we obtained at the end of the enrichment starting from large volume of urine. Such high vesicle concentration favours aggregation and, consequently, the sedimentation of small and large vesicles in the same pellet as recently reported [Citation51]. However, exosomes start their sedimentation already at 33,000 g even under less concentrated solutions [Citation52]. Therefore, a discrete population of exosomes can be recovered already at low speed. Nonetheless, a fraction of vesicles positive for the same vesicle markers (, , and Supplemental Figures S1, S5, S6, S7) was also detected in the final supernatant. TEM () confirmed the presence of small vesicles (30–150 nm) with the typical cup-shaped morphology [Citation53] earlier considered as a specific feature of exosomes, it was clearly established it is a technical artefact introduced in the sample preparation [Citation54,Citation55]. However, it could be still considered an indicator of vesicles in TEM.
A more comprehensive protein profiling with MS showed that the bulk of our identifications matched very well with the datasets deposited in the Vesiclepedia, as shown in the Venn diagram ((A)). Gene Ontology analysis per cellular component ()) showed a higher ratio of matrix proteins like collagens or laminin or mucins for example as well as extravesicular components and soluble proteins like human serum albumin (HSA), α1-antitrypsin, α1-antichymotrypsin and, for example, immunoglobulin isotypes α and γ. Although their presence is well established and constantly confirmed even after a 1000 kDa MWCO dialysis step, their full role is yet to be defined.
Sample preparation for MS was designed with the aim of distinguishing the internal from external proteome. Unfortunately, the results were not conclusive. Most likely after reduction and alkylation of the external proteome and, particularly, during trypsinisation some vesicle types may lose their mechanical strength and release their content into solution to become substrates for trypsin. Protein hits like radixin, ezrin, stomatin, for example, in the “external” proteome indirectly support this interpretation. On the other hand, other protein identifications like phospholipid scramblase 1, keratins 31,16,9,14,6,5 and amiloride-sensitive amine oxidase were found exclusively in the “internal” proteome
The RNA characterisation of the HFDa fractions revealed that apparently no sRNA is carried by vesicles left in the HFDa-SN200 if not in minimal amounts below the detection limit of the fluorescent assay (Qubit) which gave a more reliable estimation of the concentration than the spectrophotometer-based measure (Nanodrop). The discrepancy between Nanodrop and The Qubit results especially in the quantification of HFDa-SN200 (see Supplemental Table S3) were initially thought to be due to presence of DNA as reported in apoptotic vesicles, microvesicles and exosomes [Citation56,57]. Qubit dsDNA quantification kit detected measurable amount of dsDNA in all the fractions. However, this was not able to completely explain the values obtained from the spectrophotometer especially for HFDa-SN200. The source of such overestimation remains unexplained. What we cannot rule out however is the potential presence of interfering molecules like urinary pigments which might be also responsible for the poor ratio of the optical densities 260/280 and 260/230 (Supplemental Table S3). Additionally, these readings seem to be strongly dependent on the extraction method with better values obtained for the phenol method, suggesting that a polar partitioning could limit the interference.
Relative quantification of seven established vesicle/exosomal markers in FLISA and WB showed that the UEVs in the final supernatant ranges from zero for flotilin 1 () and Supplemental Figure S7) up to 25% for CD9 (, and Supplemental Figures S4, S5) of the signal detected in HFDa. Although the WB quantification showed a major variability due to presence of protein complexes stabilised by disulfide bonds (, S5, S6, S7) it showed a good specificity of the antibody for the antigen checked in FLISA. Overall, it seems that the HFDa-SN200 preferentially contains CD9 positive vesicles. We could not find correlation between the varieties of markers tested. However, this result emphasises the importance to harvest all vesicle types in a more comprehensive way so as not to lose or vice versa enrich possibly fractions, including the ultracentrifugation supernatant, of distinct vesicle types and with potential important functions. Notably, various parallel and possibly overlapping pathways have been proposed for secretion of distinct vesicle classes and these can work either in synergy or independently. Moreover, the specificity of the vesicle markers used has recently been reconsidered and, thus, the precise vesicle pathways involved may need to be redefined (see reviews [Citation58–Citation60] for a more comprehensive discussion).
TRPS was used to estimate the PSD and number of particles present in each fraction. All the measures were performed with the same parameters: voltage, stretch of the membrane and pressure of 2, 4 and 6 mbar with the exception of HFDa-P200 for which we were able to test it only at pressure of 2 and 4 mbar. Unfortunately, at the pressure of 6 mbar the transmembrane current was unstable with an increase of the noise above 30 pA and repetitive blockage of the membrane resulting in an important drift in the particle rate. Therefore, it was discarded from the analysis while all the other particle counts gave a linear result without excessive drift of the particle rate (see Supplemental Figure S8). Interestingly, the PSD of the HFDa-SN200 was more similar to the HFDa-P40 rather than the HFDa-P200 () while the TEM pictures revealed a slightly smaller size. However, taking into account the MS results we cannot exclude that the adsorption of soluble and/or matrix proteins on the surface of vesicles along with oligomers of THP can give a higher PSD in TRPS than TEM even in presence of 0.05% of Triton X-100. The asymmetric shape of the distribution pattern with a particle diameter mode (most common particle diameter found) of 85 ± 12.1 nm and particle diameter mean (average particle diameter) was 167 nm (SD 52.1). As per the literature, HFDa-P200 contains an abundance of small vesicles whose molecular weight matches with the common definition of exosomes, 60–80 nm. Smaller vesicles could not be detected because we were at the limit of detection range of the membrane itself (NP150). On the other hand, in the HFDa-SN200 we found that particle diameter mode of 110 ± 3.2 nm and particle diameter mean of 132 nm (SD 22.6) while for HFDa-P40 particle diameter mode was 119 ± 8.0 nm and particle diameter mean was 173 nm (SD 55.5). Estimation of the particle number ()) remained quite elusive with a dramatic underestimation of the particle especially for HFDa which hampered the calculation of percentage of particles partitioned in the fractions generated by the differential centrifugation protocol as reported in . The 0.22 μm filtration adsorbed more material for HFDa which had the highest complexity in terms of vesicle types along with the presence of THP polymers. Moreover, even if urine is considered an ideal sample of vesicles without the interference of protein aggregates, lipoproteins and platelets [Citation61] if we consider the proteome composition of UEVs [Citation32], we cannot exclude that protein complexes like THP oligomers, lipoproteins, immunocomplexes, protein aggregate and hybrid vesicles-THP oligomers, lipoprotein, immunocomplex and other can be present as normal urinary constituent. This would represent an additional layer of interference in the particle counting.
Finally, exosome quantification by ExoTEST™ confirmed that HFDa-P200 is the elective fraction to harvest exosomes ()), and 14% of them are in HFDa-SN200 with a peculiar protein pattern enriched in CD9, while 19% of exosomes are recovered in HFDa-P40. Conversely in HFDa-P40 sediment the bulk of the vesicles present in HFDa ()) and this fraction tested positive (around 15% of HFDa, ) for all the markers tested in this study. We can therefore speculate that either discrete population of exosomes may be present in urine or, alternatively, discrete populations of vesicles carry markers belonging to the ESCRT machinery (TSG101 and Alix), Rab5, flotilin 1, DPP4, Neprilysin, tetraspanin, CD9, CD63 and CD81 coexist in the same fraction either in the same or different vesicle. Moreover in the HFDa-SN200 we found membrane particle markers like prominin-1 and -2 but not flotilin 1 (Supplemental , ) and Supplemental Figure S7). We recognise that a more accurate analysis of the protein content would help to understand the protein composition of this fraction. Unfortunately, Tamm–Horsfall glycoprotein is still a main interfering protein in the MS analysis and an easy way to remove it without losing vesicles is still needed.
In conclusion, from our results we estimate that around 25% of CD9 positive vesicles are left in the final supernatant of differential centrifugation and discarded. Traces of other markers were detected in the same fraction suggesting a characteristic composition of these vesicles which, interestingly do not seem to carry sRNA in detectable quantity. The TRPS analysis showed a PSD with a diameter mode of 110 nm. Unfortunately, we could not determine a satisfactory estimation of the particle number for technical reasons. In light of these results exosomes with distinct qualities can be found in the discarded supernatants. As a result, it is reasonable to speculate that potentially important vesicles, particularly for biomarker search may be lost. Thus, alternative robust, simple, highly efficient protocols like the HFD should be used preferentially to ensure maximised vesicle yield.
Competing financial interest
The authors declare no competing financial interests
34002-supplementary-table-3.xls
Download MS Excel (56 KB)34002-supplementary-table-2.xls
Download MS Excel (337 KB)34002-supplementary-table-1.xls
Download MS Excel (598.5 KB)34002-supplementary-figures.pdf
Download PDF (1 MB)Acknowledgements
This study was supported by ITN FP-7 Marie Curie European Union funded programmes “UroSense” (IAAP-GA-2011-286386), FP7-Health programme “KidneyConnect” (Grant number 602422), The EU/IMI programme BEAt-DKD (“Biomarkers for diabetic nephropathy” (Grant number 115974)) and the FRIAS programme of the Albert-Ludwigs University, Freiburg.
Disclosure statement
No potential conflict of interest was reported by the authors.
Supplementary material
Supplemental data for this article can be accessed here.
Additional information
Funding
Related Research Data
References
- Pisitkun T, Shen RF, Knepper MA. Identification and proteomic profiling of exosomes in human urine. Proc Natl Acad Sci USA. 2004;101:1–17. DOI:10.1073/pnas.0403453101
- Hogan MC, Manganelli L, Woollard JR, et al. Characterization of PKD protein-positive exosome-like vesicles. J Am Soc Nephrol. 2009;20:278–288. DOI:10.1681/ASN.2008060564
- Hara M, Yanagihara T, Hirayama Y, et al. Podocyte membrane vesicles in urine originate from tip vesiculation of podocyte microvilli. Hum Pathol. 2010;41:1265–1275. DOI:10.1016/j.humpath.2010.02.004
- Gonzales PA, Pisitkun T, Hoffert JD, et al. Large scale proteomics and phosphoproteomics of urinary exosomes. J Am Soc Nephrol. 2009;784(20):363–379. DOI:10.1681/ASN.2008040406
- Chen CL, Lai YF, Tang P, et al. Comparative and targeted proteomic analyses of urinary microparticles from bladder cancer and hernia patients. J Proteome Res. 2012;11:5611–5629. DOI:10.1021/pr3008732
- Principe S, Kim Y, Fontana S, et al. Identification of prostate-enriched proteins by in-depth proteomic analyses of expressed prostatic secretions in urine. J Proteome Res. 2012;11:2386–2396. DOI:10.1021/pr2011236
- Staubach S, Schadewald P, Wendel U, et al. Differential Glycomics of epithelial glycoproteins from urinary exovesicles reveals shift toward complex-type N-glycosylation in classical galactosemia. J Proteome Res. 2012;11:906–916. DOI:10.1021/pr200711w
- Gerlach JQ, Kruger A, Gallogly S, et al. Surface glycosylation profiles of urine extracellular vesicles. Plos One. 2013;8:e74801. DOI:10.1371/journal.pone.0074801
- Saraswat M, Joenvaara S, Musante L, et al. N-linked (N) glycoproteomics of urinary exosomes. Mol Cell Proteomics. 2015;14:263–276. DOI:10.1074/mcp.A114.040345
- Wang Z, Hill S, Luther JM, et al. Proteomic analysis of urine exosomes by multidimensional protein identification technology (MudPIT). Proteomics. 2012;12:329–338. DOI:10.1002/pmic.201100477
- Prunotto M, Farina A, Lane L, et al. Proteomic analysis of podocyte exosome-enriched fraction from normal human urine. J Proteomics. 2013;82:193–229. DOI:10.1016/j.jprot2013.01.012
- Zhou H, Cheruvanky A, Hu X, et al. Urinary exosomal transcription factors, a new class of biomarkers for renal disease. Kidney Int. 2008;74:613–621. DOI:10.38/ki.2008.206
- Cheng L, Sun X, Scicluna BJ, et al. Characterization and deep sequencing analysis of exosomal and non exosomal miRNA in human urine. Kidney Int. 2014;86:433–444. DOI:10.1038/ki.2013.502
- Miranda KC, Bond DT, Levin JZ, et al. Massively parallel sequencing of human urinary exosomes/microvesicles RNA reveals a predominance of non coding RNA. Plos One. 2014;9:e96094. DOI:10.1371/journal.pone.0096094
- Turturici G, Tinnirello R, Sconzo G, et al. Extracellular membrane vesicles as a mechanism of cell-to-cell communication: advantages and disadvantages. Am J Physiol Cell Physiol. 2014;306:C621–33. DOI:10.1152/ajpcell.00228.2013
- Quesenberry PJ, Aliotta J, Deregibus MC, et al. Role of extracellular RNA-carrying vesicles in cell differentiation and reprogramming. Stem Cell Res Ther. 2015;6:153. DOI:10.1186/s13287-015-0150-x
- Street JM, Birkhoff W, Menzies RI, et al. Exosomal transmission of functional aquaporin 2 in kidney cortical collecting duct cells. J Physiol. 2011;589:6119–6127. DOI:10.1113/jphysiol.2011.220277
- Gildea JJ, Seaton JE, Victor KG, et al. Exosomal transfer from human renal proximal tubule cells to distal tubule and collecting duct. Clin Biochem. 2014;47:89–94. DOI:10.1016/j.clinbiochem.2014.06.018
- Wang D, Sun W. Urinary extracellular microvesicles: isolation methods and prospects for urinary proteome. Proteomics. 2014;14:1922–1932. DOI:10.1002/pmic.201300371
- Alvarez ML, Khosroheidari M, Kanchi Ravi R, et al. Comparison of protein, microRNA, and mRNA yields using different methods of urinary exosome isolation for the discovery of kidney disease biomarkers. Kidney Int. 2012;82:1024–1032. DOI:10.138/ki.2012.256
- Pitto M, Corbetta S, Raimondo F. Preparation of urinary exosomes: methodological issues for clinical proteomics. Methods Mol Biol. 2015;1243:43–53. DOI:10.1007/978-1-4939-1872-0_3.
- Musante L, Saraswat M, Ravidà A, et al. Recovery of urinary nanovesicles from ultracentrifugation supernatants. Nephrol Dial Transplant. 2013;28:1425–1433. DOI:10.1093/ndt/gfs564
- Musante L, Tataruch D, Gu D, et al. A simplified method to recover urinary vesicles for clinical applications, and sample banking. Scientific Reports. 2014;4:7532. DOI:10.1038/srep07532
- Tataruch-Weinert D, Musante L, Kretz O, et al. Urinary extracellular vesicles for RNA extraction: optimization of a protocol devoid of prokaryote contamination. J Extracellular Vesicles. 2016;5:30281. DOI:10.3402/jev.v5.30281
- Cvjetkovic A, Lotvall J, Lasser C. The influence of rotor type and centrifugation time on the yield and purity of extracellular vesicles. J Extracellular Vesicles. 2014;25:3. DOI:10.3402/jev.v3.23111
- Bradford MM. A rapid and sensitive method for the quantitation of microgram quantities of protein utilizing the principle of protein-dye binding. Anal Biochem. 1976;72:248–254. DOI:10.1016/0003-2697(76)90527-3
- Laemmli UK. Cleavage of structural proteins during the assembly of the head of bacteriophage T4. Nature. 1970;227:680–685.
- Candiano G, Bruschi M, Musante L, et al. Blue silver: a very sensitive colloidal coomassie G-250 staining for proteome analysis. Electrophoresis. 2004;25:1327–1333. DOI:10.1002/elps.200305844
- Towbin H, Staehelin T, Gordon J. Electrophoretic transfer of proteins from polyacrylamide gels to nitrocellulose sheets - procedure and some applications. Proc Natl Acad Sci USA. 1979;76:4350–4354.
- Samelson LE. Diagonal gel electrophoresis. Curr Protoc Immunol. 2001;8:8.6. DOI:10.1002/0471142735.im0806s02
- Liu X, Chinello C, Musante L, et al. Intraluminal proteome and peptidome of human urinary extracellular vesicles. Proteomics Clin Appl. 2014;9:568–573. DOI:10.1002/prca.201400085
- Kalra H, Simpson RJ, Ji H, et al. Vesiclepedia: A compendium for extracellular vesicles with continuous community annotation. Plos Biol. 2012;10:e1001450. DOI:10.1371/journal.pbio.1001450
- Higuchi T, Orita T, Nakanishi S, et al. Molecular cloning, genomic structure, and expression analysis of MUC20, a novel mucin protein, up-regulated in injured kidney. J Biol Chem. 2004;279:1968–1979. DOI:10.1074/jbc.M304558200
- Bruno S, Grange C, Deregibus MC, et al. Mesenchymal stem cell-derived microvesicles protect against acute tubular injury. J Am Soc Nephrol. 2009;20:1053–1067. DOI:10.1681/ASN.2008070798
- Mi H, Poudel S, Muruganujan A, et al. PANTHER version 10: expanded protein families and functions, and analysis tools. Nucleic Acids Res. 2016;44:D336–42. DOI:10.1093/nar/gkv1194
- Engering A, Kuhn L, Fluitsma D, et al. Differential post-translational modification of CD63 molecules during maturation of human dendritic cells. Eur J Biochem. 2003;270:2412–2420. DOI:10.1046/j.1432-1033.2003.03609.x
- Smith JZ, Lee C, Rojalin T, et al. Single Exosome study reveals subpopulations distributed cell lines with variability. J Extracell Vesicles. 2015;4:28533. DOI:10.3402/jev.v4.28533
- Amit I, Yakir L, Katz M, et al. Tal, a Tsg101-specific E3 ubiqutin ligase, regulates receptor endocytosis and retrovirus budding. Genes Dev. 2004;18:1737–1752. DOI:10.1101/gad.294904
- Channavajjhala SK, Rossato M, Morandini F, et al. Optimizing the purification and analysis of miRNAs from urinary exosomes. Clin Chem Lab. 2014;52:345–354. DOI:10.1515/cclm-2013-0562
- Barutta F, Tricarico M, Corbelli A, et al. Urinary exosomal microRNAs in incipient diabetic nephropathy. Plos One. 2013;8:e73798. DOI:10.1371/journal.pone.0073798
- Fernandez-Llama P, Khositseth S, Gonzalez PA, et al. Tamm-Horsfall protein and urinary exosome isolation. Kidney Int. 2010;77:736–742. DOI:10.1038/ki.2009.550
- Mitchell PJ, Welton J, Staffurth J, et al. Can urinary exosomes act as treatment response markers in prostate cancer? J Transl Med. 2009;7:4. DOI:10.1186/1479-5876-7-4
- Raj DA, Fiume I, Capasso G, et al. A multiplex quantitative proteomics strategy forprotein biomarker studies in urinary exosomes. Kidney Int. 2012;81:1263–1272. DOI:10.1038/ki.2012.25
- Hogan MC, Johnson KL, Zenka RM, et al. Subfractionation, characterization and in-depth proteomic analysis of glomerular membrane vesicles in human urine. Kideny Int. 2014;85:1225–1237. DOI:10.1038/ki.2013.422
- Rood IM, Deegens JK, Merchant ML, et al. Comparison of three methods for isolation of urinary microvesicles to identify biomarkers of nephrotic syndrome. Kidney Int. 2010;78:810–816. DOI:10.1038/ki.2010.26
- Cheruvanky A, Zhou H, Pisitkun T, et al. Rapid isolation of urinary exosomal biomarkers using a nanomembrane ultrafiltration concentrator. Am J Physiol Renal Physiol. 2007;292:1657–1661. DOI:10.1152/ajprenal.00434.2006
- Merchant ML, Powell DW, Wikey DW, et al. Microfiltration isolation of human urinary exosomes for characterization by MS. Proteomics Clin Appl. 2010;4:84–96. DOI:10.1002/prca.200800093
- Momen-Heravi F, Balaj L, Alian S, et al. Impact of biofluid viscosity on size and sedimentation efficiency of the isolated microvesicles. Front Physiol. 2012;3:162–167. DOI:10.3389/fphys.2012.00162
- Lobb RJ, Becker M, Wen SW, et al. Optimized exosome isolation protocol for cell culture supernatant and human plasma. J Extracell Vesicles. 2015;4:27031. DOI:10.3402/jev.v4.27031
- Heinemann ML, Ilmer M, Silva LP, et al. Benchtop isolation and characterization of functional exosomes by sequential filtration. J Chromatogr A. 2014;1371:125–135. DOI:10.1016/j.chroma.2014.10.026
- Linares R, Tan S, Gounou C, et al. High-speed centrifugation induces aggregation of extracellular vesicles. J Extracell Vesicles. 2015;4:29509. DOI:10.3402/jev.v4.29509
- Jeppesen DK, Hvam ML, Primdahl-Bengtson B, et al. Comparative analysis of discrete exosome fractions obtained by differential centrifugation. J Extracell Vesicles. 2014;3:25011. DOI:10.3402/jev.v3.25011
- Knepper MA, Pisitkun T. Exosomes in urine: who would have thought…? Kidney Int. 2007;72:1043–1045. DOI:10.1038/sj.ki.5002510
- Théry C, Amigorena S, Raposo G, et al. Isolation and characterization of exosomes from cell culture supernatants and biological fluids. Curr Protoc Cell Biol. 2006;3:3.22. DOI:10.1002/0471143030.cb0322s30
- Yuana Y, Koning RI, Kuil ME, et al. Cryo-electron microscopy of extracellular vesicles in fresh plasma. J Extracell Vesicles. 2013;2. DOI:10.3402/jev.v2i0.21494.
- Lazaro-Ibanez E, Sanz-Garcia A, Visakorpi T, et al. Different gDNA content in the subpopulations of prostate cancer extracellular vesicles: apoptotic bodies, microvesicles, and exosomes. Prostate. 2014;74:1379–1390. DOI:10.1002/pros.22853
- Yáanez-Mó M, Siljander PR, Andreu Z, et al. Biological properties of extracellular vesicles and their physiological functions. J Extracell Vesicles. 2015;4:27066. DOI:10.3402/jev.v4.27066
- Colombo M, Raposo G, Théry C. Biogenesis, secretion, and intercellular interactions of exosomes and other extracellular vesicles. Annu Rev Cell Dev Biol. 2014;30:255–289. DOI:10.1146/annurev-cellbio-101512-122326
- Hurley JH. ESCRTs are everywhere. Embo J. 2015;34:2398–2407. DOI:10.15252/embj.201592484
- Andreu Z, Yáñez-Mó M. Tetraspanins in extracellular vesicle formation and function. Front Immunol. 2014;5:442. DOI:10.3389/fimmu.2014.00442
- Coumans FA, Van Der Pol E, Boing AN, et al. Reproducible extracellular vesicles size and concentration determination with tunable resistive pulse sensing. J Extracell Vesicles. 2014;3:25922. DOI:10.3402/jev.v3.25922