
ABSTRACT
Extracellular vesicles have been described in non-paracrine cellular interactions in cancer. We report a similar phenomenon in B-cell precursor (BCP) acute lymphoblastic leukaemia (ALL). Using advanced microscopy and high throughput screening, we further characterise a subset of large vesicles (LEVs) identified in cell lines, murine models of human BCP-ALL and clinical samples. Primary ALL blasts and cell lines released heterogeneous anucleate vesicles <6 micron into extracellular fluids. Larger LEVs were enclosed in continuous membranes, contained intact organelles and demonstrated an organised cytoskeleton. An excess of circulating CD19-positive LEVs were observed in diagnostic samples and isolated from mice engrafted with BCP-ALL primary cells. LEVs exhibited dynamic shape change in vitro and were internalised by other leukaemic cell lines leading to phenotypic transformation analogous to the cell of origin. In patient-derived xenografts, LEVs were released by primary ALL cells into extracellular spaces and internalised by murine mesenchymal cells in vivo. Collectively these data highlight the heterogeneity but accessibility of LEVs in clinical samples and their potential to provide a unique insight into the biology of the cell of origin and to their development as novel biomarkers to aid diagnosis and improve therapeutic outcomes.
Responsible Editor Clotilde Thery, Institut Curie. Pavillon Pasteur, Paris, France
Introduction
Along with direct contact and soluble factors, intercellular interactions through extracellular vesicles are increasingly recognised as modes of local as well distal intercellular communication. Vesicles show considerable heterogeneity of size and cargo and are classified into three types based on their biogenesis.[Citation1] Exosomes (30–150 nm) are derived from intraluminal multivesicular bodies of endosomal origin and released by exocytosis; extracellular vesicles (EVs) are budded from the plasma membrane and generally 100–1000 nm in size;[Citation2] apoptotic bodies (AB) are formed by cells undergoing apoptosis and are reported to be >1 µm in size.[Citation3,Citation4] Larger EVs or oncosomes [Citation5] (<10 µm) have also been reported to be a product of non-apoptotic cell membrane blebbing in prostate cancer cell lines.[Citation6] We recently reported that EVs are released by B-cell precursor (BCP) acute lymphoblastic leukaemia (ALL) cells in vitro and in vivo.[Citation7] Mechanistically, internalisation of leukaemic EVs (LEVs) by stromal cells resulted in a metabolic shift from oxidative phosphorylation to aerobic glycolysis, potentially facilitating leukaemic cell survival.
Applying comprehensive advanced imaging techniques, to enable visual assessment and high-throughput quantification of size and parent cell marker expression, we have further characterised LEVs using cell lines, patient derived xenograft (PDX) models and samples obtained from patients with ALL.
Patients and methods
Cells and cell lines
Bone marrow samples were obtained from children with ALL on treatment after consent, fractionated into plasma and mononuclear fractions and stored. Human bone marrow endothelial cells (BMEC) or mesenchymal stem cells (hMSCs) were derived from bone marrow biopsies as previously described.[Citation8] See Supplemental Table S1 for cell lines used. BCP-ALL cell lines were lentivirally or retrovirally engineered to express fluorescent proteins. The studies were approved by Tameside and Glossop (Manchester, UK; Reference 07/Q1402/56) research ethics committee.
Vesicle isolation from cell lines
ALL cells were washed with PBS and seeded in serum free RPMI at a density of 3.3 × 10⁶–1 × 10⁷ cells ml–1 for 24 h prior to isolation of LEVs to eliminate bovine vesicle contamination. Cell viability was checked using trypan blue exclusion assay and only cultures with >97% viability were used. Isolation of large EVs was optimised to ensure protection of the intact membrane and preservation of morphology and phenotype. Depending on the downstream experiment, vesicles were isolated by a combination of filtration and differential centrifugation as follows: cells were centrifuged twice at 200 × g for 5 min followed by filtration using a double layered, sterile 5 µm pore cell sieve (BioDesign, New York, NY, USA) (Figure S3). Supernatant was centrifuged at 2000 × g 20 minutes, and the supernatant collected for sequential centrifugation at 10,000 × g for 30 minutes followed by 100,000 × g for 2 h to collect exosomes. Downstream methods for analysing large LEVs which were found in the 2000 × g fraction were optimised to enable further exclusion of cell debris by visual inspection and stringent gating strategies (see supplemental methods). Human ALL cells and LEVs were retrieved from the spleens of mice using anti-human CD19 immunocapture and visualised by transmission electron microscopy (TEM).
Imaging flow cytometry analysis of LEVs in clinical samples
The BCP-ALL cell line NALM-6 expresses the B cell marker CD19 and was used to explore parent cell marker expression on LEVs. LEVs were isolated as described and analysed for CD19 expression using the imaging flow cytometer (Mark II Image Stream, Amnis, Seattle, WA, USA). Data were acquired from channels 1 (bright field), 2 (488 nm), 3 (651 nm) and 12 (785 nm side scatter). Specific gating strategies applied to the imaging flow cytometry acquisitions disregarded cell debris from further analysis (see Supplemental Figure 1(b)). Objects were designated vesicles using the following gating strategy: speed beads removed, diameter mask applied using the bright field image in channel 1, size <6 µm, aspect ratio of >0.4 (to exclude debris) and only focused events were considered. Using INSPIRE software (INSPIRE version 200.1.388.0., Amnis, USA) 10,000 events were acquired and the data merged and analysed using IDEAS software (Amnis). NALM-6 vesicles were spiked into healthy plasma to establish compensation matrices for dual labelled imaging flow cytometry on clinical samples. Anti-human CD19 PE_Cy7 and anti-human CD61 FITC antibodies were used to detect human CD19+ LEVs and platelets respectively. The analysis template was applied to vesicles detected in patient plasma where 5 × 200,000 events were acquired using × 60 magnification and extended depth of field.
Detection of LEVs in ALL patient plasma
During initial fractionation of the bone marrow aspirate, an amended protocol was used to maximise subsequent LEV retrieval from bone marrow plasma including slower speed centrifugation at 200 × g 10 min. To ensure acquisition of the maximum number of events using imaging flow cytometry, patient-derived plasma was used undiluted during the labelling protocol. To eliminate non-specific binding, plasma samples were treated with Human Fc block (BD Biosciences Cat: 564219, San Jose, CA) for 5 min prior to the addition of anti-human CD19 PE_CY7 (Clone H1B19, Biolegend Cat: 302216) and anti-human CD61 FITC (Clone VI-PL2, Biolegend Cat: 336404) antibodies, which had been purified by affinity chromatography to remove unlabelled antibody and unconjugated label, to eliminate non-specific binding. The entire plasma fraction was analysed by imaging flow cytometry using the stringent gating strategies described.
Chemicals, reagents and antibodies
See Supplemental Methods and Table S2.
Immunofluorescence microscopy
Viable cultures containing ALL cells and LEVs were immobilised onto CellTak coated glass coverslips, fixed with 3.7% paraformaldehyde probed using antibodies as detailed and imaged as described. LAMP1 and Talin: Super resolution microscopy was performed using a gSTED (gated Stimulated Emission Depleted) Leica TCS SP8 confocal microscope (Leica Biosystems, Wetzler, Germany) equipped with x63, NA1.4 oil lens, PMT and Hybrid (HyD) detectors, and with white laser (470–670 nm) and 405 UV laser. The software used was LAS X (Leica). Vinculin and time lapse images were captured using a Zeiss Axiovert 200 M microscope (Call Zeiss AG, Jena, Germany) fitted with a Zeiss_Plan-Fluor 0.5 numerical aperture connected to an Andor iXon DU888+ (Andor, Belfast, Northern Ireland) low light black and white camera. Illumination by UV light source was filtered using the SEDAT wheel filter set with appropriate wavelengths. The imaging system and image composites were achieved using Metamorph software (Molecular Devices, Sunnyvale, CA, USA).
Transmission electron microscopy (TEM)
Images were captured using a Biotwin Philips TECNAI G2 transmission electron microscope (FEI Tecnai G2 T12 Biotwin microscope, Hillsboro, Oregon, US).
Time-lapse microscopy
BMECs (dsRED) and GFP expressing SD1 cells were co-cultured in fibronectin-coated glass bottomed plates (IWAKI, Shizuoka, Japan). Images were captured at 5-min intervals using bright field and UV sourced light filtered by the appropriate SEDAT filter using Metamorph software and videos created using ImageJ (MacBiophotonics [Citation9]).
Vesicle uptake
LEVs isolated from serum-free 24-h SD1 cell cultures (2000 × g fraction) were labelled with Dio C 18 lipophilic tracer (Life Technologies, Carlsbad, CA, USA; Cat: D275) at a concentration of 1 µg ml–1 for 30 min at 37°C. Labelled LEVs were washed for 10 min with inversion using 4 × volume of PBS and centrifuged at 2000 × g 20 min. The pellet was resuspended in 500 µl serum-free RPMI and added to ALL cell lines SupB15, REH or TOM1 cells, or the normal lymphoblastoid cell line HRC57, seeded onto fibronectin coated glass bottomed plates and incubated at 37°C for 24 h. Cells were washed with PBS, fixed with 3.7% paraformaldehyde and counterstained with either Cell Mask orange or Alexa-fluor 555 phalloidin and mounted using Prolong DAPI mountant and imaged as described.
Imaging-flow cytometry analysis of SD1 cells
AEP activity binding probe was analysed with an imaging flow cytometer (Image stream, Amnis).
Patient derived human leukaemia xenograft
All animal procedures were approved by the Cancer Research UK, Manchester Institute’s Animal Welfare and Ethical Review Body (AWERB) and performed under a Project License issued by the UK Home Office, in keeping with the Home Office Animal Scientific Procedures Act, 1986. Six- to 12-week-old NOD.Cg-Prkdcscid Il2rgtm1Wjl/SzJ (NSG) mice were transplanted intrafemorally or intravenously with 1 × 10⁶ ALL cell lines lentiviral transduced to express luciferase and GFP (NALM6) or mCherry (SupB15). Bone marrow was flushed with PBS and resulting cells seeded in vitro onto fibronectin-coated glass bottomed plates for fluorescence microscopy.
Results
BCP-ALL cells produce extracellular vesicles which are quantifiable in clinical samples
When grown under optimal conditions (>97% cell viability) ALL and lymphoblastoid cell lines released sub-cellular vesicles in cell culture media visible using light microscopy (Supplemental )). Previously using fluorescence microscopy of cytospin preparations, we identified LAMP1 positive discrete vesicular compartments localised to the periphery of the BCP-ALL cell line SD1.[Citation10] Using a highly specific asparagine endopeptidase (AEP) activity binding probe (ABP),[Citation11] we demonstrated that the compartment contained the active form of the lysosomal cysteine protease AEP. The AEP-ABP was used here to visualise SD1 cells and EVs in suspension, using imaging flow cytometry. Vesicles ranging from 2.5–5 µm distinct from but tethered to SD1 parent cells were identified ()) along with EVs in suspension ()); a proportion of which were positive for the active form of the AEP indicated by red fluorescence. We recently reported that BCP-ALL cells produce LEVs expressing the B cell surface marker CD19.[Citation7] Using the gating strategy described we found that whilst 97.9% NALM6 cells (BCP-ALL cell line) were positive for CD19 by imaging flow cytometry, only ~35% of the LEVs produced over 24 h expressed this membrane marker ()).
Figure 1. LEVs are detected by imaging flow cytometry and distinguishable from platelets in clinical samples. (a) LEVs tethered to the parent SD1 cell were observed using imaging flow cytometry. SD1 cells cultured in serum-free RPMI for 24 h were incubated with an AEP activity binding-probe which fluoresces red on cleavage by active AEP a lysosomal cysteine protease. Fluorescence and brightfield images were acquired enabling visualisation of red fluorescence from cleaved ABP (emission 555 nm) localised to the extracellular vesicle. Scale bar is 10 µm. (b) LEVs of varying sizes (2–5.5 µm) were also observed in suspension in healthy SD1 cultures (>97% viability). Cells were probed with an AEP activity-binding probe as before. (c) NALM6 LEVs express the BCP marker CD19. CD19 expression was detected by imaging flow cytometry (Amnis Imagestream) in cells (left panel) and a proportion of LEVs (right panel) released into serum free RPMI over 24 h. FCS files were used to compare expression levels in the two populations using FlowJo. Plots showed more uniform LEV CD19+ mean fluorescence intensity (yellow) in the parent cells (97.9%) compared with LEVs (35%). Unstained (red) and isotype control (blue) are also shown. (d) Imaging flow cytometry distinguished NALM6 LEVs from platelets. LEVs were spiked into normal human plasma. CD61 was used to distinguish platelets from CD19 positive LEVs. Examples of the brightfield images captured at × 60 magnification with an extended depth of field, diameter mask applied for quantification and FITC and PE_Cy7 channels are shown. Scale bar represents 7 µm. A compensation matrix for dual labelling was created from these data for subsequent experiments. (e) CD19+ LEVs are present in bone marrow plasma from three BCP-ALL patients at diagnosis. Imaging flow cytometry identified CD19 PE_Cy7 (magenta) and CD61 FITC (green) positive vesicles in dual labelled bone marrow plasma samples. Dual labelling enabled distinction between LEVs and platelets in clinical samples. (Upper panel) Box-plot representation of size of vesicles detected. Box for each category represents the interquartile range of values with whiskers at 1 and 99 percentiles. Horizontal line and plus symbol denote median and mean respectively; outlier values are represented by stacked dots. Although a similar size range was detected, LEV (CD19+) size distribution was more heterogeneous compared with that of EVs which were present in the same sample and positive for the platelet marker CD61 (upper panel). (Lower panel) Histograms show the normalised frequency of diameter (µm) for comparison.
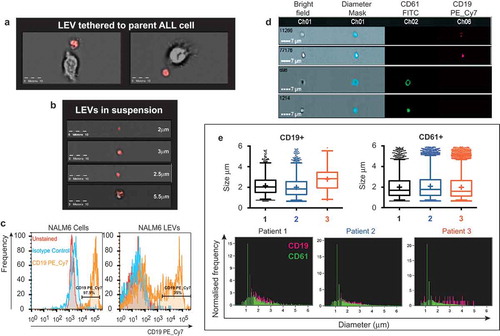
Heterogeneity in vesicle size led us to investigate the possibility of LEV aggregation. Imaging flow cytometry (Image Stream X Mark II, Amnis) allowed both quantification and visualisation of each event that passed through the flow cell.[Citation12] NALM6 LEVs were spiked into normal human plasma to enable optimisation of a sensitive screening method. CD19 PE_Cy7 (magenta) and CD61 FITC (green) were used to distinguish between LEVs and platelet derived microparticles that express CD61 ()). This method established a compensation matrix and gating strategy (Supplemental )) used to interrogate bone marrow plasma taken at diagnosis from three ALL patients. The smallest vesicle detected with confidence using this method was 362 nm. ) demonstrates that CD19+ LEVs (upper left) and CD61+ microparticles (upper right) span a similar size range of up 5.9 µm. The size distribution for CD61+ population was comparable across all three patient samples with a median of 1.6, 1.68 and 1.76 µm respectively (upper right). By contrast, the size range of CD19+ LEVs was more heterogeneous with a median of 2.02, 1.84 and 2.84 µm respectively (upper left). The lower panel shows the frequency of CD19+ (magenta) and CD61+ (green) events detected concurrently using dual labelling. Any events where dual positive labelling was detected were visually inspected and found to be as a result of platelet adherence to an LEV (Supplemental )). Imaging flow cytometry provided quantification of LEV number, analysis of size distribution and identity of cell of origin. As reported previously in a normal donor population,[Citation12] distinction from similar-size particles in clinical samples was achieved without the need for filtration.[Citation13]
Transmission electron microscopy (TEM) reveals heterogeneity of LEVs
Different techniques for vesicle isolation for subsequent analyses using transmission electron microscopy (TEM) were explored.[Citation2] There were considerable variations in quality, preservation and content of vesicles prepared using these different methods. TEM performed on fixed pellets derived from sequential centrifugation and ultracentrifugation of SD1 cell culture media revealed heterogeneous, membrane-bound vesicles ranging from 50 nm to 5.7 µm in size (Supplemental )). Similar subcellular vesicles were identified from REH and HRC57 cell lines (Supplemental )). However, this method resulted in distortion and rupture of larger vesicles, leading to difficulties distinguishing between intercellular/vesicular contents and bone fide vesicles. To avoid this, cell culture supernatants from healthy SD1 cultures were filtered through double layered 5 µm pore cell sieves after low speed centrifugation, seeded onto flexible ACLAR film pre-coated with CellTak, and processed for TEM by transverse sectioning. Vesicles of different sizes, adherent to the substrate were identified. Intact cellular organelles including mitochondria, lysosomes, Golgi and intermediate filaments, but no nucleus/chromatin condensation products were identified within the outer membrane of the large vesicles (, 2(b)).
Figure 2. Cell line and primary ALL cell derived LEVs contain intact organelles. (a, b) Transmission electron microscopy (TEM) of cell-depleted, viable SD1 cell culture supernatant, revealed large vesicles. Serum free supernatants from 24-h cultures of SD1 cells were cell depleted by centrifugation (300 × g, twice) and filtered through a double layered, sterile 5 µm pore micro sieve. Low speed centrifugation (2000 × g) of the filtrate provided a population of larger vesicles which were immobilised onto CellTak coated ACLAR film. Samples were processed for TEM by fixation in glutaraldehyde and then incubated with osmium tetroxide and uranyl acetate. Preparations were dehydrated and embedded in resin and sectioned. Images were captured using a Biotwin Philips TECNAI G2 electron microscope. LEVs (4–5 µm) with intact membranes were observed to contain multiple organelles including lysosomes, mitochondria and intermediate filaments but no nucleus. Images were captured at 2900 × magnification. Scale bar is 1 µm. (c) Human LEVs were isolated from patient derived ALL xenografts using human CD19 immunocapture. Engrafted human ALL cells and LEVs were harvested from the spleens of NSG mice by immuno-capture using a magnetic bead conjugated anti-human CD19 antibody. Eluates were seeded onto CellTak coated ACLAR film and processed as in (a). The figure represents one of serial sections taken through the LEV and neighbouring cell and shows the LEV to have an intact membrane, organelles and distinct cytoplasmic protrusions, but no nucleus. (d) Representative serial sections through CD19 captured ALL cells and LEVs confirmed the size and absence of a nucleus. Serial sections showed the LEV had an intact membrane, cytoplasmic protrusions, mitochondria and no nucleus and is ~4.2 µm in size. Sections shown represent ~1 µm: Initial section shown is 200 nm thick followed by 11 sections at 80 nm.
To demonstrate that these LEVs were not solely an in vitro phenomenon, CD19+ primary ALL cells were engrafted into NSG mice following intrafemoral injection. Nineteen days later, xenografted mice were culled and LEVs isolated from harvested spleens by immunocapture using a human CD19 antibody. Eluted cells and LEVs were plated onto CellTak-coated ACLAR film and processed for TEM. Both cells and LEVs adhered to substrate. Transverse sections revealed the clear presence of a nucleus in the parent ALL cell, whilst mitochondria were identified in both the cell and LEV ()). Serial sections demonstrated that the LEV was 4.6 × 4 × 5.7 µm in size taking into account major membrane protrusions, with an intact membrane and mitochondria but anucleate ()). These LEVs displayed an intact but irregular outer membrane with cytoplasmic protrusions analogous to the parent cells when attached to this substrate.
LEVs have an organised cytoskeleton, contain the lysosome marker LAMP1 and are dynamically active
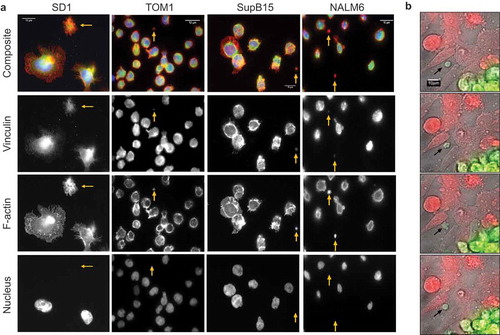
Visualised following immobilisation onto CellTak coated glass coverslips SD1, TOM1, NALM6 and SupB15 cells produce large LEVs (<5 µm). Consistent with the TEM findings, LEVs from BCP-ALL cell lines were positive for the lysosome marker LAMP1 ()). LEVs are distinct from parent cells and demonstrate cytoskeletal structures including actin-rich filopodia (filamentous actin labelled with Alexa Fluor (555) Phalloidin; )) and were anucleate (DAPI-negative). Membrane blebs occur both in apoptotic and migratory cells.[Citation14] The development of membrane blebs requires re-organisation of the cortical cytoskeleton with recruitment of ezrin-radixin-myoesin (ERM) family of proteins into the bleb and then stabilisation by the polymerisation of actin.[Citation15] We have previously reported the presence of ERM proteins as well as proteins involved in vesicle formation on the plasma membrane of SD1 cells.[Citation16] Investigating other cytoskeletal components of LEVs showed that LEVs from BCP-ALL cell lines SD1, TOM1, SupB15 and NALM6 expressed filamentous actin, and the cytoskeletal protein talin indicating the formation of focal adhesions at the basal layer (). ALL cell derived LEVs also expressed the cytoskeletal adapter protein vinculin ()). Talin, vinculin and ERM proteins cooperate with the linking of actin filaments to the cytoskeleton, an activity regulated by the phospholipid PtdIns(4,5)P2, suggesting that the formation of LEVs is an active process.[Citation17,Citation18] This idea was supported by examining co-cultures of SD1GFP cells and dsRED expressing bone marrow endothelial cells (BMECdsRED); where GFP positive LEVs (LEVGFP) were observed in the extracellular space ()). Large (<6 µm) SD1 LEVs exhibited independent, dynamic shape-change and spontaneous movement (Supplemental Video 1 hosted at ftp://ftp.picr.man.ac.uk/ftpdata/).
Figure 3. Large LEVs have an organised cytoskeleton and contain the lysosome marker LAMP1. (a) LEVs contain polymerised, filamentous actin and expressed LAMP1. SD1, TOM1, SupB15 and NALM6 ALL cell cultures immobilised on glass coverslips were fixed and probed for the lysosomal protein LAMP1 (green; second row). Filamentous actin was labelled using Alexa Fluor 555 phalloidin (red: third row) and DAPI labelled the cell nucleus (blue – bottom row) whilst LEVs were negative for DAPI. Images were captured using the Leica gSTED super resolution fluorescence microscope. Each cell preparation revealed parent cells and LEVs of varying sizes. Gold arrows indicate LEVs and scale bars are 10 µm. (b) Region of interest as indicated by the gold box highlights the SD1 cell-derived LEV which demonstrates distinct f-actin rich filopodia analogous to the parent cell.
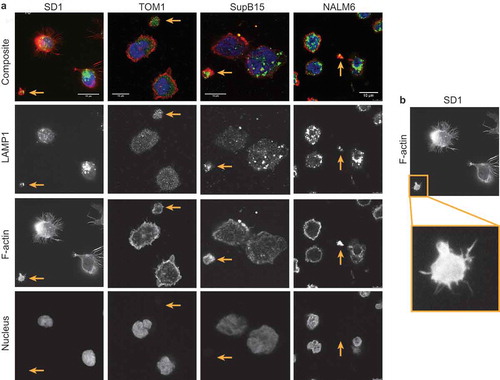
Figure 4. LEVs express talin at focal adhesion sites. SD1, TOM1, Sup15 and NALM6 cells alongside LEVs (gold arrows) were fixed as described and probed for Talin. Images were captured using the Leica gSTED super resolution fluorescence microscope. LEVs were found to be expressing talin at the basal layer, indicating focal adhesion formation on the CellTak (green: second row), contain filamentous actin (red: third row) and were DAPI negative (blue: bottom row).
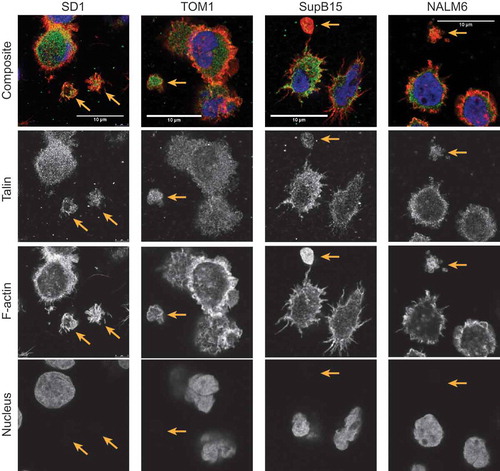
Figure 5. LEVs express the cytoskeletal adapter protein vinculin and are dynamically active. BCP-ALL cell lines release actin-rich LEVs into the extracellular space. SD1, TOM1, SupB15 and NALM6 cultures were seeded onto coated coverslips and probed for vinculin followed by Alexa Fluor 488 (green) conjugated anti-mouse antibody and counter-labelled for actin and nucleus. Images were captured using a Zeiss Axiovert 200 M microscope fitted with a Zeiss Plan-Fluor 0.5 numerical aperture (NA) connected to an Andor iXon DU888+ black and white camera. Illumination by UV light source was filtered using the SEDAT wheel filter set. The imaging system and image composites were created using Metamorph software (Molecular Devices). Scale bar represents 10 µm. (b) Stills from time-lapse microscopy demonstrate morphological change dsRED+ transduced BMECs were plated onto fibronectin coated glass bottomed plates at ~80% confluence. GFP+ SD1 cells were added and images captured at 5 min intervals over 5 h at × 40 magnification. A low light system was used comprising a Zeiss microscope (as before) encased in an environmentally controlled chamber maintained at 37°C and 5% CO2. The figure shows four sequential frames taken from the time lapse representing 15 min in real time. A large GFP+ LEV can clearly be seen (black arrow) to change morphology over time. This is best appreciated from the time-lapse video (Supplemental Video 1).
LEVs are internalised by other cells
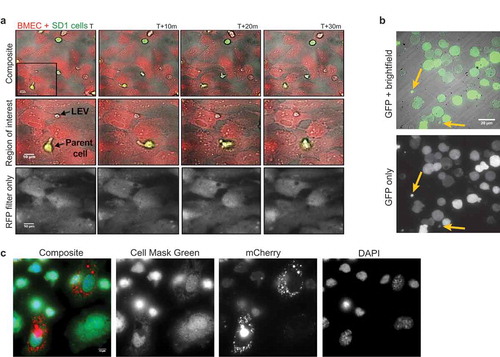
In the co-culture experiments described above, SD1GFP cells were observed to make transient adhesions to BMECs and release LEVGFP by budding in vitro () for stills and best appreciated in Supplemental Video 2). Neighbouring endothelial cells appeared to engulf the released LEVs. To investigate this process in vivo, NALM6GFP cells were engrafted intravenously into NSG mice. Both parent NALM6GFP cells and GFP+ LEVs were observed in samples obtained from bone marrow flushes taken 19 days after engraftment, demonstrating LEV production within the in vivo bone marrow microenvironment ()). Although we were able to detect GFP+ LEVs in the extracellular space, we found that GFP (and indeed the green fluorescence marker PKH67, data not shown) was too weak to track LEV uptake by murine BMSCs. Therefore, SupB15mCherry cells were transplanted intrafemorally into NSG mice to further investigate LEV production and uptake in vivo. Bone marrow flushes were fixed and counterstained with a fluorescent cell mask to allow morphological distinction. SupB15mCherry cells (not shown) and mBMSCs with internalised LEVmCherry were present along with LEVmCherry negative mBMSCs ()). We previously showed that PKH26 labelled, isolated SD1 cell LEVs were internalised by murine BMSCs in vivo. A similar punctate, peri-nuclear localisation was observed when LEVs alone were administered.[Citation7] These data demonstrate that ALL cells produce LEVs within the bone marrow microenvironment, contain parent cell cytoplasm and are internalised by stromal cells both ex and in vivo.
Figure 6. Transduced cells produce fluorescent LEVs in vitro and in vivo which are taken up by other cells. (a) Stills from time-lapse microscopy demonstrate the uptake of a GFP+ LEV by dsRED BMECs. Co-cultures were established as previously described and this figure represents four frames taken at 10-min intervals. Top line: Overlay of images acquired using bright field, GFP and RFP filters (× 40 magnification). Middle line: expansion of indicated region of interest. Bottom line: images acquired using the RFP filter only. Images begin following the release of the GFP+ LEV (black arrow) into the extracellular space. The dsRED+ bone marrow cell appears to move towards the LEV which is internalised and shuttled within the recipient cell boundaries. Scale bar represents 10 µm. This sequence is best appreciated from the time-lapse video (Supplementary video 3). (b) Parent cells transfected to express GFP produce GFP+ vesicles in vivo. GFP+ NALM6 cells were introduced into NSG mice by intravenous injection and allowed to engraft. Bone marrow was flushed from the femurs 19 days later and plated onto CellTak coated glass bottomed plates. Images were captured using bright field illumination and a GFP filter. The figure shows the overlay of the two channels and GFP only where 2 GFP+ LEVs can be seen (yellow arrow). This method facilitates identification of cell of origin within the in vivo microenvironment. (c) LEVmCherry released in the murine bone marrow microenvironment are internalised by mBMSCs. SupB15 cells were transduced to express mCherry and transplanted into the femur of NSG mice. Bone marrow flushes were obtained 44 days later, seeded onto fibronectin and fixed. Parent ALL cells were transduced to express the fluorescent protein mCherry, produce and release mCherry+ LEVs in vivo. Cells were counterstained using Cell Mask green and images captured at × 160 magnification. Cell mask green labelled adherent endogenous mBMSCs show internalised mCherry+ ALL LEVs within the cell membrane of two of the three BMSCs shown here. These data also suggest that vesicle uptake is a selective process.
Phenotypic alterations to recipient cells with internalised LEVs
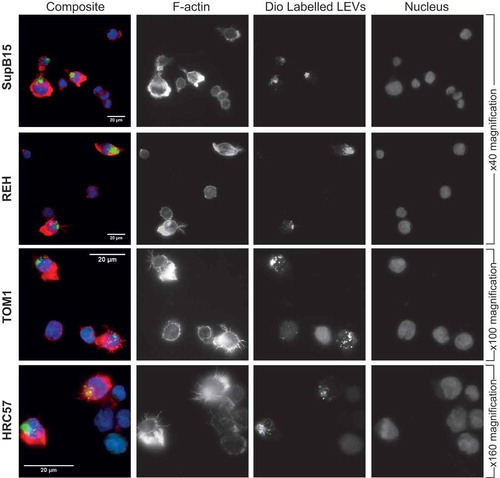
EVs released in vivo by aggressive tumour cells can be internalised by neighbouring as well as remotely located, less malignant cells and result in their transformation to a more aggressive phenotype.[Citation19] SDI cells have a highly organised filamentous actin cytoskeleton; show increased motility and invasion in Boyden chamber assays and more readily infiltrate across the blood–brain barrier in xenograft models.[Citation16] The SD1 cell line therefore represents a more aggressive phenotype compared with other BCP-ALL cell lines used in this study. Less aggressive BCP-ALL cell lines SupB15, REH and TOM1 and the normal lymphoblastic cell line HRC57 were co-incubated for 24 h with pre-labelled SD1 LEVs. In all experiments, a proportion of cells showed evidence of internalised SD1 LEVs indicated by green fluorescence. Cells with internalised LEVs displayed increased actin polymerisation, polarisation and distinct filamentous filopodia (F-Actin, red) strikingly similar to the parent SD1 cells, in contrast to those without internalised LEVs ().
Figure 7. Uptake of SD1 LEVs by other suspension cells changes their actin phenotype. The BCP-ALL cell lines SupB15, REH and TOM1 and the normal B lymphoblastic cell line HRC57 were co-incubated for 24 h with Dio C labelled SD1 LEVs (green). Cells were washed and plated onto CellTak coated glass coverslips and labelled with Alexa Fluor Phalloidin to visualise polymerised actin (red) and DAPI (blue). Cells with punctate, intracellular green fluorescence indicate internalised LEVs and correspond to increased actin polarisation and presence of distinct filopodia. With each frame, cells are present within the field of view which have not internalised LEVs and display significantly less polymerised actin, indicated by lower red fluorescence. Images were captured as before at × 40, × 100 or × 160 magnification as indicated. Scale bar represents 20 µm.
Discussion
This paper describes the identification of LEVs of >2 μm in size in cell culture, in bone marrow flushes from mice engrafted with ALL cells and in diagnostic bone marrow aspirates from ALL patients. TEM showed blebbing in ALL cells and thus within the current parameters for classification of EVs, the larger LEVs could fall into the class of apoptotic bodies (ABs). However, TEM also showed that these large vesicles contained intact subcellular organelles without nuclear material or chromatin condensation and immunofluorescence microscopy revealed them to be DAPI negative. Furthermore, LEVs maintained independent motility and exhibited dynamic shape change in vitro, had an organised cytoskeleton and transformed the phenotype of recipient cells. Time lapse microscopy revealed LEVs being budded and released in an active process by ALL cells which appear to retain viability post vesicle release. LEVs adhered to CellTak, a cell adhesive derived from mussels. These tight adhesions could only be disrupted enzymatically by trypsinisation, suggesting expression of cell adhesion molecules, as demonstrated in other studies.[Citation4] Finally, LEVs released by cell lines were strikingly similar in morphology, size and content to those isolated from patient derived ALL cells, adding confidence for their use as a model of EV biology. These observations suggest that BCP-ALL cells generate a heterogeneous population of extracellular vesicles, including a class of large EVs containing intact organelles both in vitro and in vivo.
EVs have been identified in the peripheral blood,[Citation20] and diagnostic blood smears from leukaemic patients.[Citation21] Whilst we identified vesicles ranging from 50 nm to 5.9 µm in size using a variety of techniques, there is currently no single instrument available to quantify all vesicles from any given sample. Preparation of larger vesicles required careful preservation of morphology and an intact outer membrane, to enable study of intra-vesicle content and to assess composition. Applying cell biology techniques to study vesicle biology has many challenges. The heterogeneity in size, different mechanisms of vesicle generation and lack of a clear single discriminatory marker prevents the acquisition of truly quantitative data. The methodology used in this study circumvented the need for a pure population by applying analyses to all LEVs collected from cell lines, primary cells and clinical material.
The sequence of LEV exchange presented during overnight time lapse experiments was sought across multiple wells in several experiments. Specific co-culture interactions via vesicle exchange were often obscured as cells were motile and the frequency of this event is unclear. The presence of both GFP+ and dsRED+ smaller vesicles in the extracellular space suggests an abundance of heterogeneous EVs in the co-culture supernatant derived from both cell types. The microscopy experiments do not permit the visualisation of exchange of these smaller particles. Whilst we noted peri-nuclear localisation of labelled LEVs in BMSCs, suggesting an accumulation in recipient cell endo-lysosomal compartments, the fate of internalised LEVs also requires further investigation.
GFP+ or mCherry+ parent cells produced LEVs whose origin could easily be identified; however, parent cell identification in clinical samples remains a challenge. To demonstrate that LEVs were leukaemic specific, in our controlled experiments we used the B cell surface antigen CD19 as a marker. However, the regenerating marrow has a population of normal BCP cells that also express this antigen. Further work is required to investigate if indeed LEVs can be distinguished accurately from EVs released from normal B cells. Currently the response to disease is measured by repeated bone marrow aspirates to detect residual leukaemic cells. As a single ALL cell produces a number of LEVs and these are released into the peripheral circulation, the accurate identification of such particles in peripheral blood has the potential to become a highly sensitive and specific biomarker of disease progression.
The concept that cells are capable of transferring organelles is not new; intercellular organelle transfer via nanotubules has been described [Citation22,Citation23] and the transfer of healthy mitochondria to cells with defective or deleted mitochondria can rescue aerobic respiration.[Citation24] We previously reported the detection of LEVs in the peripheral circulation of a patient-derived xenograft model.[Citation7] Along with other published data, this suggests that EVs have the potential to travel to distal sites, influence the microenvironment and establish sanctuary sites or a pre-metastatic niche.[Citation25,Citation26] The internalisation of malignant EVs by normal cells, as described here, provides a mechanism for horizontal transfer, resulting in phenotypic transformation of the recipient cell. This phenomenon has been reported elsewhere in a murine mammary tumour model.[Citation19] As previously reported by us, exposure of bone marrow stromal cells to unselected LEVs resulted in a switch to glycolysis.[Citation7] Potentially, this may favour tumour survival, particularly at times of oxidative or cytotoxic stress, and give rise to disease recurrence.[Citation8] LEVs may provide some clues to unexplained conundrums in the therapeutic responses in BCP-ALL. ALL is genetically heterogeneous and composed of a number of subclones on a clonal background. Both clonal and subclonal genetic subgroups have prognostic significance.[Citation27,Citation28] In general, within the clonal cytogenetic subtypes, minor subclones present at diagnosis dominate at relapse,[Citation29] but retain chemosensitivity as second remissions are usually obtained.[Citation28] This persistent, partial chemosensitivity is difficult to explain within a branching evolution model.[Citation30] We have observed that different ALL cell lines and patient samples produce a varying number of LEVs, both in size and quantity. Furthermore, not all cells in a sample produce vesicles. It is possible then that certain “resistant” genetic subclones may produce LEVs and protect more “sensitive” clones either through horizontal transfer or by creating a chemoprotective niche. It is also possible that CD19 positive LEVs may act as decoy for CD19 directed therapy, leading to the persistence of CD19 positive ALL cells in some patients.[Citation31,Citation32]
This study presents observations supporting the idea that EVs are major mediators of intercellular communication. LEVs contain cytoplasm from the parent cell as indicated by GFP or mCherry expression, but the question of whether their total cargo is precisely selected and packaged into vesicles, rather than randomly, merits further investigation. The abundance and direct relationship to the tumour cell suggest that as better techniques are established, EVs have the potential to become highly sensitive and specific biomarkers. Irrespective of the source of the EVs or mechanism of release, improvements in our understanding of the mechanisms that regulate the specificity of internalisation are also likely to lead to advances in clinical and therapeutic applications.
Johnson_et_al_Supplemental_data.pdf
Download PDF (5.2 MB)Supplemental_video_3b_GFP__LEV_exchange_RFP_channel_only_B_W.avi
Download Microsoft Video (AVI) (9.3 MB)Supplemental_video_1_GFP__LEV_independent_shape_change.avi
Download Microsoft Video (AVI) (108.8 MB)Supplemental_video_3a_GFP__LEV_exchange_scale_and_spot_light.avi
Download Microsoft Video (AVI) (27 MB)Supplemental_video_1b_GFP__LEV_independent_shape_change_scale_and_spot_light.avi
Download Microsoft Video (AVI) (79 MB)Supplemental_video_2_LEV_exchange.avi
Download Microsoft Video (AVI) (27.8 MB)Acknowledgements
SJ and VS conceived the study. CP contributed material. SJ, CD, AM and HB performed experiments. SJ and VS interpreted data and wrote the paper.
Disclosure statement
No potential conflict of interest was reported by the authors.
Supplemental data
Supplemental data for this article can be accessed here.
Additional information
Funding
Related Research Data
References
- Kalra H, Drummen GP, Mathivanan S. Focus on extracellular vesicles: introducing the next small big thing. Int J Mol Sci. 2016;17(2):1.
- Raposo G, Stoorvogel W. Extracellular vesicles: exosomes, microvesicles, and friends. J Cell Biol. 2013;200(4):373–12.
- György B, Szabó TG, Pásztói M, et al. Membrane vesicles, current state-of-the-art: emerging role of extracellular vesicles. Cell Mol Life Sci. 2011;68(16):2667–2688.
- Yáñez-Mó M, Siljander PR, Andreu Z, et al. Biological properties of extracellular vesicles and their physiological functions. J Extracell Vesicles. 2015;4:27066.
- Di Vizio D, Morello M, Dudley AC, et al. Large oncosomes in human prostate cancer tissues and in the circulation of mice with metastatic disease. Am J Pathol. 2012;181(5):1573–1584.
- Minciacchi VR, You S, Spinelli C, et al. Large oncosomes contain distinct protein cargo and represent a separate functional class of tumor-derived extracellular vesicles. Oncotarget. 2015;6(13):11327–11341.
- Johnson SM, Dempsey C, Chadwick A, et al. Metabolic reprogramming of bone marrow stromal cells by leukemic extracellular vesicles in acute lymphoblastic leukemia. Blood. 2016;128(3):453–456.
- Liu J, Masurekar A, Johnson S, et al. Stromal cell-mediated mitochondrial redox adaptation regulates drug resistance in childhood acute lymphoblastic leukemia. Oncotarget. 2015;6(40):43048–43064.
- Schneider CA, Rasband WS, Eliceiri KW. NIH Image to ImageJ: 25 years of image analysis. Nat Methods. 2012;9(7):671–675.
- Patel N, Krishnan S, Offman MN, et al. A dyad of lymphoblastic lysosomal cysteine proteases degrades the antileukemic drug L-asparaginase. J Clin Invest. 2009;119(7):1964–1973.
- Sexton KB, Witte MD, Blum G, et al. Design of cell-permeable, fluorescent activity-based probes for the lysosomal cysteine protease asparaginyl endopeptidase (AEP)/legumain. Bioorg Med Chem Lett. 2007;17(3):649–653.
- Headland SE, Jones HR, Asv D, et al. Cutting-edge analysis of extracellular microparticles using imagestreamx imaging flow cytometry. Sci Rep. 2014;4:5237.
- Lawrie AS, Albanyan A, Cardigan RA, et al. Microparticle sizing by dynamic light scattering in fresh-frozen plasma. Vox Sanguinis. 2009;96(3):206–212.
- Paluch EK, Raz E. The role and regulation of blebs in cell migration. Curr Opin Cell Biol. 2013;25(5):582–590.
- Lorentzen A, Bamber J, Sadok A, et al. An ezrin-rich, rigid uropod-like structure directs movement of amoeboid blebbing cells. J Cell Sci. 2011;124(Pt 8):1256–1267.
- Holland M, Castro FV, Alexander S, et al. RAC2, AEP, and ICAM1 expression are associated with CNS disease in a mouse model of pre-B childhood acute lymphoblastic leukemia. Blood. 2011;118(3):638–649.
- Janmey PA, Lindberg U. Cytoskeletal regulation: rich in lipids. Nat Rev Mol Cell Biol. 2004;5(8):658–666.
- Croisé P, Estay-Ahumada C, Gasman S, et al. Rho GTPases, phosphoinositides, and actin: A tripartite framework for efficient vesicular trafficking. Small Gtpases. 2014;5(2):e29469.
- Zomer A, Maynard C, Verweij FJ, et al. In Vivo imaging reveals extracellular vesicle-mediated phenocopying of metastatic behavior. Cell. 2015;161(5):1046–1057.
- Carr JM, Dvorak AM, Dvorak HF. Circulating membrane vesicles in leukemic blood. Cancer Res. 1985;45(11 Pt 2):5944–5951.
- van der Meer W, MacKenzie MA, Dinnissen JWB, et al. Pseudoplatelets: a retrospective study of their incidence and interference with platelet counting. J Clin Pathol. 2003;56(10):772–774.
- Rustom A, Saffrich R, Markovic I, et al. Nanotubular highways for intercellular organelle transport. Science. 2004;303(5660):1007–1010.
- Lim YS, Tang BL. Intercellular organelle trafficking by membranous nanotube connections: a possible new role in cellular rejuvenation? Cell Commun Adhes. 2012;19(3–4):39–44.
- Spees JL, Olson SD, Whitney MJ, et al. Mitochondrial transfer between cells can rescue aerobic respiration. Proc Natl Acad Sci U S A. 2006;103(5):1283–1288.
- Peinado H, Alečković M, Lavotshkin S, et al. Melanoma exosomes educate bone marrow progenitor cells toward a pro-metastatic phenotype through MET. Nat Med. 2012;18(6):883–891.
- Costa-Silva B, Aiello NM, Ocean AJ, et al. Pancreatic cancer exosomes initiate pre-metastatic niche formation in the liver. Nat Cell Biol. 2015;17(6):816–826.
- Moorman AV, Enshaei A, Schwab C, et al. A novel integrated cytogenetic and genomic classification refines risk stratification in pediatric acute lymphoblastic leukemia. Blood. 2014;124(9):1434–1444.
- Irving JA, Enshaei A, Parker CA, et al. Integration of genetic and clinical risk factors improves prognostication in relapsed childhood B-cell precursor acute lymphoblastic leukemia. Blood. 2016;128(7):911–922.
- Ma X, Edmonson M, Yergeau D, et al. Rise and fall of subclones from diagnosis to relapse in pediatric B-acute lymphoblastic leukaemia. Nat Commun. 2015;6:6604.
- Haeno H, Gonen M, Davis Meghan B, et al. Computational modeling of pancreatic cancer reveals kinetics of metastasis suggesting optimum treatment strategies. Cell. 2012;148(1–2):362–375.
- Topp MS, Gökbuget N, Zugmaier G, et al. Phase II trial of the anti-CD19 bispecific T cell-engager blinatumomab shows hematologic and molecular remissions in patients with relapsed or refractory B-precursor acute lymphoblastic leukemia. J Clin Oncol. 2014;32(36):4134–4140.
- Maude SL, Frey N, Shaw PA, et al. Chimeric antigen receptor T cells for sustained remissions in leukemia. N Engl J Med. 2014;371(16):1507–1517.