
ABSTRACT
Studies have suggested that nanoscale extracellular vesicles (EV) in human and bovine milk carry immune modulatory properties which could provide beneficial health effects to infants. In order to assess the possible health effects of milk EV, it is essential to use isolates of high purity from other more abundant milk structures with well-documented bioactive properties. Furthermore, gentle isolation procedures are important for reducing the risk of generating vesicle artefacts, particularly when EV subpopulations are investigated. In this study, we present two isolation approaches accomplished in three steps based on size-exclusion chromatography (SEC) resulting in effective and reproducible EV isolation from raw milk. The approaches do not require any EV pelleting and can be applied to both human and bovine milk. We show that SEC effectively separates phospholipid membrane vesicles from the primary casein and whey protein components in two differently obtained casein reduced milk fractions, with one of the fractions obtained without the use of ultracentrifugation. Milk EV isolates were enriched in lactadherin, CD9, CD63 and CD81 compared to minimal levels of the EV-marker proteins in other relevant milk fractions such as milk fat globules. Nanoparticle tracking analysis and electron microscopy reveals the presence of heterogeneous sized vesicle structures in milk EV isolates. Lipid analysis by thin layer chromatography shows that EV isolates are devoid of triacylglycerides and presents a phospholipid profile differing from milk fat globules surrounded by epithelial cell plasma membrane. Moreover, the milk EV fractions are enriched in RNA with distinct and diverging profiles from milk fat globules. Collectively, our data supports that successful milk EV isolation can be accomplished in few steps without the use of ultracentrifugation, as the presented isolation approaches based on SEC effectively isolates EV in both human and bovine milk.
Responsible Editor Marca Wauben, Utrecht University, Netherlands
Introduction
It is well documented that there are considerable differences between breast-fed and formula-fed infants in terms of growth patterns, nutritional status, composition in gut microbiota, frequency of infections, and perhaps also long-term effects such as prevalence of obesity and cardiovascular disease.[1] This is a reflection of the indigenous bioactives in milk, from live bacteria and immune cells, a large number of proteins and derived peptides, to lipids and oligosaccharides.[Citation2–Citation5] In recent years phospholipid assemblies in skim milk have been identified as extracellular vesicles (EV), which potentially allows valuable intercellular communication between a mother and her infant.
Already in 1971, a vesicle rich isolate was observed when bovine skim is ultracentrifuged. This isolate appeared as a characteristic pale yellow soluble layer located above a firm casein pellet which has been termed the “fluff layer”.[Citation6] These vesicular skim milk structures were first identified as EV in 2007 by Admyre et al.,[Citation7] who described their immunological potential in human breast milk, including colostrum and mature milk. In 2012, the fluff layer was applied as a source for crude bovine milk EV (MEV) by Reinhardt et al.[Citation8]
A large number of publications have described the molecular characteristics and investigated the potential biological purpose of EV in milk from several mammalian species. MEV are reported to display a heterogeneous size ranging from 50 to 200 nm, a density of approximately 1.1–1.2 g cm–3, a content of various RNAs with little or no ribosomal RNA, and to be enriched in the classic EV marker proteins CD9, CD63, Hsc70, MHC-class II, lactadherin, and TSG101, among others.[Citation7–Citation16]
The maternal origin of MEV is largely unknown, although suggested to be secreted by mammary epithelium cells and various immune cells.[Citation7,Citation16–Citation18] MEV secretion by the mammary epithelium is likewise supported by the high lactadherin content on the milk vesicle surface, due to accumulation of this protein near the apical membrane in milk producing cells.[Citation19]
The biological relevance is underscored by the fact that fibroblasts and macrophages can take up MEV from human and bovine milk, including their RNA content.[Citation9,Citation10,Citation20] Moreover, studies support that bovine MEV RNA is unaffected by acidification of milk performed to mimic the acidic conditions in the gastric tract.[Citation10,Citation11] Although controversial, it has been suggested that RNA from nutritionally relevant doses of cow’s milk can be absorbed and regulate human genes.[Citation21,Citation22]
This augments the relevance of comparing human to bovine MEV in terms of molecular composition to investigate similarities and differences, for the evaluation of cross-species reactions.
It is well established that milk contains other colloidal structures with comparable size to MEV, e.g. milk fat globules (0.1–15 µm) and casein micelles (100–200 nm).[Citation23,Citation24] Already in 1971, published data using 14C-labelled phospholipids demonstrated that the secretion pathways of milk fat globules and skim milk phospholipid structures most likely are separate.[Citation25] More recent studies support that the protein content differ between MEV and milk fat globules,[Citation7,Citation8] and underscores that the two lipid particles each hold their biological potential in milk.
Casein micelles constitute a major part of the protein content in human (3.6 g l–1, 40% of total protein) and bovine milk (27.2 g l–1, 80% of total protein).[Citation26] The average casein micelle density is reported to be 1.0632 g cm–3.[Citation27] This value most likely varies with species, casein micelle size, composition, and naturally also milk storage and processing. As both the size and to some extent density of casein micelles overlapping with those of MEV, this major milk structure represents a likely contaminant in MEV isolates.
Reported protocols for isolation of MEV differ considerably. Protocols often include a number of differential centrifugation steps, including ultracentrifugation, sucrose density gradients, filtration, and commercial EV isolation kits.[Citation28] Until now, only Zonneveld et al. [Citation15] have considered co-isolation of casein with human MEV in their pellet-free density gradient isolation approach. They also stressed that sample collection and storage conditions of breast milk fractions are important in reducing contamination of native MEV populations with apoptotic bodies.[Citation15] Accordingly, these authors recommend defatting and removal of milk cells prior to storage. Defatting is recommended before storage as over half of milk phospholipid membranes encircle milk fat in the fragile milk fat globule structure which ruptures upon freezing and thawing of milk samples.[Citation29,Citation30] It is likely that milk fat globule disintegration can result in the formation of MEV-like structures from MFGM that can contaminate MEV isolates.
Gelfiltration has in recent years been discovered as a useful and effective EV isolation approach for biological fluids.[Citation31–Citation33] This chromatographic technique allows the separation of particles according to size, and effectively separates smaller soluble proteins from larger structures, while conserving their integrity and biological activity with no loss of sample.[Citation34] Moreover, gelfiltration can easily be scaled to meet specific input and output needs, e.g. for isolating large volumes of EV.
Current MEV isolation strategies differ significantly between human and bovine milk. This is most likely explained by the large casein content in bovine milk which makes the isolation more cumbersome. However, different isolation strategies are known to result in different EV populations [Citation35] and, therefore, the comparison of MEV from human and bovine sources is not optimal when they are isolated using current methods.
The current work presents two strategies based on gelfiltration for the isolation of human and bovine MEV. Importantly, cryo-preservation of milk samples, pelleting of MEV material, and membrane filtration has been avoided to minimise the occurrence of artefacts. The first MEV isolation approach is based on an optimised fluff layer, whereas the other approach permits MEV isolation without the use of ultracentrifugation.
The use of gelfiltration proves to be efficient in removing residual caseins and whey proteins from the lower abundant MEV. The content of EV markers and caseins across the isolation procedure was monitored to validate the strategies. Moreover, MEV isolates were analysed for their ratios of phospholipid and neutral lipid classes, particle size and concentration, ultrastructure, MEV flotation density, and total RNA content. MFGM is the main phospholipid component in both human and bovine milk.[Citation25,Citation36] Thus, the molecular profiles of MFGM and/or milk fat globule preparations were included for comparative reasons.
Materials and methods
MEV isolation
Term human mature breast milk was collected by at least seven different local healthy mothers in mid-lactation. Human breast milk samples were stored less than 24 h at 4°C before the isolation was initiated. The study was approved by the local ethics committee, and donors informed about the nature of the study before they gave their consent to participate. Raw unprocessed bovine tank milk from Danish Holstein cows, less than 48 h, was collected from a local conventional farmer. At least 15 bovine milk samples were used to verify the isolation methods. The MEV isolation, outlined in , was initiated immediately on milk arrival with all steps performed at 4°C without any intermediate cryo-preservation. Proteolytic activity in the raw milk (50–100 ml) was inhibited by the addition of 50 µM phenylmethylsulfonyl fluoride, and centrifuged at 1250 g (human milk)/3400 g (bovine milk) for 35 min to remove cells and fat globules. From in-house experience, different skimming speeds were applied for human and bovine milk to obtain the best skimming of each of the two milk types. Different skimming speeds (1000–4000 g) were not found to affect the MEV isolation. The skim milk was subjected to either 340,000 g in 39 ml tubes, or 20,000 g in 27 ml tubes for 1 h to sediment the main casein component. Rotor types, centrifugal force, adjusted clearing factor, and run times are outlined in Table S1. From tubes centrifuged at 340,000 g the soluble pale yellow coloured fluff layer above the casein pellet was carefully drawn 30 min after ultracentrifugation using a long glass pipet (Figure S1). From the parallel 20,000 g centrifugation, casein depleted clear milk serum was drawn from the middle of the tube. Fluff layer (1–3 ml) or milk serum (20–30 ml) was subjected to size-exclusion chromatography (SEC) on a 2.5 x 88 cm (432 ml) Sephacryl S-500 column (GE Healthcare, Chicago, IL, USA) in 0.2 µM filtered PBS (50 mM NaH2PO4, 0.15 M NaCl) pH 7.4, 20 mM EDTA. The eluate was collected in approximately 193 sequential fractions of 4.4 ml. The columns void volume was calculated to be 130 ml. SEC of the human fluff layer was performed on a smaller (238 ml) Sephacryl s-500 column, and the elution profile and absorbance values are, therefore, lower as compared to the other chromatogram profiles. The eluate from this column was collected in 119 sequential fractions of 2.65 ml. SEC separation was monitored in the eluting fractions by measuring the absorbance at 280 nm. Eluted fractions were analysed as described.
Figure 1. Summary of the MEV isolation approaches. Raw human or bovine milk was skimmed by centrifugation to remove the milk fat globules (MFG) in the cream layer, and to sediment somatic milk cells. Two parallel MEV (milk extracellular vesicle) isolation approaches, based on differential centrifugation and size-exclusion chromatography (SEC), were employed on human and bovine skim milk. (1) Ultracentrifugation of the skim milk (39 ml per tube) results in a solid pellet (340K pellet) containing most of the skim milk casein, a supernatant of milk serum (340K supernatant), and a viscous phospholipid rich soluble concentrate positioned adjacent to the casein pellet (see photo in Sup. Figure S1). The phospholipid concentrate obtained by ultracentrifugation of skim milk is traditionally called the “fluff layer”.[Citation6] (2) A lower g-force centrifugation of human and bovine skim milk (27 ml per tube) results in a casein pellet, and a supernatant of milk serum. Naturally, the casein pellet of human skim milk is smaller compared to bovine skim milk, with the latter depicted in the figure. Subsequently, MEV present in the fluff layer or milk serum can be isolated from remaining soluble casein and whey proteins by SEC. MEV isolation and analysis from the fluff layer is highlighted in red and milk serum in green.
![Figure 1. Summary of the MEV isolation approaches. Raw human or bovine milk was skimmed by centrifugation to remove the milk fat globules (MFG) in the cream layer, and to sediment somatic milk cells. Two parallel MEV (milk extracellular vesicle) isolation approaches, based on differential centrifugation and size-exclusion chromatography (SEC), were employed on human and bovine skim milk. (1) Ultracentrifugation of the skim milk (39 ml per tube) results in a solid pellet (340K pellet) containing most of the skim milk casein, a supernatant of milk serum (340K supernatant), and a viscous phospholipid rich soluble concentrate positioned adjacent to the casein pellet (see photo in Sup. Figure S1). The phospholipid concentrate obtained by ultracentrifugation of skim milk is traditionally called the “fluff layer”.[Citation6] (2) A lower g-force centrifugation of human and bovine skim milk (27 ml per tube) results in a casein pellet, and a supernatant of milk serum. Naturally, the casein pellet of human skim milk is smaller compared to bovine skim milk, with the latter depicted in the figure. Subsequently, MEV present in the fluff layer or milk serum can be isolated from remaining soluble casein and whey proteins by SEC. MEV isolation and analysis from the fluff layer is highlighted in red and milk serum in green.](/cms/asset/4f8be036-1c2a-4723-b5e3-1bf4297283a7/zjev_a_1294340_f0001_oc.jpg)
Concentration of MEV fractions
If indicated, the first SEC peak (F1 or S1) was concentrated by reverse osmosis dialysis in 10% polyethylene glycol (PEG) 20,000 (Aldrich, St. Louis, MO, USA) in PBS pH 7.4 overnight in a sample to PEG ratio of 1:10 (v/v). Concentration of smaller sample volumes was performed using Amicon® Ultra-0.5 ml centrifugal filters, 10 kDa (Merck Millipore, Billerica, MA, USA).
Isolation of milk fat globules and milk fat globule membrane fractions
Fat globules were isolated as described by Patton and Huston.[Citation36] Bovine MFGM was isolated essentially as described by Hvarregaard et al.[Citation37] Human MFGM was isolated as described by Kvistgaard et al.[Citation38]
Determination of protein concentration
Protein concentrations in the analysed fractions were determined by a modified Lowry procedure [Citation39] using serial dilutions of BSA as standard. All protein concentrations were determined in triplicate.
SDS-PAGE, Western blotting, and Coomassie staining
Ten µg protein from the indicated SEC fractions (concentrated by centrifugal filtration), pellets, or MFGM preparation were separated on NuPAGE Novex Gels, 10% Bis-Tris (MOPS buffer) under non-reduced conditions. The separated proteins were transferred to PVDF membranes (1 h at 200 V and 500 mA). PVDF membranes were blocked in 2% Tween-20 in TBS (50 mM Tris, 0.5 M NaCl) pH 7.4 and probed with the following primary antibodies: in-house produced rabbit anti-bovine PAS-7/lactadherin (polyclonal), and rabbit anti-human BA46/lactadherin (polyclonal) produced by MedProbe.com targeting the human lactadherin peptides CEE ISQEVRGDVFPSY and DSANWTEYQDPRTGS. Both human and bovine lactadherin appears in two glycosylation variants,[Citation37] and, therefore, two bands of the protein are detected. Bovine lactadherin (PAS-6/7) [Citation37] and human lactadherin (BA46) [Citation38] standards were purified as previously described, and stored in 75 mM sodium phosphate, pH 7.0 at −80°C. Purchased antibodies include mouse anti-human CD63 (TS63, Abcam, Cambridge, UK), mouse anti-human CD9 (H19a, BioLegend, San Diego, CA, USA), rabbit anti-human CD81 (bs-6934R, Bioss Antibodies, Woburn, MA, USA), rabbit anti-human Beta-casein (Ab112595, Abcam).
Quantification of bovine protein markers by liquid chromatography-mass spectrometry (LC-MS)
Samples in 50 mM ammonium bicarbonate were reduced 1:3 with dithiothreitol at 100°C for 30 min. Trypsin was added in a ratio of 1:20 with respect to the total protein concentration in the sample and digested in the dark at 37°C for 20 h, followed by trypsin inactivation by 0.3% trifluoroacetic acid. Bovine peptides for quantification of lactadherin, CD9, CD63, β-casein, αS1-casein and αS2-casein were selected based on the abundance of the theoretically chosen peptides in a tryptic digest of a gently heat-treated milk whey or skim milk. Separation of tryptic peptides was performed on an Agilent 1200 Series system (Agilent Technologies, Santa Clara, CA, USA) equipped with a RP Symmetry300™ C18-column (5 μm, 2.1 × 150 mm, Waters Corp., Milford, MA, USA) at 45°C. Separation was achieved with a gradient of mobile phase (A) consisting of 0.1% (v/v) trifluoroacetic acid in Milli-Q purified water (Milli-Q academic, Merck Millipore) and mobile phase (B) consisting of 0.1% (v/v) trifluoroacetic acid (Uvasol®, Merck KGaA, Darmstadt, Germany) in acetonitrile (HPLC grade S, Rathburn, Walkerburn, Scotland). The flow was 0.35 ml min–1 and peptides were eluted isocratically at 0% B for 2 min followed by a gradient from 0% B to 29.4% B over 23 min. The column was re-equilibrated in between runs. Mass spectrometry (MS) detection was performed on an Agilent 6410 Triple-Quad LC/MS (Agilent Technologies) in positive electrospray ionization mode at the following conditions: gas temperature 350°C; gas flow 13 l min–1; nebuliser gas pressure 50 psi; capillary voltage 4000 V; nozzle voltage 600 V; cell accelerator voltage 7 V. MS analysis was performed in SRM mode, time segments were applied as far as the chromatographic resolution allowed it. UV spectra were recorded at 214 nm. Data processing was done with MassHunter Quantitative Analysis Software (B.06.00, Agilent Technologies). The selected references peptides and their MS transitions can be found in Table S2. Relative levels of the protein specific peptides are presented in percentages with the highest measured signal abundance from peptides derived from lactadherin, CD9, and CD63 set to 100%, respectively. Relative levels of β-casein, αS1-casein and αS2-casein were normalised to the peptides signal abundance in the casein rich pellets (340K and 20K) included in the analysis.
Nanoparticle tracking analysis
SEC fraction particles were directly analysed by nanoparticle tracking, using the NanoSight LM10 system (Nanosight Ltd., Amesbury, UK), configured with a 405 nm laser and a high-sensitivity sCMOS camera (OrcaFlash2.8 No. C11440, HamamatsuPhotonics, Hamamatsu City, Japan). Videos were collected and analysed using NTA software 3.0, build 0060 (Malvern, Worcestershire, UK). Ambient temperature was recorded manually and did not exceed 25°C. Each sample was diluted in particle-free PBS pH 7.4, 20 mM EDTA with a final volume of 2 ml, and all samples were diluted equally within the proposed standard curve area.[Citation40] The camera level was kept at 13 during all measurements, and five consecutive 60-s recordings were made for each sample. Samples were analysed with a detection threshold at 5. The resultant size and concentration output data were merged and averaged to generate the final size distribution and concentration for each sample.
Transmission electron microscopy
Pooled SEC fractions from the first EV containing peak (F1/S1) were dialysed against 10 mM HEPES, 140 mM NaCl, pH 7.4 using Amicon®Ultra-0.5 ml centrifugal filters, 10kDa (Merck Millipore) to remove phosphate. Electron microscopy samples were prepared as previously described.[Citation41] Samples were applied undiluted onto previously glow discharged home-made carbon coated copper grids and incubated for 10 s. Subsequently specimens were stained three times with 1% uranyl formate solution. Raw micrographs were acquired automatically at 67,000 magnification on specimen level using the Leginon system [Citation42] operated on a Tecnai Spirit BioTWIN TEM (Thermo Fisher Scientific, Hillsboro, OR, USA) at 80kv acceleration voltage and a Tietz 416 CMOS detector (TVIPS, Martinsried, Germany).
Phospholipid and neutral lipid analysis by thin layer chromatography (TLC)
The following molecular species were used as standard lipids: sphingomyelin (SM) (Fluka, 85615) from egg yolk, and cholesterol (Sigma, C3292) were purchased from Sigma Aldrich (St. Louis, MO, USA). Chemically synthesised phospholipids were purchased from Avanti (Alabaster, AL, USA) including; DOPC (1,2-dioleoyl-sn-glycero-3-phosphocholine), DOPE (1,2-dioleoyl-sn-glycero-3-phosphoethanolamine), and DOPS (1,2-dioleoyl-sn-glycero-3-phospho-L-serine (sodium salt)). Commercial corn oil was used as triacylglyceride standard. Only chromatographic solvents of analytical grade were used.
Total lipids were extracted by adding six volumes of cold chloroform:methanol (1:1) to reverse osmosis concentrated F1/S1 SEC peaks, MFGM or milk fat globule fractions followed by centrifugation at 22,000 g for 15 min. The supernatant was transferred to new tubes and dried under a stream of nitrogen. Dry lipids were either stored or solubilised in chloroform:methanol (95:5) and preserved at −20°C. Resuspended lipids were kept in glass vials with PTFE coated lids and wrapped in parafilm to avoid evaporation of organic solvent. Lipid extracts and lipid standards were applied to HP-TLC silicagel 60 glass plates (20 × 10 cm, Merck Millipore) using an Automatic TLC sampler (ATS4, CAMAG, Muttenz, Switzerland). Samples were applied as 10 mm bands using the spray-on technique 10–15 mm from the lower edge of the plate. For separation of neutral lipids, plates were developed twice in a horizontal chamber in hexane:diethylether:ethanol (7:3:0.1) as described.[Citation43] After the first development plates were air-dried for 30 min, and developed again in the same solvent. For separation of phospholipids, plates were developed in a vertical chamber; first in the neutral lipid solvent to reduce the background from neutral lipids, followed by 30 min air-drying, and secondly in ethyl acetate: H2O:formic acid:diethylether (8:1:1.25:0.75). Developed plates were air-dried for at least 20 min, and spray-staining with 0.2% MnCl2 in 50% methanol and 3% sulphuric acid. The stained plates were heated at 120°C for 20 min using a TLC plate heater (CAMAG) and inspected in UV light at 366 nm and imaged using a TLC visualiser (CAMAG). winCATS (version 1.01, CAMAG) software was used to analyse phospholipid TLC band fluorescent densities and assign Rf values to the standard phospholipids. Rf values: SM (0.132), DOPC (0.317), DOPS (0,676), DOPE (0,763). Phosphatidylinositol was not included in the analysis due to an inefficient zone concentration of the standard lipid, but did not overlap with the analysed phospholipid classes.
Sucrose density analysis
Linear sucrose gradients were prepared by layering 3 ml of successive sucrose solutions (0.46, 0.8, 1.18, and 1.58 M in 5 mM Tris-HCl, pH 7.5) below one another in 14 ml tubes. The gradients were linearised overnight at 4°C. Pooled SEC fractions from F1/S1 peaks isolated from 20–80 ml raw milk were concentrated by reverse osmosis, and diluted 1:1 in a 0.25 M sucrose solution. Approximately 1 ml EV-sucrose mix was top loaded onto the linear gradients and ultracentrifuged in a SW40 rotor at 164,000 g for 18 h, 4°C. One ml density fractions were drawn carefully from the top of the gradients. Density in each of the drawn fractions was determined using a portable density meter (DENSITO30PX, Mettler-Toledo, Greifensee, Switzerland). From each density fraction 0.5 ml was diluted 10× in PBS pH 7.4 and pelleted at 100,000 g for 70 min using a SW55 rotor to collect EV material. Pellets were resuspended in non-reduced SDS-PAGE sample buffer and analysed by Western blotting.
RNA isolation and detection
RNA was isolated from reverse osmosis concentrated F1/S1 peaks (kept at −80°C) using miRCURYTM RNA Isolation Kit – Cell and Plant (Exiqon, Vedbaek, Denmark). Cream (2 mg) sampled from the first centrifugation of raw milk fractions was additionally added Lysis Additive (Exiqon) to aid the RNA isolation. All isolation procedures were performed according to the manufacturer’s protocol. RNA isolates were analysed in triplicate by capillary electrophoresis using the Agilent RNA 6000 Pico kit on an Agilent 2100 Bioanlyzer® (Agilent Technologies) as previously described.[Citation44] RNA concentration estimates were based on the concentrations calculated by the Agilent software, and the volume of milk from which the MEV fractions were isolated.
Western blotting, LC-MS, and TLC data have been deposited in the EV database Vesiclepedia: Bovine MEV data (Vesiclepedia ID 635), human MEV data (Vesiclepedia ID 636).
Results
Isolation of milk EV
To evaluate the applicability of size-exclusion chromatography in the isolation of human and bovine MEV two isolation approaches were tested (summarised in ). Raw human or bovine milk was initially centrifuged at low speed to separate cream and skim milk, and to sediment milk cells. Milk fat globules or milk fat globule membrane were isolated from the cream layer for comparative analysis.
Two different centrifugation procedures were used in order to separate the caseins from phospholipid containing material in skim milk. The first approach included an ultracentrifugation step at 340,000 g to obtain the soluble phospholipid containing fluff layer positioned above a solid casein pellet.[Citation6] Ultracentrifugation of human skim milk resulted in a smaller casein pellet and fluff layer (~0.5 ml) compared to the bovine fluff layer (~1 ml). After a 30 min delay, the fluff layer had settled and was easily drawn using a long glass pipet (Figure S1). To collect all membrane material in the fluff layer, and to reduce the layers content of casein, the ultracentrifugation force was optimised to 340,000 g. The high ultracentrifugation speed was found necessary to concentrate all EV material in the soluble fluff layer as ultracentrifugation at 100,000 or 200,000 g leaves detectable levels of CD81 and lactadherin in the milk supernatant. Moreover, 340,000 g resulted in a significant increased level of the two markers in the fluff layer compared to 100,000 g (data not shown). Importantly, the fluff layer is a soluble membrane concentrate with no pellet character in need of a following solubilisation step. The increased centrifugation force, however, did not lead to notable changes in the volume of the fluff layer. Possible detrimental effects of ultracentrifugation and resuspension of pelleted EV includes aggregation, and is currently discussed in the EV research community.[Citation35,Citation45] Thus, in the second method less centrifugal force was applied on the skim milk (20,000 g) to avoid possible detrimental effects on the vesicle structures. This approach was used to obtain a casein reduced milk serum containing membrane material and, thereby, avoid sedimentation of phospholipid vesicle parts. Next, SEC (Sephacryl S-500) was applied to separate remaining casein and whey proteins from vesicle material in the fluff layer and milk serum. As the diameter of the casein micelle (approximately 200 nm) effectively overlaps with MEV,[Citation24] the calcium rich casein structures were destabilised by including 20 mM EDTA in the elution buffer.[Citation46] Resulting fractions from SEC were inspected by Western blotting or/and LC-MS to assess the fractions relative content of EV markers and casein.
SEC of all four milk fractions resulted in elution profiles (280 nm absorbance) with a well–separated initial peak (eluting at 100–200 ml) devoid of most principal milk proteins, caseins and whey proteins, which eluted in the following fractions in less defined peaks (Figure S2). Western blotting or/and LC-MS analysis revealed that lactadherin, CD9, CD63, and CD81 are distinctly associated with the first peak, suggesting that MEV are eluting in this volume (). Lactadherin, also known as milk fat globule epidermal growth factor 8 (mfge8) was, not surprisingly, also present in the MFGM preparation. Also CD9 and CD63 were detected in MFGM, in particular in the human preparation, whereas CD81 neither was detected in the human nor bovine MFGM samples. The pellet obtained from the 340,000 g and 20,000 g centrifugation of human skim milk only showed weak bands of the EV markers, whereas the pellets from the bovine milk were devoid of the markers. In human milk, β-casein is the most abundant of the caseins.[Citation47] In the human milk serum profile β-casein was detected in the first MEV containing peak (hS1) revealing a slight casein content, whereas the fluff layers first SEC peak (hF1) was devoid of the protein ()). As caseins comprise 80% of the bovine milk protein content,[Citation48] the levels of β-casein, αS1- or αS2-casein were assessed across the bovine SEC profiles by LC-MS ()). All three of the caseins were detected almost exclusively in the second and third SEC peaks (bF2, bF3, bS2, and bS3), in agreement with the overall protein profile of the SEC fractions (Figure S2). When bovine CD63, CD9, and lactadherin levels were compared between bF1, bS1, and MFGM by LC-MS, much lower levels of CD63 and CD9 was detected in the MFGM sample compared to bF1 and bS1 ()).
Figure 2. SEC elution profiles and EV markers in human and bovine fluff and milk serum fractions. SEC (size-exclusion chromatography) profiles of human (a) and bovine (b) fractions were obtained by recording the absorbance at 280 nm. Fractions across the SEC profiles were collected from the fluff (F, in red) and milk serum (S, in green) runs with the eluting peaks annotated with F1–F4 and S1–S5. The solid casein rich pellets derived from the 340,000 g ultracentrifugation (340K pellet) and the 20,000 g centrifugation (20K pellet) were collected and included in the analysis as well as an MFGM preparation. All samples were analysed for their content of lactadherin, CD9, CD63 and CD81 by Western blotting and/or LC-MS. Moreover, human milk SEC fractions were screened for β-casein content by Western blotting, and bovine samples for their content of β-casein, αS1- and αS2-casein by LC-MS. Ten µg protein from the indicated SEC fractions were analysed by Western blotting using antibodies targeting the indicated proteins with their approximated weights shown. Relative levels obtained by LC-MS are based on the detection of peptides specifically derived from the indicated proteins. Abbreviations: MFGM, milk fat globule membrane; LC-MS, liquid chromatography–mass spectrometry.
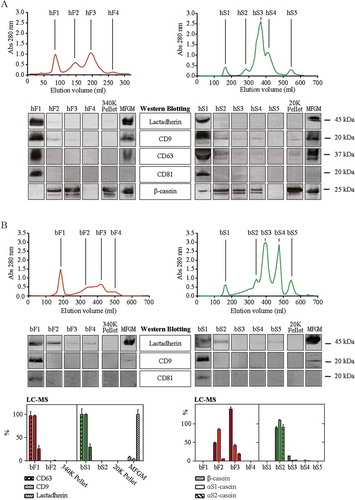
The human SEC profiles are representative for at least seven different MEV isolations performed on breast milk from different mothers. The corresponding bovine profiles are representative of at least 15 individual MEV isolations on raw unprocessed tank milk. All performed SEC isolations resulted in well-separated first peaks enriched in lactadherin with no significant casein content. Material from the first SEC peaks was subjected to subsequent investigations to confirm MEV content.
Particle size and morphology
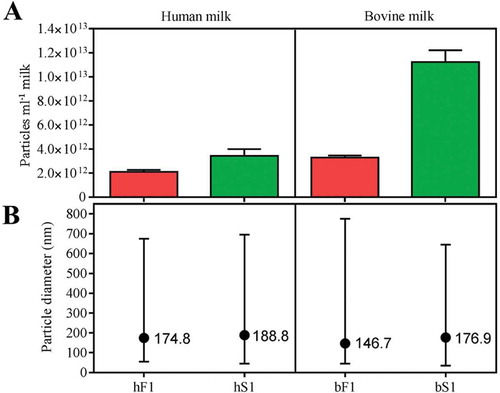
Particle size distributions in the first SEC peaks were investigated by nanoparticle tracking analysis (NTA) and the obtained concentration and size profiles are shown in . MEV isolates from milk serum were found to be more enriched in particles per volume start milk in comparison to the isolates obtained from the fluff layer. In particular bS1 contained a significantly higher particle concentration compared to the other isolates. A similar high particle concentration was detected in a different bS1 isolate (data not shown). Particle mode diameters were found to range between 147 and 189 nm. No significant difference in the size profiles between fluff and milk serum MEV isolates were observed. The mode diameters are representative of measurements performed on MEV isolates from several other milk samples using the same isolation approaches.
Figure 3. Particle concentration and size by nanoparticle tracking analysis (NTA). (a) Particle concentration in the first SEC peaks of human and bovine fluff (red) and milk serum (green) fractions adjusted to the original volume of milk. (b) Particle size distribution indicated by minimum, mode (●), and maximum particle diameter (nm). All samples were diluted in particle-free PBS, 20 mM EDTA and analysed using the NanoSight NTA system. Five successive measurements were performed on each sample. Minimum concentration for inclusion in minimum and max size in averaged records: 100 particles ml–1. Abbreviations: hF1, human fluff MEV; hS1, human milk serum MEV; bF1, bovine fluff MEV; bS1, bovine milk serum MEV.
Freshly prepared undiluted SEC MEV fractions were negatively stained and inspected by transmission electron microscopy (TEM) giving both overview and close-up representations (). Fluff and milk serum MEV isolates were obtained from the same milk sample. Both human- and bovine MEV fractions were observed to contain electron dense vesicle structures. The amount of particles varied in the tested MEV fractions; however, the observed vesicle density corresponded well with the absorbance measured at 280 nm. Fluff EV fractions of both human and bovine isolates were clearly dominated by vesicles. The human milk serum MEV fraction also contained smaller protein aggregates, whereas the bovine milk serum MEV fraction was observed to contain spherical less electron dense particles of approximately 10 nm.
Figure 4. Morphology of MEV isolates by transmission electron microscopy. Freshly prepared MEV isolates from pooled fractions of the first SEC peaks were stained with a 1% uranyl formate solution and imaged in the concentration they were eluted from the column. Abbreviations: SEC, size-exclusion chromatography; hF1, human fluff MEV; hS1, human milk serum MEV; bF1, bovine fluff MEV; bS1, bovine milk serum MEV.
Lipid profiles
The lipid profiles of the isolated MEV fractions were compared with the other more well characterised membrane particles in milk, namely milk fat globules and surrounding membrane (). To do this, total lipids were extracted and separated by TLC on silica glass plates. The obtained phospholipid profiles are presented in percent of total phospholipid ()). Both types of MFGM had the highest content of phosphatidylcholine, but the human type comprised very low amounts of phosphatidylethanolamine and phosphatidylserine. The obtained MFGM phospholipid levels are in overall agreement with the literature.[Citation49] In comparison, the human MEV isolates (hF1 and hS1) were clearly enriched in phosphatidylethanolamine and phosphatidylserine. Sphingomyelin was found to be the primary component in all MEV isolates, particularly hS1 in which the phospholipid accounted for approximately 70% of the four analysed phospholipids classes. The bovine MEV isolates tended to be more similar in phospholipid composition than the two MEV isolates derived from human milk.
Figure 5. Lipid profiles of milk membrane fractions by TLC. Crude lipids were extracted from the indicated milk membrane fractions using a chloroform:methanol solution. hF1 and hS1 were isolated from milk donated by different mothers. Phospholipids and neutral lipids in crude lipid extracts were separated by high performance thin layer chromatography (TLC) together with representative lipid standards. The ratios of distinct lipid bands were evaluated by a fluorescent stain and normalised to the lipid standards. (a) Phospholipid profiles of human and bovine MEV and MFGM preparations. (b) Triacylglyceride (TAG):cholesterol ratio of MEV, MFGM, and milk fat globule (MFG) preparations. Abbreviations: hF1, human fluff MEV; hS1, human milk serum MEV; bF1, bovine fluff MEV; bS1, bovine milk serum MEV; bMFGM, bovine milk fat globule membrane; bMFG, bovine milk fat globule; hMFGM, human milk fat globule membrane; hMFG, human milk fat globule.
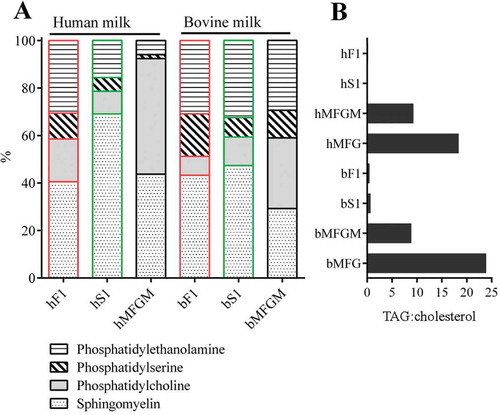
The lipid core of milk fat globules is constituted by neutral lipids or triacylglycerides (TAG) and this feature distances them from EV. Accordingly, milk fat globules, MFGM, and MEV isolates were assayed for their content of neutral lipids by TLC. MEV fraction profiles of neutral lipids were compared to milk fat globule and MFGM profiles ()). All samples presented a similar content of cholesterol, and their TAG content is presented as a ratio of TAG to cholesterol. As expected, the milk fat globule samples were identified with the largest TAG content, followed by the MFGM samples. Very low levels of TAG were detected in the bovine MEV samples, whereas no TAG was detected in the human MEV samples.
Sucrose density analysis
EV are classically reported to float at densities between 1.10 and 1.19 g ml–1 in density gradients,[Citation35] which likewise have been the reported flotation density span for both human and bovine MEV.[Citation7,Citation10,Citation15] The density profiles of the present human and bovine MEV isolates were investigated by top-loaded linear sucrose gradient analysis and subsequent Western blotting analysis of the obtained density fractions (). The human fluff MEV density profile of CD63, CD9, CD81, and lactadherin spanned over 1.09–1.20 g ml–1. The profile was more restricted for the human milk serum MEV profile that only spanned from 1.12 to 1.20 g ml–1. Since β-casein was detected in the human milk serum MEV preparation, the proteins’ presence in the human gradients was checked as well. As expected, β-casein was not detectable in the human fluff MEV gradient, whereas the protein was concentrated in the lowest density fraction (1.2 g ml–1) in the milk serum MEV gradient.
Figure 6. MEV sucrose density analysis. The first SEC peak enriched in either fluff or Serum MEV was concentrated by reverse osmosis and applied on the top of a sucrose gradient. The MEV loaded gradients were ultracentrifuged over night at 164,000 g for 18 hours. Fractions were drawn from the top, and their density determined using a densitometer. The fractions were diluted 10 times in PBS and ultracentrifuged at 100,000 g for 70 min to pellet the MEV content. The pellets were analysed for their content of the indicated markers by Western blotting. Abbreviations: hF1, human fluff MEV; hS1, human milk serum MEV; bF1, bovine fluff MEV; bS1, bovine milk serum MEV.
The bovine MEV gradients presented a similar tendency concerning the CD9 pattern compared to the human samples, whereas the CD81 pattern in the bovine fluff MEV gradient was less homogenous and strongest at density 1.13 and 1.17 g ml–1. Conversely, the lactadherin patterns in the two bovine gradients were more similar.
RNA content
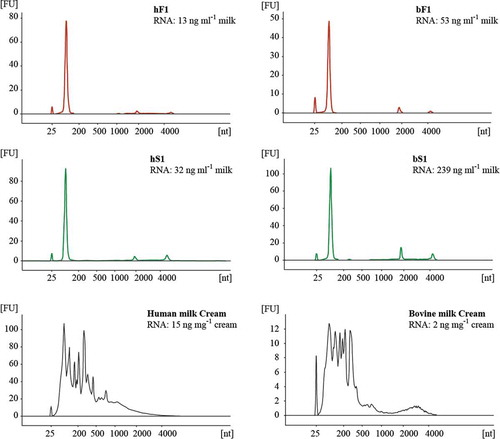
Total RNA profiles were investigated in the MEV isolates, and compared to milk fat globules in the cream fraction of human and bovine origin. Total RNA from −80°C preserved samples, including fluff and milk serum MEV isolates obtained from the same milk lot, was isolated using the miRCURYTM RNA Isolation Kit, and analysed in triplicates on a Agilent RNA 6000 Pico kit chip using a Agilent Bioanalyzer (). Fluff and milk serum MEV RNA profiles were almost identical, with one dominant peak at approximately 100 nucleotides, and two significantly lower peaks eluting at positions corresponding to the ribosomal RNA subunits 18S and 28S. A similar total RNA profile has previously been reported for a bovine MEV isolate.[Citation13] A slightly increased level of ribosomal RNA seemed to be associated with the milk serum MEV fraction. Milk serum MEV isolates were found to be more enriched in RNA in comparison to fluff layer MEV per volume start milk. No significant RNA levels were detected in the later eluting SEC fractions (data not shown). The total RNA MEV profiles are representative for at least three other human milk donors. Significantly different RNA profiles were obtained from the cream containing milk fat globules.
Figure 7. Total RNA profiles for human and bovine MEV and cream fractions. Total RNA contained in fluff (red) and serum (green) MEV fractions were isolated from SEC F1/S1 peaks concentrated by reverse osmosis. Cream was sampled from the first centrifugation of raw milk. RNA extracts were analysed on Agilent RNA 6000 Pico chips using an Agilent Bioanalyzer. The total MEV RNA content was related to the initial start volume of milk (ng ml–1 milk). The peak at 25 nt is an internal standard. Abbreviations: FU, fluorescence units; nt, nucleotides; hF1, human fluff MEV; hS1, human milk serum MEV; bF1, bovine fluff MEV; bS1, bovine milk serum MEV.
MEV yield
summarises the two presented isolation procedures’ MEV yield in protein, particle and RNA content to the volume of start milk. In comparison, Admyre et al. [Citation7] reported a human MEV protein yield of 54 µg ml–1 mature milk. A larger variation in MEV protein yield is reported in two bovine studies; 50 µg ml–1 [Citation20] and 334 µg ml–1.[Citation50] It should be considered that the studies referred to not have assessed possible levels of major milk proteins in their MEV isolates, and the reported protein yields may therefore not purely reflect MEV protein. Bovine MEV RNA yields have previously been reported to 165 ng ml–1.[Citation10]
Table 1. Quantitative data on MEV isolation yield. MEV protein yields are averaged from n-number of isolations. MEV particle yields from nanoparticle tracking analysis (). MEV RNA yields averaged from measurements performed in technical triplicate ().
Discussion
The aim of the present study was to recover as many MEV as possible without compromising EV purity from the primary milk proteins. The investigations included further separation of the membrane rich fluff layer, which previously has been reported as a crude MEV fraction.[Citation8] However, it was necessary to use a 340,000 g ultracentrifugation of the skim milk to collect as much EV material as possible in the soluble fluff layer. The need of such a high speed is most likely due to the high complexity of milk. Even though the fluff layer appears soluble and uncompressed, it is possible that such large g-forces may induce detrimental shear effects on membrane structures. Moreover, some vesicle populations may be trapped in the pellet even though only low levels of the individual four EV markers were detected in this fraction.
To circumvent ultracentrifugation skim milk was centrifuged at only a 20,000 g, which proved sufficient to sediment most of the casein, while leaving the MEV in the supernatant. This supernatant, denoted milk serum, was found to be a suitable and gently treated source for MEV.
Successive application of SEC enabled collection of a well-defined MEV containing peak fraction from both the fluff layer and milk serum (F1 and S1). Residual casein and whey proteins were removed in a very reproducible and comparable manner. The fluff layer has the highest concentration of phospholipid membranes, and that might explain why the first MEV containing fluff peak tends to elute with higher absorbance than the first milk serum peak. Concentration of the MEV containing SEC fractions was accomplished by reverse osmosis. This approach relies on simple water diffusion driven by a concentrated PEG solution that permits a scalable concentration of aqueous EV samples. Reverse osmosis can be considered as a gentle concentration method, and is expected to have minimal impact on EV integrity. The overnight run time of course limits the application of the described SEC set-up for high throughput separation of large number of samples. For smaller volumes of start milk, the isolation method can easily be scaled down by proportionally reducing the column size to the sample volume.
Lactadherin is a noteworthy constituent of MEV and one of the official EV markers.[Citation7,Citation8,Citation51] Indeed, absolute quantification of lactadherin by LC-MS in both of the bovine MEV isolates showed that this protein amounts to approximately 5% of the total MEV protein content (Figure S4). By Western blotting or/and LC-MS it was clear that the first SEC peaks were particularly enriched in lactadherin, whereas the rest of the elution profiles were practically free of the protein. In the bovine profiles, lactadherin was also detected by Western blotting in the second SEC peak. However, from our experience, the used anti-lactadherin IgG preparation is exceptionally sensitive, and we therefore consider the quantification by LC-MS to give a more representative and comparable measure of lactadherin levels.
The convincing enrichment of the tetraspanins CD9, CD63 and CD81 in the first peak supports the effectivity of the SEC step. All three tetraspanins have previously been reported in both human and bovine MEV isolates.[Citation7,Citation8,Citation15] However, faint bands of CD9 and CD63 were present in the second SEC peaks and the pellet derived from the 20,000 g centrifugation of human skim milk. This implies that a minor amount of MEV may be lost, but the clear EV marker enrichment in the first SEC peaks cannot be ignored.
Upon Western blotting, a light band of β-casein was detected in the first human milk serum SEC peak and may reflect that the EDTA destabilization of the casein micelle is not absolute. A higher content of soluble protein in human milk serum in comparison with the fluff layer (data not shown) may account for the small spill over of β-casein. Conversely, the relative casein LC-MS analysis of the bovine SEC profiles did not reveal a significant content of any of the dominant caseins in the bovine MEV containing first peaks. Moreover, the ER marker, calnexin, and the nucleus protein, histone H100, were not detected by LC-MS in the bovine MEV isolates, and may be regarded as a positive indicator for the quality of the preparations (results not shown).
In milk, lactadherin is probably best known as a MFGM component, and its presence in this preparation was therefore expected. Absolute quantification of the lactadherin content in MFGM supports its major abundance as the protein amounts to approximately 20% of the total MFGM protein content (Figure S4). The high abundance of lactadherin in bovine MFGM has previously been confirmed by ELISA (approximately 10%).[Citation38] In human milk, CD9 and CD63 were also detected in the MFGM sample, though to a lesser extent compared to the first SEC peaks. In the bovine samples, levels of the two tetraspanins were much less prominent in the MFGM. This is important to consider when MEV are isolated from cryo-preserved milk samples, because milk fat globules are prone to collapse during freezing and thawing procedures.[Citation29,Citation30] It is not unthinkable that release of MFGM fragments may lead to the formation of contaminating vesicle structures. CD9 have previously been reported as a MFGM component in bovine milk in a proteomic study.[Citation52] CD63 was not detected by Admyre et al. [Citation7] on human milk fat globules by flow cytometry; however, this could be a question of detection limit or accessibility for the applied antibody towards CD63. Importantly, CD81 was not detected in the MFGM sample of either human or bovine origin, and may, therefore, serve as a positive marker for MEV. However, to our knowledge, no true MFGM protein marker has been reported, and it is therefore currently difficult to estimate in this way the contamination of original MFGM material in MEV isolates.
Particle size profiles by NTA of the first SEC peaks showed particles with mode diameters ranging between 100 and 200 nm, which is in reasonable agreement with the vesicle sizes observed by TEM. Human MEV of similar size have been reported by Cryo-EM, supporting the present size observations.[Citation15] In TEM the bovine milk serum MEV appeared more homogeneous in size, while more differently sized vesicles were observed in the bovine fluff MEV preparation. This could indicate that different populations of vesicles are isolated by the two procedures, or that the appearance of larger vesicles in the bovine fluff MEV isolate is induced by the ultracentrifugation. However, the bovine NTA particle size profiles did not give any indications of vesicle fusion in the form of larger particles, and similar size variations were not observed between the two human MEV isolates.
About three times the number of particles was detected in the bovine milk serum MEV isolate as compared to the bovine fluff MEV isolate. Very similar levels of lactadherin, CD63 and CD9 were detected in the two bovine MEV isolates, suggesting that the vesicle density, in proportion to potential contaminating structures, do not vary significantly between the two preparations. This suggests that milk serum is the best MEV source when it comes to EV yield.
The TEM images of bovine milk serum MEV indicate presence of small light particles with a size of approximately 10 nm. These structures hold similarities to high density lipoprotein (HDL) particles, which have been described to be co-isolated with human blood serum EV.[Citation53] Moreover, LC-MS data revealed the presence of the HDL marker apolipoprotein A1 in the bovine milk serum MEV fraction, while the HDL protein not was significantly detected in the corresponding fluff layer isolate (Figure S3). Interestingly, apolipoprotein A1 was observed to be retained in the 340K supernatant during ultracentrifugation and did not significantly co-isolate with the fluff MEV fraction. Nonetheless, the HDL protein have also been listed as a component in a bovine MEV protein report by Reinhardt et al. who isolated MEV from the fluff layer following by two density flotation steps.[Citation8] To our knowledge milk HDL, or lipoproteins in general, have not been considerably reported in the literature, but forthcoming studies may look further into the existence of HDL particles in milk.
Previous reports indicate the presence of tubular structures in vesicle containing milk fractions by cryo-EM [Citation15] and TEM.[Citation6] No such structures were observed in the present TEM survey, and this is most likely due to the introduced SEC step.
MEV were observed to be enriched in the phospholipids sphingomyelin and phosphatidylserine at the expense of phosphatidylcholine in comparison to MFGM. Moreover, there was more phosphatidylethanolamine in the human MEV fractions compared to MFGM. Interestingly, the human milk serum MEV isolates were significantly enriched in sphingomyelin compared to human fluff MEV and MFGM. However, the two analysed human MEV samples were isolated from milk donated by different mothers. Therefore it is necessary to analyse the phospholipid content of more human MEV isolates to assess inter individual variations of human MEV phospholipid classes. Nonetheless, on the whole the different phospholipid content of MEV and MFGM isolates adds to the suggestion that the secretion processes of the two milk structures are different. The present report is, to our knowledge, the first to give information about the phospholipid composition of EV from milk. The findings are in agreement with other studies comparing the phospholipid composition of EV with that from the cellular membranes of their parent cells, reporting an increased content of sphingomyelin and phosphatidylserine in EV derived from e.g. erythrocytes, mast cells, dendritic cells, and prostate cancer cells.[Citation54,Citation55]
The presence of triacylglycerides is a central difference between milk fat globules and other milk associated phospholipid particles, and it is difficult to prepare MFGM isolates without remnants of triacylglycerides.[Citation56] Therefore, triacylglycerides were also present in the analysed MFGM preparations. Importantly, the MEV preparations presented a very low or no content of triacylglycerides. This key result clearly demonstrates that the conducted skimming, centrifugation, and successive SEC efficiently separates milk fat globules at all sizes from the MEV. In contrast, cholesterol was associated with both MFGM and MEV isolates, which is supported by previous studies reporting cholesterol as a significant and important lipid component in the two types of membrane particles.[Citation54–Citation58]
All MEV isolates contained vesicles floating at an expected EV buoyant density span between 1.10 and 1.20 g ml–1. Interestingly, MEV isolates from milk serum seemed to float at a slightly higher and more restricted density span in comparison to MEV isolated from the fluff layer. This observation was particularly evident in the human MEV gradient fractions. This can possibly be explained by the different MEV isolation strategies, which either have resulted in two different but biological original MEV population pools, or that the isolation strategies, such as the ultracentrifugation, have induced changes in the original MEV populations resulting in more diverse MEV flotation densities. However, the more prominent protein bands detected by Western blotting in the human MEV gradient fractions most likely reflect a more pronounced antibody reactivity toward the human antigens compared to the bovine counterparts. In agreement with the β-casein content detected in the human milk serum MEV isolate, this protein was also detected in the density gradient concentrated in the 1.20 g ml–1 fraction. This suggests that this β-casein remnant potentially can be totally separated from MEV fractions by adjusting the gradient and centrifugation time. However, the significance of this minor casein contamination must be individually assessed according to the following use and analysis of the MEV isolate.
All the present MEV isolates showed presence of RNA with a major peak around 100 nucleotides and very low levels of ribosomal RNA. This is in line with a previous bovine milk EV study.[Citation13] In agreement with the high particle content in the milk serum MEV isolates, these isolates were also prominently enriched in RNA per volume start milk. Approximately five times more RNA was isolated from the bovine MEV isolates compared to the human isolates which partly can be explained by the larger particle content in the bovine isolates.
In the work by Lässer et al. [Citation9] six human MEV RNA profiles are presented. These profiles shows a much broader variety of RNAs based on their nucleotide lengths, but are more similar to the MFG RNA profile in the present study as to a the MEV RNA profiles. The discrepancy could relate to the use of different MEV isolation procedures or the fact that they used milk stored at −20°C, which might lead to MFG RNA contamination in the MEV isolates, as mentioned above.
Notably, the total RNA profiles of human and bovine milk cream fractions were significantly different from the MEV isolates, supporting the idea that the biogenesis and purpose of the two milk structures are different. The cream layer of human milk was found to contain more RNA compared to bovine cream. This difference can be explained by a larger content of cytoplasmic crescents in human milk fat globules compared to the content in bovine.[Citation59]
Conclusion
The focus of the present work was to describe an approach that allows isolation of the majority of the EV content in skim milk, and not directly to isolate specific MEV populations. Therefore the obtained and characterised MEV isolates most likely contain various EV subsets, and aspects associated with this are currently under investigation. Milk serum MEV most likely represent the most gently obtained vesicle isolate, and our results show that it also contains the highest concentration of particles and RNA per volume start milk. Therefore we currently identify this MEV isolate of the two tested to be the best representative of the total and original diverse content of MEV in human and bovine milk. However, MEV isolated from the fluff layer may turn out to represent a more pure sample if the presence of high density lipoproteins in milk and in milk serum MEV isolates can be confirmed as a real and significant contaminant in future studies.
Overall, SEC represents a scalable and gentle isolation approach allowing the separation of large as well as small sample volumes of EV material without loss and from both human and bovine milk. The option to isolate from large sample volumes is an advantage when investigating MEV subpopulations, as the chance of detecting MEV subsets naturally increases with the amounts of MEV. A potential application of bovine MEV is as modifiable parcels for drug delivery as they exhibit cross-species tolerance.[Citation50] Applying MEV in therapeutics will require large amounts of pure and high quality vesicle material. Therefore SEC, commonly applied in the industry, represents an attractive approach compared to time consuming procedures involving differential centrifugation and density gradient based isolation approaches restricted in sample volume capacity.
Supplementary_data.pdf
Download PDF (654.9 KB)Acknowledgements
We are grateful to Helle Weber Ravn for valuable guidance in lipid analysis, and Anni Bojsen for excellent technical assistance. We are also grateful to Manja Mobjerg for technical MS assistance.
Disclosure statement
No potential conflict of interest was reported by the authors.
Supplemental material
The supplemental data for this article can be accessed here
Additional information
Funding
Related Research Data
References
- Lönnerdal B. Bioactive proteins in human milk: mechanisms of action. J Pediatr. 2010;156:1–16.
- Chatterton DEW, Nguyen DN, Bering SB, et al. Anti-inflammatory mechanisms of bioactive milk proteins in the intestine of newborns. Int J Biochem Cell Biol. 2013;45:1730–1747.
- Civardi E, Garofoli F, Mazzucchelli I, et al. Enteral nutrition and infections: the role of human milk. Early Hum Dev. 2014;90:57–59.
- Raikos V, Dassios T. Health-promoting properties of bioactive peptides derived from milk proteins in infant food: a review. Dairy Sci Technol. 2014;94:91–101.
- Walker WA, Iyengar RS. Breast milk, microbiota, and intestinal immune homeostasis. Pediatr Res. 2015;77:220–228.
- Stewart P, Puppione D, Patton S. The presence of microvilli and other membrane fragments in the non-fat phase of bovine milk. Cell Tissue Res. 1971;123:161–167.
- Admyre C, Johansson SM, Qazi KR, et al. Exosomes with immune modulatory features are present in human breast milk. J Immunol Baltim Md 1950. 2007;179:1969–1978.
- Reinhardt TA, Lippolis JD, Nonnecke BJ, et al. Bovine milk exosome proteome. J Proteomics. 2012;75:1486–1492.
- Lässer C, Alikhani VS, Ekström K, et al. Human saliva, plasma and breast milk exosomes contain RNA: uptake by macrophages. J Transl Med. 2011;9:9.
- Hata T, Murakami K, Nakatani H, et al. Isolation of bovine milk-derived microvesicles carrying mRNAs and microRNAs. Biochem Biophys Res Commun. 2010;396:528–533.
- Benmoussa A, Lee CHC, Laffont B, et al. Commercial dairy cow milk microRNAs resist digestion under simulated gastrointestinal tract conditions. J Nutr. 2016;146:2206–2215.
- Izumi H, Kosaka N, Shimizu T, et al. Bovine milk contains microRNA and messenger RNA that are stable under degradative conditions. J Dairy Sci. 2012;95:4831–4841.
- Izumi H, Tsuda M, Sato Y, et al. Bovine milk exosomes contain microRNA and mRNA and are taken up by human macrophages. J Dairy Sci. 2015;98:2920–2933.
- Torregrosa Paredes P, Gutzeit C, Johansson S, et al. Differences in exosome populations in human breast milk in relation to allergic sensitization and lifestyle. Allergy. 2014;69:463–471.
- Zonneveld MI, Brisson AR, van Herwijnen MJC, et al. Recovery of extracellular vesicles from human breast milk is influenced by sample collection and vesicle isolation procedures. J Extracell Vesicles. 2014;3:24215.
- van Herwijnen MJC, Zonneveld MI, Goerdayal S, et al. Comprehensive proteomic analysis of human milk-derived extracellular vesicles unveils a novel functional proteome distinct from other milk components. Mol Cell Proteomics MCP. 2016;15:3412–3423.
- Field CJ. The immunological components of human milk and their effect on immune development in infants. J Nutr. 2005;135:1–4.
- Melnik BC, John SM, Schmitz G. Milk: an exosomal microRNA transmitter promoting thymic regulatory T cell maturation preventing the development of atopy? J Transl Med. 2014;12:43.
- Nakatani H, Aoki N, Nakagawa Y, et al. Weaning-induced expression of a milk-fat globule protein, MFG-E8, in mouse mammary glands, as demonstrated by the analyses of its mRNA, protein and phosphatidylserine-binding activity. Biochem J. 2006;395:21–30.
- Sun Q, Chen X, Yu J, et al. Immune modulatory function of abundant immune-related microRNAs in microvesicles from bovine colostrum. Protein Cell. 2013;4:197–210.
- Baier SR, Nguyen C, Xie F, et al. MicroRNAs are absorbed in biologically meaningful amounts from nutritionally relevant doses of cow milk and affect gene expression in peripheral blood mononuclear cells, HEK-293 kidney cell cultures, and mouse livers. J Nutr. 2014;144:1495–1500.
- Auerbach A, Vyas G, Li A, et al. Uptake of dietary milk miRNAs by adult humans: a validation study. F1000Research. 2016;5:721.
- Mather IH, Keenan TW. Origin and secretion of milk lipids. J Mammary Gland Biol Neoplasia. 1998;3:259–273.
- McMahon DJ, Oommen BS. Supramolecular structure of the casein micelle. J Dairy Sci. 2008;91:1709–1721.
- Patton S, Keenan TW. The relationship of milk phospholipids to membranes of the secretory cell. Lipids. 1971;6:58–61.
- Hernell O. Human milk vs. cow’s milk and the evolution of infant formulas. Nestlé Nutr Workshop Ser Paediatr Programme. 2011;67:17–28.
- Fox PF, McSweeney PLH. Dairy chemistry and biochemistry. London: Thomson Science; 1998. p. 181.
- Yamada T, Inoshima Y, Matsuda T, et al. Comparison of methods for isolating exosomes from bovine milk. J Vet Med Sci. 2012;74:1523–1525.
- Keenan TW, Morré DJ, Olson DE, et al. Biochemical and morphological comparison of plasma membrane and milk fat globule membrane from bovine mammary gland. J Cell Biol. 1970;44:80–93.
- Kobylka D, Carraway KL. Proteins and glycoproteins of the milk fat globule membrane. Biochim Biophys Acta. 1972;288:282–295.
- Lozano-Ramos I, Bancu I, Oliveira-Tercero A, et al. Size-exclusion chromatography-based enrichment of extracellular vesicles from urine samples. J Extracell Vesicles. 2015;4:27369.
- Böing AN, van der Pol E, Grootemaat AE, et al. Single-step isolation of extracellular vesicles by size-exclusion chromatography. J Extracell Vesicles. 2014;3:23430.
- Welton JL, Webber JP, Botos L-A, et al. Ready-made chromatography columns for extracellular vesicle isolation from plasma. J Extracell Vesicles. 2015;4:27269.
- Taylor DD, Shah S. Methods of isolating extracellular vesicles impact down-stream analyses of their cargoes. Methods San Diego Calif. 2015;87:3–10.
- Witwer KW, Buzás EI, Bemis LT, et al. Standardization of sample collection, isolation and analysis methods in extracellular vesicle research. J Extracell Vesicles. 2013;2:20360.
- Huston GE, Patton S. Membrane distribution in human milks throughout lactation as revealed by phospholipid and cholesterol analyses. J Pediatr Gastroenterol Nutr. 1986;5:602–607.
- Hvarregaard J, Andersen MH, Berglund L, et al. Characterization of glycoprotein PAS-6/7 from membranes of bovine milk fat globules. Eur J Biochem FEBS. 1996;240:628–636.
- Kvistgaard AS, Pallesen LT, Arias CF, et al. Inhibitory effects of human and bovine milk constituents on rotavirus infections. J Dairy Sci. 2004;87:4088–4096.
- Schacterle GR, Pollack RL. A simplified method for the quantitative assay of small amounts of protein in biologic material. Anal Biochem. 1973;51:654–655.
- Dragovic RA, Gardiner C, Brooks AS, et al. Sizing and phenotyping of cellular vesicles using nanoparticle tracking analysis. Nanomedicine Nanotechnol Biol Med. 2011;7:780–788.
- Tao H, Lee SC, Moeller A, et al. Engineered nanostructured β-sheet peptides protect membrane proteins. Nat Methods. 2013;10:759–761.
- Suloway C, Pulokas J, Fellmann D, et al. Automated molecular microscopy: the new leginon system. J Struct Biol. 2005;151:41–60.
- Kishimoto K, Urade R, Ogawa T, et al. Nondestructive quantification of neutral lipids by thin-layer chromatography and laser-fluorescent scanning: suitable methods for “lipidome” analysis. Biochem Biophys Res Commun. 2001;281:657–662.
- Lässer C. Identification and analysis of circulating exosomal microRNA in human body fluids. Methods Mol Biol Clifton NJ. 2013;1024:109–128.
- Jeppesen DK, Hvam ML, Primdahl-Bengtson B, et al. Comparative analysis of discrete exosome fractions obtained by differential centrifugation. J Extracell Vesicles. 2014;3:25011.
- Fox PF, McSweeney PLH. Dairy chemistry and biochemistry. London: Thomson Science; 1998. p. 180–182.
- Bezkorovainy A. Human milk and colostrum proteins: a review. J Dairy Sci. 1977;60:1023–1037.
- Fox PF, McSweeney PLH. Dairy chemistry and biochemistry. London: Thomson Science; 1998. p. 149.
- Contarini G, Povolo M. Phospholipids in milk fat: composition, biological and technological significance, and analytical strategies. Int J Mol Sci. 2013;14:2808–2831.
- Munagala R, Aqil F, Jeyabalan J, et al. Bovine milk-derived exosomes for drug delivery. Cancer Lett. 2016;371:48–61.
- Lötvall J, Hill AF, Hochberg F, et al. Minimal experimental requirements for definition of extracellular vesicles and their functions: a position statement from the International Society for Extracellular Vesicles. J Extracell Vesicles. 2014;3:26913.
- Yang Y, Zheng N, Zhao X, et al. Proteomic characterization and comparison of mammalian milk fat globule proteomes by iTRAQ analysis. J Proteomics. 2015;116C:34–43.
- Yuana Y, Levels J, Grootemaat A, et al. Co-isolation of extracellular vesicles and high-density lipoproteins using density gradient ultracentrifugation. J Extracell Vesicles. 2014;3:23262.
- Subra C, Laulagnier K, Perret B, et al. Exosome lipidomics unravels lipid sorting at the level of multivesicular bodies. Biochimie. 2007;89:205–212.
- Llorente A, Skotland T, Sylvänne T, et al. Molecular lipidomics of exosomes released by PC-3 prostate cancer cells. Biochim Biophys Acta. 2013;1831:1302–1309.
- Fong BY, Norris CS, MacGibbon AKH. Protein and lipid composition of bovine milk-fat-globule membrane. Int Dairy J. 2007;17:275–288.
- Laulagnier K, Motta C, Hamdi S, et al. Mast cell- and dendritic cell-derived exosomes display a specific lipid composition and an unusual membrane organization. Biochem J. 2004;380:161–171.
- Llorente A, van Deurs B, Sandvig K. Cholesterol regulates prostasome release from secretory lysosomes in PC-3 human prostate cancer cells. Eur J Cell Biol. 2007;86:405–415.
- Huston GE, Patton S. Factors related to the formation of cytoplasmic crescents on milk fat globules. J Dairy Sci. 1990;73:2061–2066.