
 ?Mathematical formulae have been encoded as MathML and are displayed in this HTML version using MathJax in order to improve their display. Uncheck the box to turn MathJax off. This feature requires Javascript. Click on a formula to zoom.
ABSTRACT
Little is known about the composition and functional differences between extracellular vesicle (EV) subsets, such as microvesicles (MVs) and exosomes (EXOs), nor to what extent their cargo reflects the phenotypic state of the cell of origin. Brain endothelial cells are the constitutive part of the blood–brain barrier (BBB), a selective barrier that maintains brain homeostasis. BBB impairment is associated with several neuroinflammatory diseases with the pro-inflammatory cytokine tumour necrosis factor (TNF) often playing a key role. In the present study, shotgun proteomics and parallel reaction monitoring (PRM)-based targeted mass spectrometry were used to characterise brain endothelial cell-released EVs, and to study how TNF exposure modulated EV protein cargoes. MVs were found to be enriched in mitochondrial and cytoskeletal proteins, whereas EXOs were enriched in adhesion, histone and ribosomal proteins. After stimulation with TNF, several proteins involved in TNF and NF-κB signalling pathways, that were found to be differentially expressed in cells, were also differentially expressed in both MVs and EXOs. Thus, our results revealed some novel proteins as potentially useful candidates for discriminating between MVs and EXOs, together with additional evidence that cells “package” proteins in EVs systematically and according to their phenotypic state.
Responsible Editor Andrew Hill, La Trobe University, Australia
Introduction
Extracellular vesicles (EVs) are naturally released membrane vesicles that can be classified into three groups: exosomes (EXOs), microvesicles (MVs) and apoptotic bodies (ABs).[Citation1,Citation2] Each subset is categorised according to its size, biological origin and function: ABs (800–5000 nm) are released by the cells undergoing apoptosis; MVs (100–1000 nm) are produced by the outward budding of the plasma membrane; and EXOs (40–120 nm) are released from the multivesicular endosomes (MVE). The isolation and separation of different types of EVs is often carried out using differential centrifugation, relying on the size and density differences between EV subsets, and is sometimes complemented by immune-affinity precipitation or filtration steps.[Citation3] In recent years, research on EVs has increased exponentially, yet few studies have compared the contents of MVs and EXOs released by the same cell.[Citation3–Citation5] EVs mediate cell–cell communication by delivering their cargo, mostly RNAs and proteins, to receiving cells, and they play critical roles in many physiological and pathological processes.[Citation6–Citation11] Since MVs and EXOs have different intracellular origins, it has been suggested that they may have different functional roles.[Citation12] There is little definite information on this, however. Also, because EVs contain genetic material from their cell of origin, some studies have suggested that their cargoes may reflect the pathophysiological state of that cell of origin.[Citation13,Citation14] Thus, EVs have recently generated considerable interest for their potential use in biomarker discovery research,[Citation15–Citation17] and in the context of neuroinflammatory diseases some studies have proposed EVs as promising blood-biomarker carriers for Alzheimer’s [Citation18] and Parkinson’s [Citation19] diseases.
In recent years, EVs have been isolated from almost every type of cell, but there has been little investigation of their release from brain endothelial cells.[Citation20] The interest in studying EVs released by these particular cells is related to their central role as a constitutive part of the blood–brain barrier (BBB). The BBB is an effective and selective barrier; it is the interface between the cerebrovascular and central nervous systems and has a crucial role in maintaining brain homeostasis and protecting the brain against neurotoxic substances. BBB dysfunction has been related to many disorders, such as stroke, multiple sclerosis, Alzheimer’s and Parkinson’s diseases.[Citation21–Citation24] Neuroinflammation is often a prerequisite for, or consequence of, the onset of many of these diseases, with cytokines playing a crucial role.[Citation25,Citation26] TNF is one of the most studied cytokines and has been shown to affect the survival, proliferation and differentiation of cells by mediating a broad range of functions linked to a variety of inflammatory and autoimmune diseases.[Citation27–Citation29] TNF is known to increase BBB permeability and to enhance the expression of endothelial adhesion molecules, such as vascular cell adhesion molecule-1 (VCAM1), intracellular adhesion molecule-1 (ICAM1) and E-selectin. Over-expression of these proteins is responsible for the transmigration of immune cells into the brain and these events are often decisive in a wide range of neuroinflammatory diseases such as multiple sclerosis.[Citation30]
Since EVs are also known for their potential to induce phenotypic changes in target cells,[Citation31] EVs released by an inflamed BBB may have an adverse impact on the physiology of neighbouring cells such as astrocytes, pericytes and microglia. At the same time, the content of EVs derived from the BBB and subsequently found in blood may provide important information about the early stages of neuroinflammatory processes and diseases.
In the present study, we isolated and characterised MVs and EXOs derived from human brain endothelial cells and identified their protein profiles using mass spectrometry (MS)-based shotgun proteomics. TNF was used to activate the cells, and then the protein cargoes modulation in MVs and EXOs was quantified using a label-free approach. Finally, exosomal markers (CD81, CD9, PDCD6IP, SDCB1), proposed microvesicles markers (ATP5A1, RACGAP1 and SEPT2), and proteins that were shown to be significantly and differentially expressed after TNF both in cells and EVs (ICAM1, VCAM1, STAT1, SOD2, PTX3, ENG, NFKB2) were validated by targeted proteomics using parallel reaction monitoring (PRM) analysis.
Material and methods
Cell culture
hCMEC/D3 human cerebral microvascular endothelial cells (Merck Millipore, Darmstadt, Germany) were seeded onto rat tail collagen type I (Merck Millipore) coated flasks and maintained in complete endothelial cell growth medium-2 (EGM-2MV BulletKit, Lonza, Basel, Switzerland) at 37°C in 5% CO2. Cells were grown until 70–80% confluency in six T-225 flasks. They were then washed three times with phosphate-buffered saline (PBS) solution containing calcium and magnesium, and incubated at 37°C with 32 ml of EGM-2MV containing 5% of heat-inactivated exosome-depleted foetal bovine serum (Gibco/Thermo FisherScientific, Waltham, MA, USA) for 24 h. Three flasks were stimulated with 10 ng ml–1 TNF (Enzo Life Sciences, Farmingdale, NY, USA). After 24 h of incubation, the supernatant was collected for isolating the EVs. TNF at 10 ng ml–1 was used since it was previously shown that this concentration does not induce endothelial cell apoptosis.[Citation32] Cells were detached using Stempro Accutase (Gibco), washed four times with PBS, pelleted and stored at −80°C. This workflow was repeated twice, resulting in six flasks/samples of cells per condition (± TNF) and two samples of EVs per condition since the supernatants from three flasks were pooled as described below.
Vesicle isolation
About 13–18 million human brain endothelial cells were cultured in each T-225 flask with EGM-2MV complemented with exosome-depleted foetal bovine serum. After 24 h of incubation, MVs and EXOs were isolated by differential centrifugation using a slightly modified protocol from that described elsewhere.[Citation4] No filtration step was included in the EV isolation protocol since hCMEC/D3 cells released few vesicles under normal conditions and filtration would have further decreased the vesicle yield.
Thirty-two ml of supernatant were recovered, and cells (300 g, 10 min, 4°C) and apoptotic bodies (2000 g, 20 min, 4°C) were removed. MVs were collected by centrifuging the supernatant (18,000 g, 45 min, 4°C) using an Optima XL-100 K and an SW32 rotor (Beckman Coulter, Brea, CA, USA). Finally, EXOs were isolated using ultracentrifugation (100,000 g, 120 min, 4°C). Crude MVs and EXOs were resuspended in PBS and three samples were pooled. Pooled EVs were successively re-centrifuged using an SW55 rotor. By using the SW55 rotor, centrifugation time could be adjusted according to the k-factor for MVs (18,000 g, 30 min, 4°C) and EXOs (100,000 g, 70 min, 4°C). Isolated EV pellets were either resuspended in 40 μl of 0.2 μm-filtered PBS for electron microscopy and nanoparticle tracking analysis (NTA), or dry stored at −80°C.
Transmission electron microscopy (TEM)
TEM samples were prepared using a previously publish protocol.[Citation33] EVs were fixed in 2% paraformaldehyde (PFA) and placed on a formvar-coated TEM grid for 20 min. Grids were subsequently washed with PBS and 1% glutaraldehyde was added for 5 min. After washing the grids with distilled water, vesicles were contrasted and embedded using uranyl-oxalate and methyl-cellulose-uranyl-acetate solution, respectively. EVs were examined using a Morgagni Transmission Electron Microscope (FEI Company, Eindhoven, Netherlands) at 80 kV.
Nanoparticle tracking analysis (NTA)
NTA was carried out using a NanoSight LM14 instrument (Malvern Instruments, Malvern, UK). Vesicles were diluted to 8 µg of proteins ml–1 with 0.2 µm-filtered PBS prior to analysis. The camera level was set to 15. Samples were analysed using NTA 2.3 software, and the threshold was set to 10. Minimum expected particle size, blur and minimum track length were set automatically, and background extraction was enabled. Five measurements were taken for each sample, and average and standard deviation were calculated and plotted using GraphPad Prism 7 software (GraphPad Software, San Diego, CA, USA).
Protein extraction and quantification
Cell and EV pellets were resuspended in 60 μl of 0.2% Rapigest (Waters, Milford, MA, USA) 100 mM TEAB (Sigma-Aldrich , St. Louis, MO, USA), incubated 10 min at 80°C and then sonicated (five cycles of 20 s with breaks on ice). Samples were then spun down (14,000 g, 10 min, 4°C) and the supernatant was recovered. Protein content was measured using the Bradford assay (Bio-Rad, Hercules, CA, USA).
Immunoblotting
The equivalent of 10 μg of proteins were separated using electrophoresis on a 10%T/2.6%C polyacrylamide gel and were subsequently transferred onto a PVDF membrane. Membranes were stained with amido-black to highlight the proteins and washed with water to remove the excess. Immunoblot assays were performed using an anti-human antibody against PDCD6IP (Biolegend, San Diego, CA, USA) at a dilution of 1:500 and anti-human GRP94 (at dilution of 1:200) (Biolegend).
Sample preparation for mass spectrometry
For each sample, 10 μg of proteins were reduced using tris(2-carboxyethyl)phosphine (5 mM, 60 min, 37°C) and alkylated using iodoacetamide (15 mM, 60 min, RT) in dark conditions. Proteins were digested overnight using trypsin (w/w ratio 1:50). Samples were subsequently incubated with 0.5% trifluoroacetic acid (Sigma) (45 min, 37°C) in order to cleave the Rapigest surfactant. Samples were desalted on C18 reverse phase columns (Harvard Apparatus, Holliston, MA, USA). Peptides were lyophilised and subsequently resuspended in 5% ACN 0.1% FA before MS analysis.
Shotgun proteomics
For cell samples, six replicates per condition (± TNF) were injected once, and two pools of cells (one for each condition) were injected three times to address the technical variability of the instrument. For the analysis of EVs, the resulting two samples per condition (as consequences of the pooling during differential centrifugation) were injected twice each time.
Peptides were analysed by Liquid Chromatography–Electrospray Ionisation–MS/MS (LC-ESI-MS/MS) on an Orbitrap Fusion Lumos Tribrid mass spectrometer (Thermo Fisher Scientific, Waltham, MA, USA) equipped with a NanoAcquity system (Waters). Peptides were trapped on a home-made 5 μm 200 Å Magic C18 AQ (Michrom Biosciences, Auburn, CA, USA) 0.1 × 20 mm pre-column and separated on a commercial 0.075 × 150 mm Nikkyo (Nikkyo Technology, Japan) analytical nanocolumn (C18, 5 μm, 100 Å). The analytical separation was run for 60 min using a gradient of H2O/FA 99.9%/0.1% (solvent A) and CH3CN/FA 99.9%/0.1% (solvent B). The gradient was run as follows: 97% A and 3% B from 0 to 1 min, then 65% A and 35% B for 60 min, and finally 20% A and 80% B until 71 min at a flow rate of 220 nl min–1. MS data were acquired with an m/z window from 400 to 2000, in the MS2 data-dependent acquisition mode. Maximum total cycle time was limited to 3 s. The most intense precursors selected from FT MS1 full scan (resolution 120,000 FWHM at m/z 200) were quadrupole-isolated and fragmented by HCD and detected in the dual-pressure ion trap (IT). The AGC target value was set to 4e5 for MS1 and 1e4 (IT) for MS2; maximum injection times of 50 and 35 ms were used for MS1 and MS2, respectively.
Proteins were quantified by processing MS data using Progenesis QI software (Nonlinear Dynamics, Newcastle, UK). Raw data were imported and m/z and RT values from each run were aligned against a reference run. A general peak list file containing all the detected features with charges of +2, +3 or +4 was exported and queried against the UniProtKB/Swiss-Prot database (Release March 2015; 547,964 sequences) using Mascot (version 2.5, MatrixScience, Boston, MA, USA). Peptide identifications (FDR 1%) were imported into Progenesis QI and the identified peptides were matched to the relative features. Peak abundances were extracted by integrating the area under the peak curve. Each peptide abundance was normalised by the total abundance of all identified peptides for each run and protein abundance was calculated by summing all unique normalised peptide ion abundances for each protein (min peptides 2).
Protein abundances were exported from Progenesis QI software and analysed using R software. Given the structure of the data, the statistical analysis was performed using a two-way analysis of variance (ANOVA) in order to consider the different levels of variance. Data were log-transformed before the analysis. Proteins were considered significant and differentially expressed with a p-value lower than 0.01 and an absolute fold-change higher than 1.5 (p < 0.01, |FC|> 1.5).
Targeted analysis by parallel reaction monitoring (PRM)
For PRM, cells and EVs from three flasks were pooled for each condition (± TNF) and peptides were analysed with two technical replicates.
PRM analysis was carried out on a Q Exactive Plus (Thermo Fisher Scientific, Waltham, MA, USA) mass spectrometer equipped with a Thermo EASY-nLC coupled with an EASY-Spray source operating at 1.8 kV in positive ion mode. Peptides were trapped at on a 2 cm × 75 µm i.d., PepMap C18 precolumn packed with 3 µm particles and 100 Å pore size. Then, separation was achieved in a 50 cm × 75 µm i.d., PepMap C18 column packed with 2 µm, 100 Å particles and heated at 50°C. The analytical separation was run for 60 min using a gradient of H2O/FA 99.9%/0.1% (solvent A) and CH3CN/FA 99.9%/0.1% (solvent B) at a flow rate of 250 nl min–1.
The gradient programme was run as follows: 5% B at 5 min; ramping to 35% B in 55 min; rapid ramping to 90% B over 10 min and washing column for 15 min. The column was re-equilibrated to 5% B for 24 min after each run. Thirty-one target masses (+2, +3 charge state) were chosen based on stability, sequence and signal. A full scan with a resolution of 70,000 at 200 m/z was followed by 31 PRM scans at a resolution of 17,500 at 200 m/z with an isolation width of 1.6 m/z, an AGC target of 2 × 10⁵, a maximum injection time of 50 ms and a normalised collision energy of 27% in a higher-energy c-trap dissociation (HCD) cell. PRM data were analysed using Skyline v3.5 software.[Citation34] In order to confirm the identity of the peptides, PRM data were matched against a spectral library of annotated reference MS/MS spectra that was created from a dataset previously generated by a classical data dependent acquisition (DDA) approach. A spectral library was also generated using peptide tandem mass spectra from NIST database (http://chemdata.nist.gov/). Peak peaking was manually checked and corrected in accordance to the retention time, transitions, mass accuracy and MS/MS spectra. At least three transitions were considered for each peptide. Peptides were quantified by summing the peak areas under curve (AUC) of each transition. Missing values, resulting from peptides whose abundance was under the limit of quantification, were imputed as having half of the lowest detectable peptide abundance. Peptides abundance was normalised based on the total ion current (TIC) extracted from the full scan acquisition for each run. Proteins were quantified by summing the abundances of the selected peptides. Level of significance was addressed by performing a Student’s two-tailed t-test.
Gene ontology (GO) and pathway analysis
All proteins identified and quantified in each group (cells, MVs and EXOs) were classified for GO annotations. GO analysis was performed using the Cytoscape software ClueGO plug-in.[Citation35] ClueGO was chosen because it allows to focus on specific levels of the GO hierarchy structure, extract non-redundant biological information, fuse related terms that have similarly associated genes, and group terms based on their kappa score. All the significant (p < 0.01) GO terms identified in cells, MVs and EXOs were compared and displayed with the aid of a heat map showing the –log10 (p-value) for each GO term. GO terms were grouped and only the most significant term in each group was displayed. When a GO term was found in two or more groups, the most significant term for each group was shown. GO analysis was performed using all the experimental evidence. The following parameters were selected: GO term-fusion was enabled; a GO tree interval between levels 3 and 8 was selected; GO terms with at least three proteins and 4% of proteins were chosen and a kappa score of 0.4 was selected. The p-value was calculated using a two-sided hypergeometric test and corrected with a Bonferroni step down. Only GO terms with a p-value < 0.01 were selected. GO terms were grouped based on their kappa score, with an initial group size of 1 and a group merge of 50%.
Differentially expressed proteins (p < 0.01, |FC|> 1.5) found in cells, MVs and EXOs were mapped into cell-signalling and metabolic pathways using Ingenuity Pathway Analysis (IPA) software (Qiagen, Redwood City, CA, USA). Protein identifiers and their corresponding fold-change were uploaded into IPA and the core-analysis was performed. The canonical pathways and upstream regulators retrieved were considered significant, and highly up- or downregulated, with a p < 0.01 and an absolute z-score higher than 0.5. The IPA z-score predicts the activation or inhibition of a given signalling pathway or upstream regulator. The association between the differential proteins and the canonical pathway was measured by taking into account the ratio of the number of proteins from our dataset that were mapped into a pathway divided by the total number of proteins in that pathway. Fischer’s exact test was used to calculate a p-value expressing the probability that the association between the proteins that were found to be differential and the canonical pathway was due to random change.
Results
Characterisation of the EVs derived from human brain endothelial cells
MVs and EXOs were isolated using differential centrifugation, as described in ). Because of the current general lack of agreement existing around the definition of the EV subsets,[Citation36] this study describes MVs as samples enriched with vesicles isolated at 18,000 g, and EXOs as samples enriched with vesicles isolated at 100,000 g.
Figure 1. EV isolation and characterisation. (a) Microvesicles (MVs) and exosomes (EXOs) were isolated from the culture medium using differential centrifugation. (b) Western blot was performed on cell, MVs and EXOs by analysing the same amount of proteins. PDCD6IP was used as a marker for EVs, and GRP94 as a negative control for EXOs. (c) Size distribution of the two subsets. The average was calculated from five different measurements and plotted (line) together with the standard deviation (SD) (area). (d) Electron microscopy analysis of EVs. Scale bar represents 100 nm.
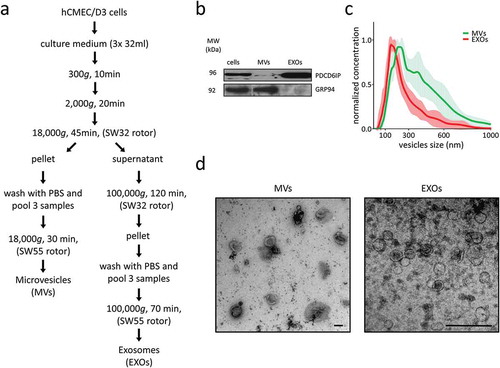
About 50 × 106 brain endothelial cells were used to isolate about 25 µg of proteins for MVs and EXOs. Immunoblotting was used to identify the exosomal markers PDCD6IP and a protein commonly used to describe the purity of the exosome isolate (in this case GRP94 or endoplasmin (HSP90B1)) ()). PDCD6IP (also known as ALIX) is a protein involved in the concentration and sorting of cargo proteins in the multivesicular body (MVB), and is therefore directly involved in exosome biogenesis. PDCD6IP was enriched in EXOs preparation and also present to a lesser extent in the MVs sample. GRP94 was absent in EXOs while highly enriched in MVs.
NTA was used to analyse the vesicle size-distribution within samples. The EXO samples presented a curve typical of exosomes, with a peak in correspondence at 150 nm, whereas MVs samples appeared more polydisperse, showing two corresponding peaks at 215 and 375 nm ()).
Analysis using TEM revealed that the EXO samples collected at 100,000 g contained vesicles mostly ranging from 40 to 120 nm, whereas the MV samples collected at 18,000 g were enriched in vesicles ranging from 150 to 300 nm ()).
The differences in vesicle sizes observed between NTA and TEM may be related to shrinkage artefacts during fixation in the preparation for TEM.
TNF is known to increase the vesiculation rate,[Citation32] and our results suggested that after TNF exposure cells secreted at least twice as much vesicles compared to not stimulated cells. This was measured in term of µg of EV proteins by the Bradford assay. In addition, NTA showed that TNF do not alters the size distribution of neither MVs nor EXOs (data not shown).
Shotgun MS proteomic analysis of EVs
Proteins were extracted from each sample (cells, MVs, EXOs) and condition (± TNF), and were then digested and analysed using LC-MS/MS ()). For cells, each sample was injected once; the technical reproducibility of this method was assessed by injecting two pools three times (one for each condition, ± TNF). For MVs and EXOs, each sample was injected twice. Proteins were identified and quantified with a label-free approach using Progenesis QI software.
Figure 2. (a) Workflow overview. (b) Venn diagrams displaying the total number of proteins identified in cells, MVs and EXOs (≥ 2 peptides). Complete list of all identified proteins is found in Supplementary Table 1.
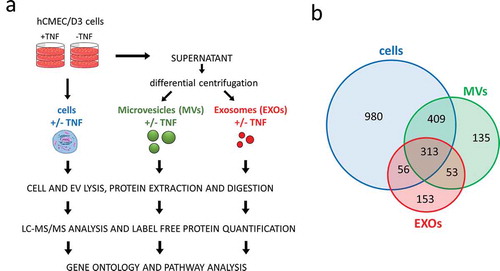
A total of 1758 proteins (≥ 2 peptides) were identified and quantified from the cells, with an average squared Pearson correlation coefficient of R2 = 0.992; 910 proteins (≥ 2 peptides, R2 = 0.998) were quantified from the MVs; and 575 proteins (≥ 2 peptides, R2 = 0.999) were quantified from the EXOs ()) (– and Supplementary Table 1).
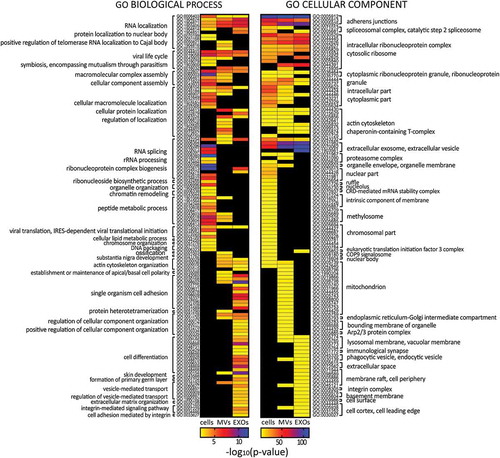
Figure 3. Heat maps displaying significant (p < 0.01) GO terms for biological processes and cellular components. GO terms were functionally grouped based on kappa scores and only the most significant GO terms were displayed. The significance of each GO term was displayed as -log10 (p-value).
Overall, MVs and EXOs shared 366 proteins, whereas 544 and 206 were uniquely found in MVs and EXOs, respectively. Almost all the proteins identified were annotated in Vesiclepedia [Citation1] (data not shown). Proteins commonly identified in both EV subsets included ribosomal proteins, annexins, integrins, heat shock proteins, G-proteins and Ras-related. The 544 proteins exclusively identified in MVs included mitochondrial (e.g. SOD2, MRPS22, MRPL13, ATP5A1), endoplasmic (e.g. ERAP1, ERAP2, ERP29, ERP44, ERGIC1), cytoskeleton-related proteins (e.g. TUBA1C, TUBB2B, ACTR2, MYH10, RACGAP1, SEPT2) and proteins involved in protein degradation (e.g. UBQLN4, PSMC1, PSMC6, PSMD1, ADRM1, PSMA2). In contrast, tetraspanins (e.g. TSPAN3, TSPAN5, TSPAN9, TSPAN14), histones (e.g. HIST1H1D, HIST1H1B) and proteins involved in exosome biogenesis (SDC4, SDCBP, VPS4A, VPS37C) were exclusively found in EXOs.
The majority of the proteins found in EVs were also detectable in cells; however, 188 of the 910 proteins found in MVs and 206 of the 575 found in EXOs were not detected in the cells, probably due to their low abundance in the whole-cell lysate.
In order to have an overall view of the protein content in each EV subset, GO enrichment analysis was carried out for biological processes and cellular components (). Results showed that cells, MVs and EXOs shared several GO terms, but with different degrees of significance. EXOs samples were found to be particularly enriched in ribosomal proteins, in proteins belonging to extracellular vesicles, lysosomal membrane, adherens junctions and integrins. Proteins related to mitochondrion, endoplasmic reticulum and actin cytoskeleton were instead found to be more enriched in MV samples.
For biological processes, GO terms related to RNA localisation were found enriched in all the groups, but more significantly in EXOs. GO terms related to cell differentiation, cell adhesion, integrin signalling and vesicle-mediated transport were found enriched only in EXOs, whereas proteins involved in cell polarity were found only in MVs. Cell adhesion-related proteins were found in both MVs and EXOs, but were more significantly enriched in the latter. For biological processes, cells shared 20 GO terms with MVs and 12 with EXOs, while for cellular components 31 GO terms were shared between cells and MVs, and 21 between cells and EXOs.
In addition, a more quantitative analysis was performed in order to determine whether there were similarities in the expression of common proteins among cells, MVs and EXOs. Results showed that there was a very weak correlation between MVs and cells (squared Pearson correlation coefficient R2 = 0.25) and no correlation between cells and EXOs (R2 = 0.01) as well as between MVs and EXOs (R2 = 0.02) (data not shown).
Modulation of EV protein cargoes induced by TNF exposure
In order to study how the proteomes of MVs and EXOs are modulated after brain endothelial cells are activated by TNF, proteins in samples exposed to TNF were compared to non-exposed samples from each group (cells, MVs, EXOs). Significant and differentially expressed proteins were selected by performing a two-way ANOVA, using a p-value < 0.01 and |FC|> 1.5. Seventy-five proteins were found to be differentially expressed in cells, 323 in MVs and 219 in EXOs ()) (Supplementary Table 2). These numbers corresponded to 4.3% of the total number of identified and quantified proteins from cells, 35.5% of those from MVs and 38.1% of those from EXOs.
Figure 4. (a) Venn diagram displaying differentially expressed proteins after exposure to TNF in different samples: cells, MVs and EXOs. For detailed list see Supplementary Table 2. (b) Comparison of the fold-change (FC) of proteins found to be significantly up- or downregulated after exposure to TNF (p < 0.01, |FC|> 1.5) in both cells and EVs. The significant IPA canonical pathways enriched in cell (c), MV (d) and EXO (e) samples. The significance (–log10 (p-value)) for each pathway are displayed. (f) Heat map showing the results of the IPA upstream regulator analysis.
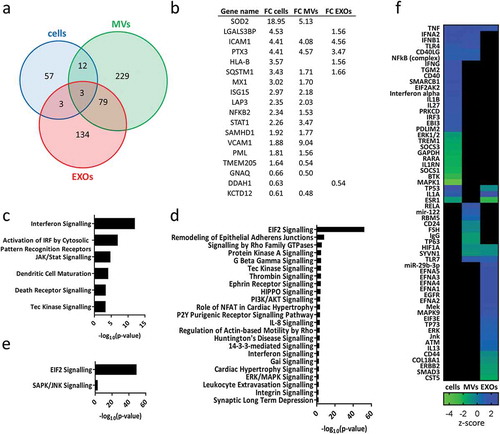
Of the 75 proteins found to be significantly upregulated or downregulated in cells, 18 (24%) were also found to be differential in at least one of the EV subsets. Proteins found to be significant and differentially expressed in cells and EVs displayed similar fold-changes within the groups ()). Most of these proteins were shared by cells and MVs, and a few differential proteins were found exclusively in cells and EXOs. Several of these proteins were found to belong to the TNF and NF-κB signalling pathways. SOD2,[Citation37] MX1,[Citation38] ISG15,[Citation39] SAMHD1 [Citation40] and STAT1 [Citation41] are all known to be upregulated in response to TNF. SQSTM1 has been described as mediating the activation of NF-κB in response to upstream signals such as TNF.[Citation42] NF-κB, which is found differentially expressed in cells and MVs, also mediates the stimulation of adhesion molecules ICAM1 and VCAM1,[Citation43] found differentially expressed in cells and EVs. Epidermal growth factor receptor (EGFR), which is known to activate several signalling cascades and to be upregulated by TNF,[Citation44] was also found to be significantly expressed in EXOs, with a fold-change close to the threshold (FC = 1.47).
Among the differentially expressed proteins in MVs and EXOs, we identified several functionally active proteins, such as: amyloid beta A4 protein (APP) highly downregulated in MVs; metalloproteinases (ADA15, ADA17) upregulated in EXOs; eukaryotic translation initiation factors (EIFs) notably upregulated in EXOs; and several heterogeneous nuclear ribonucleoproteins (hnRNPs) particularly upregulated in EXOs.
Proteins differentially expressed in cells were mapped onto biological pathways related to immune response and signal transduction with interferon signalling found to be the most significant pathway ()).
Pathway analysis was also performed using differential proteins found in MVs and EXOs. In MVs, proteins were mapped with the highest significance onto the eukaryotic initiation factor (EIF2) signalling pathway, followed by pathways related to the immune-response and signal-transduction (IL-8, interferon, rho family GTPases, G beta gamma, PI3K/AKT and integrin signalling, among others) ()). Interestingly, Tec kinase signalling and interferon signalling were significant in both cells and MVs. Differential proteins belonging to EXOs were mapped onto only two biological pathways, EIF2 and SAPK/JNK signalling ()).
IPA software also enables the identification of upstream regulators, e.g. transcriptional regulators that can explain the observed changes in gene/protein expression.[Citation45] ) shows the combined results for cells, MVs and EXOs of the most significant and influential upstream regulators (p < 0.01, |z-score|> 0.5). Based on the differential proteins provided by our dataset, the prediction that TNF was a possible upstream regulator of both MVs and EXOs turned out to be correct.
Parallel reaction monitoring
The abundance of proteins of interest was confirmed by targeted proteomics using parallel reaction monitoring (PRM) analysis. Canonical exosomal proteins (CD81, CD9, PDCD6IP, SDCB1), cytoskeleton-related proteins and mitochondrial proteins that were suggested to be enriched in MVs (ATP5A1, RACGAP1and SEPT2) (), and proteins that were shown to be significantly and differentially expressed after TNF both in cells and EVs (ICAM1, VCAM1, STAT1, SOD2, PTX3, EGN, NFKB2) (), were selected for verification. Between one and three peptides were chosen for each protein (Supplementary Table 3). Out of the 31 peptides, 27 were quantified with an average squared Pearson correlation coefficient of R2 = 0.993 (). Four peptides were discarded since were under the limit of quantification.
Figure 5. PRM analysis of selected proteins enriched in EXOs (PDCD6IP, CD81, CD9, SDCB1) or in MVs (SEPT2, RACGAP1, ATP5A1). Average abundances were displayed with standard deviations.
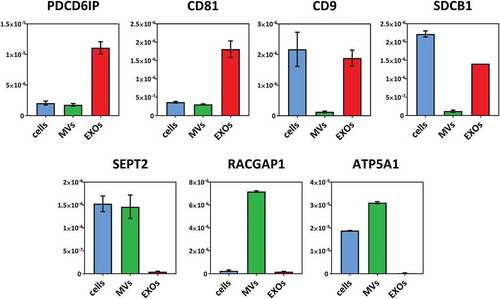
Figure 6. PRM analysis of proteins found differentially expressed in cells, MVs and EXOs after exposure to TNF. Average abundances were displayed with standard deviations. Asterisks indicate significance levels: ***p < 0.001, **p < 0.01, *p < 0.05.
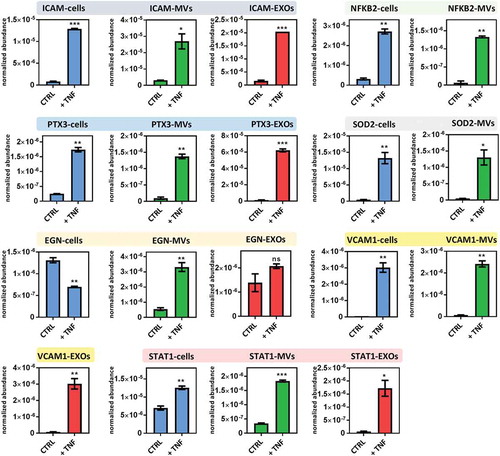
Results showed that all exosomal markers were highly enriched in EXOs compared to MVs, while proteins that were proposed as highly specific for MVs were found highly enriched in the MV fraction. ICAM1 and PTX3, which were reported as differentially expressed in cells, MVs and EXOs after TNF exposure using shotgun proteomics, were shown to be significantly upregulated in all samples using PRM as well. VCAM1 and STAT1 that were quantified in only cells and MVs using shotgun proteomics could be consistently quantified also in the EXO fraction using PRM. Instead, NFKB2 and SOD2 were quantified only in cells and MVs in both shotgun proteomics and PRM. Endoglin (EGLN, CD105), a specific marker for endothelial cells, was also quantified, and resulted significantly downregulated in cells, significantly upregulated in MVs and not significantly different in EXOs.
Discussion
In the present work, we reported on the protein profiles of microvesicles (MVs) and exosomes (EXOs) derived from brain endothelial cells. We then described the study of how tumour necrosis factor (TNF) induced modulation in the proteomes of these extracellular vesicle (EV) subsets. To the best of our knowledge, only one study to date has examined the proteome of EVs released from hCMEC/D3 cells, and this was without distinction between MVs and EXOs.[Citation20] Here, we relied on previously described protocols [Citation4] to isolate MVs and EXOs using differential centrifugation. In the literature some isolation protocols proposed additional steps to separate MVs and EXOs, such as filtration before pelleting EXOs [Citation46] or density gradients.[Citation3] Nevertheless, our results showed that differential centrifugation alone allowed separation of two EV subsets efficiently to perform quantitative proteomics. This was shown by transmission electron microscopy and nanoparticle tracking analysis that revealed a size distributions of MVs (isolated at 18,000 g) and EXOs (isolated at 100,000 g) within the normal ranges for microvesicles and exosomes, respectively,[Citation36] consistently with recent studies on these EV subsets.[Citation4,Citation46,Citation47] Proteomic analysis further confirmed two distinct EV populations. The EXO samples were enriched with the exosomal markers PDCD6IP and lacked GRP94, a marker commonly used to test the purity of vesicle isolation. Interestingly, MV preparations were found to be enriched with GRP94. GRP94, also called endoplasmin, is a marker for reticuloplasm, but it has also been associated with the cell membrane,[Citation48,Citation49] identified in MVs [Citation50,Citation51] and proposed to be enriched in larger vesicles.[Citation3] PRM analysis confirmed that EXOs were highly enriched with the canonical exosomal markers CD81, CD9 and SDCB1, while lacking the proposed microvesicle markers SEPT2, RACGAP1 and ATP5A1, highly enriched only in MV fractions.
Since MVs and EXOs have different origins, it is thought that they may have different functions in the transfer of protein and RNA cargoes from one cell to another.[Citation52] Characterising EV protein cargoes is therefore a fundamental step towards a better understanding of the functional differences between EV subsets.
The EV protein profiles revealed that MVs and EXOs shared about one third of their proteins, whereas the remainder were exclusively identified in one subset or the other (544 proteins in MV preparations and 209 proteins in EXO preparations). Since differential centrifugation cannot guarantee to isolate 100% pure populations of EVs, we cannot exclude some co-isolation of proteins in MV and EXO preparations during this isolation process, with the consequence of some MV proteins being identified in EXO samples and vice versa. However, MVs and EXOs are known to share a wide range of proteins [Citation53] and we identified proteins involved in membrane trafficking (annexins and rabs), adhesion (integrins), protein trafficking (heat shock proteins), signal transduction (G-proteins), translation (ribosomal proteins) and phosphorylation (kinases) in both preparations. Some of these protein families were more widely represented in one EV subset, and GO enrichment analysis was chosen to highlight these differences.
Overall our results suggested that the proteome of MVs was more similar to the cell of origin than EXOs. This was shown by the higher number of GO terms shared between cells and MVs compared to cells and EXOs, and a higher squared correlation coefficient between cells and MVs. The higher similitude of MVs to the cell of origin than EXOs has emerged in several studies both in term of protein [Citation46] and RNA [Citation54] content.
Proteins related to adherens junctions, cytosolic ribosome and the extracellular vesicle machinery were enriched in EXO samples. Conversely, proteins related to the mitochondrion, endoplasmic reticulum, cytoskeleton and proteolysis were enriched in MV samples.
One of the striking findings was the great abundance of mitochondrial proteins identified using shotgun proteomics in MV samples (89 proteins in MVs, one protein in EXOs), successively confirmed by PRM (ATP5A1), suggesting that mitochondria are packaged in MVs. This hypothesis is supported by Phinnery et al.,[Citation55] who showed that cells can pack partially depolarised mitochondria into MVs (but not into EXOs) and this enhances cell survival during oxidative stress. However, they also showed that mitochondrial transfer mediated by MVs improves the mitochondrial bioenergetics in receiving cells. Furthermore, the presence of cytoskeleton-related proteins such as tubulins, actins and septins is of particular interest since some of these proteins are directly involved in MV biogenesis and may be interesting candidates for MV markers. Some of the proteins that were found exclusively in MV samples (KIF23, CSE1L and RACGAP1) had been previously proposed as potential markers for discriminating MVs from other EVs.[Citation51] The enrichment of cytoskeletal proteins in MVs is emerged in the recent literature [Citation3,Citation46] and our results further reinforced these finding.
The characterisation of protein cargo modulation after a phenotypic change in the donor cell (such as exposure to TNF) is important for gathering additional information, not only to reveal the biological and functional proprieties of EVs but also in the context of studying them as biomarker carriers. In recent years, it has become evident that EV proteins could potentially be used as biomarkers for various brain-related diseases such as Alzheimer’s and Parkinson’s.[Citation18,Citation19] Given the critical role of the BBB, the interface between the cerebrovascular and central nervous systems, it is hoped that EVs deriving from it and found in blood might non-invasively provide signatures of the pathophysiological state of the brain.
The present study chose TNF because of its role as a key mediator of brain inflammation. During immune responses, TNF is released by several types of brain cells, such as endothelial cells, microglia and astrocytes. Dysregulation of TNF has been associated with many neurological disorders, including multiple sclerosis.[Citation30]
The analysis of EV cargoes showed that after exposure to TNF a substantial part of all the identified proteins in MVs and EXOs was differentially expressed, indicating that TNF has a significant overall effect on the protein content of EVs. Furthermore, TNF was shown to increase the rate of vesiculation and this, in turn, leads to a greater abundance of released EV proteins in absolute terms.
Interestingly, about a quarter of the proteins found to be differentially expressed in cells were also found to be differentially expressed with similar fold-changes in EVs, especially in MVs. These results indicated that cells package proteins systematically and suggest that the quantification of EV proteins can provide accurate information about their expression at the cellular level.
Most of the differential proteins that cells, MVs and EXOs have in common are described as being involved in the TNF and NF-κB signalling pathways or are well known to be affected by TNF. ICAM1 and VCAM1, well-known markers of endothelium activation and of particular interest given their involvement in brain leukocyte transmigration, were found to be highly upregulated in EVs after exposure to TNF. Upregulation of these proteins in brain endothelial cells is known to be associated with exposure to TNF [Citation56] and also to other endogenous and exogenous compounds, such as LPS and morphine,[Citation57] and is crucial during the onset of multiple sclerosis.[Citation30] Our results are in line with previous findings that found ICAM1 overexpressed in EVs released from vascular endothelial cells after exposure to TNF.[Citation13,Citation58] To the best of our knowledge, no studies have previously identified human VCAM1 in EVs using differential centrifugation.
NF-κB is a critical regulator of the expression of genes related to the inflammation resulting from several neuroinflammatory diseases. Activation of NF-κB is probably the most central cellular response induced by TNF that is associated with endothelial cell activation.[Citation59] Dysregulation of NF-κB in endothelial cells is also known to have a key role in regulating the LPS-induced disruption of tight-junction complexes and increased BBB permeability.[Citation60] NF-κB was found significantly upregulated also in MVs as shown by both shotgun and PRM results.
Several proteins commonly known to be regulated by interferon-ß such as IFIT1, IFIT2, IFIT3, IFIT4, MX1, MX2, STAT1, STAT2 and STAT6 were found significantly upregulated after 24 h exposure to TNF in cells. These results are consistent with previous finding that demonstrated the ability of TNF to induce an autocrine loop that induces delayed expression of interferon-response genes.[Citation61] Interestingly, some of these proteins, such as STAT1 and MX1, were found differentially expressed in EVs as well.
In addition to transcription factors such as NF-κB and STAT1, among the differentially expressed proteins in EVs, we found several translation factors (EIFs, particularly those upregulated in EXOs), RNA-binding proteins (hnRNPs, differentially expressed in both MVs and EXOs) and other functionally active proteins such as the epidermal growth factor receptor (differentially expressed in EXOs), amyloid beta A4 protein (highly downregulated in MVs), and metalloproteinases (ADAMs, differentially expressed in both MVs and EXOs). Since EVs can fuse to target cells, some of the functionally active proteins they transport may be released into the receiving cells and regulate some of their biological processes. The functional roles of some of the proteins in EVs have been reported previously, as in the case of exosomal ADAM15, that was found to play a critical role in exosome-mediated tumour suppression.[Citation62]
TNF itself was shown to be contained in exosomes as a membrane-bound form and to induce activation of NF-κB in receiving cells.[Citation63]
Because some of the active proteins were uniquely found (or highly enriched) in only one EV subset, MVs and EXOs are probably able to induced different responses in receiving cells. However, functional studies would be needed to investigate this hypothesis.
Pathway analysis showed that most of the proteins found to be differentially expressed in cells after exposure to TNF were mapped onto pathways regulated by TNF and the interferon signalling pathway, thus confirming the ability of TNF to induce interferon production as reported in other studies.[Citation38,Citation64] Instead, in both MV and EXO samples, EIF2 signalling was the most significant pathway found to be upregulated after exposure to TNF. Overexpression of the EV proteins involved in the EIF2 pathway during an inflammatory response has been described in cases of viral infection [Citation65,Citation66] and may be linked to the general increase of translation in cells following inflammation. In addition to EIF2, some pathways that are known to be regulated by cytokines such as TNF were identified in both MVs (e.g. interferon and Tec Kinase signalling) and EXOs (SAPK/JNK signalling), and TNF was predicted as a possible upstream regulator in both MVs and EXOs.
Overall, the present results indicated that quantitative proteomics could allow extracting useful information from EVs that reflects the biological status of the donor cell.
Our results also suggested that PRM can be successfully used to characterise EVs by quantifying both EXO markers (CD81, CD81, CD9, PDCD6IP, SDCB1) as well as proposed MV markers (ATP5A1, RACGAP1 and SEPT2) with high sensitivity, precision and repeatability.
In conclusion, this study showed that MVs and EXOs have distinct proteomic profiles, but that they also share common EV markers. We reported proteins identified exclusively in MV or EXO sub-cellular fractions, which could potentially be used to differentiate these two EV populations. We showed that MVs are particularly enriched in mitochondrial, endoplasmic and cytoskeletal proteins, while EXOs in ribosomal proteins, histones and proteins involved in exosome biogenesis and cell adhesion.
A phenotypic change in donor cells induced by TNF was shown to lead to a significant change in the abundances of several EV proteins involved in TNF signalling and immune response. This suggested that EV protein content might provide a pathophysiological signature of the donor cell. Furthermore, the presence of several functionally active proteins and transcription factors, and their modulation by TNF, provide additional evidence pointing to the involvement of MVs and EXOs in cell–cell communication.
Supplementary_figure_and_table_legends.docx
Download MS Word (12.3 KB)Supplementary_figures_and_tables.pdf
Download PDF (868.6 KB)Acknowledgements
We wish to thank the Swiss Centre for Applied Human Toxicology for funding this project, Dr Serge Stroll’s and Prof. Gerrit Borchard’s groups at the University of Geneva for access to the Nanosight device, the University of Sydney and Natacha Turck at the University of Geneva for the use of IPA software. We also thank Nathalie Satta, Valeria Severino, Natalia Tiberti, Domitille Schvarzt and Mark Ibberson for helpful discussions.
Disclosure statement
No potential conflict of interest was reported by the authors.
Supplemental data
Supplemental data for this article can be accessed here.
Additional information
Funding
Related Research Data
References
- Kalra H, Simpson RJ, Ji H, et al. Vesiclepedia: a compendium for extracellular vesicles with continuous community annotation. Plos Biol. 2012;10:1.
- El Andaloussi S, Mager I, Breakefield XO, et al. Extracellular vesicles: biology and emerging therapeutic opportunities. Nat Rev Drug Discov. 2013;12:347–14.
- Kowal J, Arras G, Colombo M, et al. Proteomic comparison defines novel markers to characterize heterogeneous populations of extracellular vesicle subtypes. Proc Natl Acad Sci. 2016;113:E968–E977.
- Crescitelli R, Lässer C, Szabó TG, et al. Distinct RNA profiles in subpopulations of extracellular vesicles: apoptotic bodies, microvesicles and exosomes. J Extracell Vesicles. 2013;2.
- Lőrincz ÁM, Schütte M, Timár CI, et al. Functionally and morphologically distinct populations of extracellular vesicles produced by human neutrophilic granulocytes. J Leukoc Biol. 2015;98:583–589.
- Valadi H, Ekstrom K, Bossios A, et al. Exosome-mediated transfer of mRNAs and microRNAs is a novel mechanism of genetic exchange between cells. Nat Cell Biol. 2007;9:654–659.
- Tkach M, Théry C. Communication by extracellular vesicles: where we are and where we need to go. Cell. 2016;164:1226–1232.
- Alexander M, Hu R, Runtsch MC, et al. Exosome-delivered microRNAs modulate the inflammatory response to endotoxin. Nat Commun. 2015;6:7321.
- Budnik V, Ruiz-Canada C, Wendler F. Extracellular vesicles round off communication in the nervous system. Nat Rev Neurosci. 2016;17:160–172.
- Raposo G, Théry C, Colombo M. Biogenesis, secretion, and intercellular interactions of exosomes and other extracellular vesicles. Annu Rev Cell Dev Biol. 2014;30:255–289.
- Février B, Raposo G. Exosomes: endosomal-derived vesicles shipping extracellular messages. Curr Opin Cell Biol. 2004;16:415–421.
- Kanada M, Bachmann MH, Hardy JW, et al. Differential fates of biomolecules delivered to target cells via extracellular vesicles. Proc Natl Acad Sci. 2015;112:E1433–E1442.
- Verhaar MC, Van Balkom BWM, Schiffelers RM, et al. Cellular stress conditions are reflected in the protein and RNA content of endothelial cell-derived exosomes. J Extracell Vesicles. 2012;1:569.
- Kucharzewska P, Christianson HC, Welch JE, et al. Exosomes reflect the hypoxic status of glioma cells and mediate hypoxia-dependent activation of vascular cells during tumor development. Proc Natl Acad Sci. 2013;110:7312–7317.
- Akers JC, Ramakrishnan V, Kim R, et al. miR-21 in the extracellular vesicles (EVs) of cerebrospinal fluid (CSF): a platform for glioblastoma biomarker development. Plos ONE. 2013;8:e78115.
- Cheow ESH, Cheng WC, Lee CN, et al. Plasma-derived extracellular vesicles contain predictive biomarkers and potential therapeutic targets for myocardial ischemic injury. Mol Cell Proteomics. 2016;15:2628–2640.
- Chiasserini D, Van Weering JRT, Piersma SR, et al. Proteomic analysis of cerebrospinal fluid extracellular vesicles: A comprehensive dataset. J Proteomics. 2014;106:191–204.
- Fiandaca MS, Kapogiannis D, Mapstone M, et al. Identification of preclinical Alzheimer’s disease by a profile of pathogenic proteins in neurally derived blood exosomes: A case-control study. Alzheimer’s Dementia. 2015;11:600–7.e1.
- Shi M, Liu C, Cook TJ, et al. Plasma exosomal α-synuclein is likely CNS-derived and increased in Parkinson’s disease. Acta Neuropathol. 2014;128:639–650.
- Haqqani AS, Delaney CE, Tremblay T-L, et al. Method for isolation and molecular characterization of extracellular microvesicles released from brain endothelial cells. Fluids Barriers CNS. 2013;10:1–13.
- Daneman R. The blood–brain barrier in health and disease. Ann Neurol. 2012;72:648–672.
- Minagar A, Alexander JS. Blood-brain barrier disruption in multiple sclerosis. Mult Scler. 2003;9:540–549.
- Zlokovic BV. The blood-brain barrier in health and chronic neurodegenerative disorders. Neuron. 2008;57:178–201.
- Erickson MA, Banks WA. Blood–brain barrier dysfunction as a cause and consequence of Alzheimer’s disease. J Cereb Blood Flow Metab. 2013;33:1500–1513.
- Heneka MT, Carson MJ, Khoury JE, et al. Neuroinflammation in Alzheimer’s disease. Lancet Neurol. 2015;14:388–405.
- Lyman M, Lloyd DG, Ji X, et al. Neuroinflammation: the role and consequences. Neurosci Res. 2014;79:1–12.
- Brenner D, Blaser H, Mak TW. Regulation of tumour necrosis factor signalling: live or let die. Nat Rev Immunol. 2015;15:362–374.
- Park KM, Bowers WJ. Tumor necrosis factor-alpha mediated signaling in neuronal homeostasis and dysfunction. Cell Signal. 2010;22:977–983.
- Bhaskar K, Maphis N, Xu G, et al. Microglial derived tumor necrosis factor-α drives Alzheimer’s disease-related neuronal cell cycle events. Neurobiol Dis. 2014;62:273–285.
- Cannella B, Raine CS. The adhesion molecule and cytokine profile of multiple sclerosis lesions. Ann Neurol. 1995;37:424–435.
- Lindoso RS, Collino F, Camussi G. Extracellular vesicles derived from renal cancer stem cells induce a pro-tumorigenic phenotype in mesenchymal stromal cells. Oncotarget. 2015;6:7959–7969.
- Combes V, Simon A-C, Grau G-E, et al. In vitro generation of endothelial microparticles and possible prothrombotic activity in patients with lupus anticoagulant. J Clin Investig. 1999;104:93–102.
- Colombo M, Raposo G, Thery C. Biogenesis, secretion, and intercellular interactions of exosomes and other extracellular vesicles. Annu Rev Cell Dev Biol. 2014;30:255–289.
- MacLean B, Tomazela DM, Shulman N, et al. Skyline: an open source document editor for creating and analyzing targeted proteomics experiments. Bioinformatics. 2010;26:966–968.
- Bindea G, Mlecnik B, Hackl H, et al. ClueGO: a Cytoscape plug-in to decipher functionally grouped gene ontology and pathway annotation networks. Bioinformatics. 2009;25:1091–1093.
- Gould SJ, Raposo G. As we wait: coping with an imperfect nomenclature for extracellular vesicles. Journal of Extracellular Vesicles. 2013;2013. Epub 2013-01-14.
- Visner G, Chesrown SE, Monnier J, et al. Regulation of manganese superoxide dismutase: IL-1 and TNF induction in pulmonary artery and microvascular endothelial cells. Biochem Biophys Res Commun. 1992;188:453–462.
- Venkatesh D, Ernandez T, Rosetti F, et al. Endothelial TNF receptor 2 induces IRF1 transcription factor-dependent interferon-β autocrine signaling to promote monocyte recruitment. Immunity. 2013;38:1025–1037.
- Loeb KR, Haas AL. The interferon-inducible 15-kDa ubiquitin homolog conjugates to intracellular proteins. J Biol Chem. 1992;267:7806–7813.
- Yang S, Zhan Y, Zhou Y, et al. Interferon regulatory factor 3 is a key regulation factor for inducing the expression of SAMHD1 in antiviral innate immunity. Sci Rep. 2016;6:29665.
- Wang Y, Wu TR, Cai S, et al. Stat1 as a component of tumor necrosis factor alpha receptor 1-TRADD signaling complex to inhibit NF-κB activation. Mol Cell Biol. 2000;20:4505–4512.
- Sanz L, Diaz–Meco MT, Nakano H, et al. The atypical PKC-interacting protein p62 channels NF-κB activation by the IL-1–TRAF6 pathway. EMBO J. 2000;19:1576–1586.
- Zhou Z, Connell MC, MacEwan DJ. TNFR1-induced NF-κB, but not ERK, p38MAPK or JNK activation, mediates TNF-induced ICAM-1 and VCAM-1 expression on endothelial cells. Cell Signal. 2007;19:1238–1248.
- Yoo J, Perez CER, Nie W, et al. TNF-α induces upregulation of EGFR expression and signaling in human colonic myofibroblasts. Am J Physiol Gastrointest Liver Physiol. 2012;302:G805–G814.
- Krämer A, Green J, Pollard J, et al. Causal analysis approaches in ingenuity pathway analysis. Bioinformatics. 2013;30:523–530.
- Haraszti RA, Didiot M-C, Sapp E, et al. High-resolution proteomic and lipidomic analysis of exosomes and microvesicles from different cell sources. J Extracell Vesicles. 2016;5:32570. DOI:10.3402/jev.v5.32570
- Lázaro-Ibáñez E, Sanz-Garcia A, Visakorpi T, et al. Different gDNA content in the subpopulations of prostate cancer extracellular vesicles: apoptotic bodies, microvesicles, and exosomes. Prostate. 2014;74:1379–1390.
- Robert J, Ménoret A, Cohen N. Cell surface expression of the endoplasmic reticular heat shock protein gp96 is phylogenetically conserved. J Immunol. 1999;163:4133–4139.
- Li X, Sun L, Hou J, et al. Cell membrane gp96 facilitates HER2 dimerization and serves as a novel target in breast cancer. Int J Cancer. 2015;137:512–524.
- Mayr M, Grainger D, Mayr U, et al. Proteomics, metabolomics, and immunomics on microparticles derived from human atherosclerotic plaques. Circ Cardiovasc Genet. 2009;2:379–388.
- Xu R, Greening DW, Rai A, et al. Highly-purified exosomes and shed microvesicles isolated from the human colon cancer cell line LIM1863 by sequential centrifugal ultrafiltration are biochemically and functionally distinct. Methods. 2015;87:11–25.
- Koumangoye R, Delpire E. The Ste20 kinases SPAK and OSR1 travel between cells through exosomes. Am J Physiol Physiol. 2016;311:C43–C53.
- Choi D-S, Kim D-K, Kim Y-K, et al. Proteomics of extracellular vesicles: exosomes and ectosomes. Mass Spectrom Rev. 2015;34:474–490.
- Lunavat TR, Cheng L, Kim D-K, et al. Small RNA deep sequencing discriminates subsets of extracellular vesicles released by melanoma cells – Evidence of unique microRNA cargos. RNA Biol. 2015;12:810–823.
- Phinney DG, Di Giuseppe M, Njah J, et al. Mesenchymal stem cells use extracellular vesicles to outsource mitophagy and shuttle microRNAs. Nat Commun. 2015;6:8472.
- Dobbie MS, Hurst RD, Klein NJ, et al. Upregulation of intercellular adhesion molecule-1 expression on human endothelial cells by tumour necrosis factor-α in an in vitro model of the blood–brain barrier. Brain Res. 1999;830:330–336.
- Strazza M, Pirrone V, Wigdahl B, et al. Prolonged morphine exposure induces increased firm adhesion in an in vitro model of the blood–brain barrier. Int J Mol Sci. 2016;17:916.
- Peterson DB, Sander T, Kaul S, et al. Comparative proteomic analysis of PAI-1 and TNF-alpha-derived endothelial microparticles. Proteomics. 2008;8:2430–2446.
- Madge LA, Pober JS. TNF Signaling in Vascular Endothelial Cells. Experimental and Molecular Pathology. 2001;70:317–325.
- He F, Peng J, Deng XL, et al. RhoA and NF-κB are involved in lipopolysaccharide-induced brain microvascular cell line hyperpermeability. Neuroscience. 2011;188:35–47.
- Yarilina A, Park-Min K-H, Antoniv T, et al. TNF activates an IRF1-dependent autocrine loop leading to sustained expression of chemokines and STAT1-dependent type I interferon-response genes. Nat Immunol. 2008;9:378–387.
- Lee HD, Koo B-H, Kim YH, et al. Exosome release of ADAM15 and the functional implications of human macrophage-derived ADAM15 exosomes. Faseb J. 2012;26:3084–3095.
- Zhang H-G, Liu C, Su K, et al. A membrane form of TNF-α presented by exosomes delays T cell activation-induced cell death. J Immunol. 2006;176:7385–7393.
- Yarilina A, Ivashkiv LB. Type I interferon: a new player in TNF signaling. Curr Dir Autoimmun. 2010;11:94–104.
- Meckes DG, Gunawardena HP, Dekroon RM, et al. Modulation of B-cell exosome proteins by gamma herpesvirus infection. Proc Natl Acad Sci U S A. 2013;110:E2925–E2933.
- Ge M, Ke R, Cai T, et al. Identification and proteomic analysis of osteoblast-derived exosomes. Biochem Biophys Res Commun. 2015;467:27–32.