
ABSTRACT
Introduction: Nanoparticle tracking analysis (NTA) enables measurement of extracellular vesicles (EVs) but lacks the ability to distinct between EVs and lipoproteins which are abundantly present in blood plasma. Limitations in ultracentrifugation and size exclusion chromatography applied for EV isolation may result in inadequate EV purification and preservation. In this proof of concept study, we aimed to evaluate the potential of antibody-mediated removal of lipoproteins from plasma prior to extracellular vesicle (EV) analysis by nanoparticle tracking analysis (NTA).
Methods: Ten platelet-free plasma (PFP) samples from healthy fasting subjects were incubated with magnetic beads coated with antibodies against apolipoprotein B-48 and B-100 (ApoB). Plasma samples were analysed with NTA before and after application of the bead procedure. Four fasting PFP samples were analysed with an ELISA specific for human ApoB to estimate the degree of removal of lipoproteins and EV array analysis was used for identification of possible EV loss.
Results: The magnetic bead separation procedure resulted in a median reduction of the particle concentration in plasma by 62% (interquartile range 32–72%). The mean size of the remaining particles generally increased. ApoB concentration was reduced to a level close to the background signal, whereas a median reduction of the EV content by 21% (range 8–43%) was observed.
Conclusion: Anti-ApoB antibody coated magnetic beads may hold potential for removal of lipoproteins from human PFP prior to EV measurement by NTA but some artefactual effect and EV loss may have to be endured.
Responsible Editor Edit BuzásSemmelweis University; Hungary
Introduction
A number of studies have demonstrated the potential of extracellular vesicles (EVs) as diagnostic and prognostic biomarkers of various health conditions [Citation1–Citation3] but a major obstacle for EV research is the lack of standardisation of methods for sample processing preceding the analysis [Citation4–Citation6].
Nanoparticle tracking analysis (NTA) enables detection of EVs in the size range of exosomes, i.e. EVs originally described with a diameter below 100 nm [Citation7,Citation8], now often stated to be around 30–150 nm [Citation9]. However, although initial steps have been taken towards refinement of the technique [Citation10,Citation11], NTA does not at present allow for distinction between EVs and other particles within the size range of EVs in plasma, including protein aggregates and lipoproteins [Citation6]. According to Gardiner et al. the latter may account for more than 98% of particles detected by NTA in human plasma [Citation12]. Attempts at isolating EVs from plasma by differential centrifugation and size exclusion chromatography (SEC) have been made. However, ultracentrifugation may damage EVs, aggregation may occur, the pellet from a high-speed spin yet contains extravesicular protein aggregates and lipoproteins [Citation5,Citation6,Citation13] and the procedure may not enable full sedimentation of EVs [Citation14]. SEC enables extraction of EV-enriched plasma fractions that, however, probably still contain considerable amounts of very low density lipoproteins (VLDLs) and are depleted of EVs with a diameter of less than about 70 nm due to column material [Citation15,Citation16].
VLDLs and other types of apolipoprotein B (ApoB)-exposing lipoprotein particles, including intermediate and low density lipoproteins (IDLs and LDLs, respectively), and chylomicrons, expectedly interfere with measurement of EVs using NTA. The size range of LDLs is 18–23 nm, while that of IDLs is 23–27 nm [Citation17,Citation18]. The majority of VLDLs have a diameter of 27–60 nm while a subgroup can measure up to 200 nm [Citation17,Citation18]. The diameter of chylomicrons ranges from 75 to 1200 nm [Citation19]. Besides ApoB-exposing lipoproteins plasma contains high density lipoproteins (HDLs) which do not expose ApoB. We would not expect HDLs to interfere with NTA measurements since they have a diameter of about 10 nm [Citation17,Citation18].
In order to circumvent lipoprotein interference with NTA measurement of EVs we explored the potential of removing interfering lipoproteins from plasma prior to EV analysis using magnetic beads coated with antibodies against ApoB.
Materials and methods
Study population and blood sample handling
The study was approved by The North Denmark Region Committee on Health Research Ethics. Ten healthy subjects (4 females and 6 males) were included. Venous blood samples were collected in 9 mL Vacuette 3.2% sodium citrate plastic tubes (Greiner Bio-One, Kremsmünster, Austria) in the morning following an overnight fast.
PFP was obtained by centrifuging the samples twice at 2500 g for 15 minutes at room temperature as specified by Lacroix et al. [Citation20] and stored at −80°C. On the day of lipoprotein removal and NTA analysis samples were thawed in a water bath at 37°C and diluted with Dulbecco’s phosphate buffered saline (PBS) (Lonza, Basel Switzerland) which had been filtered through a sterile 0.2 µm Q-Max syringe filter (Frisenette, Knebel, Denmark) by a factor of 1000 or 500 which for PFP generally provides a particle concentration within the linear range for NTA (1.0–10.0 × 10⁸ particles/mL)[Citation16] prior to application of the bead procedure.
As controls were used solutions with human Low Density Lipoprotein (LDL) 5 mg/mL and Human Very Low Density Lipoprotein (VLDL) 1 mg/mL (Kalen Biomedical, Montgomery Village, MD, USA). The lipoprotein isolates were diluted 20,000 times with filtered PBS to obtain particle concentrations within the linear range for NTA.
Cholesterol and triglyceride (TG) levels were measured in lithium–heparin plasma on a Cobas 8000 Modular Analyzer (Roche Applied Science, Penzberg, Germany).
Lipoprotein removal by anti-ApoB antibody coated magnetic beads
Preparation of antibody coated beads
For each sample to undergo the ‘bead procedure’ 50 µL (100 µL for PFP samples diluted by a factor of 500) of Dynabeads protein G 30 mg/mL (Life Technologies, Carlsbad, CA, USA) were transferred to a 2 mL microtube (Sarstedt, Nümbrecht, Germany) after resuspension of the bead stock solution by vortexing for 30 seconds. A DynaMag-2 (Life Technologies) magnet was used to separate beads from the solution, and the supernatant was removed. Aliquots of 10 µL (20 µL for PFP samples diluted by a factor of 500) of polyclonal anti-human ApoB-48/-100 antibodies 1 mg/mL (Meridian, Life Science, Inc., Memphis, TN, USA) were diluted in 200 µL of PBS with 0.02% Tween 20 (Bio-Rad, Hercules, CA, USA) and then incubated with the magnetic beads under rotation for 10 minutes, allowing for the Fc-region of the antibodies to bind to protein G on the beads. The antibody coated beads were separated from the solution, which was removed. No antibodies were detectable in this removed solution (i.e. they were bound to the beads) as determined with measurement of absorption at 280 nm after this incubation. The antibody coated beads were washed three times with 200 µL of PBS with 0.02% Tween 20 by gentle pipetting. The microtube containing the antibody coated magnetic beads and the PBS used for the third wash was placed on the magnet, and the solution was removed from the fixed beads.
Incubation of antibody coated beads with samples
Sample (1000 µL) was added to the antibody coated beads, mixed by gentle pipetting, and incubated under rotation for 120 minutes. Theoretically this incubation facilitates antibody-based binding of the magnetic beads to VLDL, LDL, and IDL particles which expose ApoB-100[Citation21] on their surface as well as to chylomicrons which expose ApoB-48[Citation21]. Immediately after the incubation the sample was separated from the beads before analysis.
As a control, we tested if an identical 120 minute incubation period with uncoated beads (i.e. beads separated from the stock solution but not undergoing any preparatory incubation with antibodies) had any effect on the particle population.
Particle measurement
For particle measurement by NTA we used a NanoSight LM10-HS (Malvern Instruments Ltd, Malvern, UK) with a 405 nm laser and a Luca DL-658 M-OEM EMCCD camera (Andor Technology, Belfast, UK). NanoSight NTA 2.3 was applied for data processing.
The duration of particle tracking was 60 seconds with the camera shutter set to 500, camera gain to 300, and detection threshold to 3. Sample viscosity was linked to the corresponding viscosity for water at the given temperature. Automatic settings were selected for minimum expected particle size, blur, and minimum track length.
Samples were diluted in PBS to a concentration within the linear range for NTA. Samples were loaded manually into the sample chamber using a 1 mL syringe. The microscopic field of view was positioned near to the flare spot in the area where the particles were most clearly visualised. Background signal was subtracted before sequence processing.
Samples were analysed in duplicates and the mean value given. Daily QC procedures were performed as previously described [Citation16].
ApoB measurement
The content of ApoB-48 and ApoB-100 was determined by an ApoB human ELISA kit (Abcam, Cambridge, UK) using a SpectraMax M2 microplate reader (Sunnyvale, CA, USA) for measuring the absorption at a wavelength of 450 nm. The method was recalibrated against Tina-quant ApoB ver. 2 (Roche Applied Science, Penzberg, Germany). Samples were analysed in duplicates and the mean value given.
EV semi-quantification
Microarray slides were printed as described by Jørgensen et al. [Citation22]. A mixture/cocktail of anti-human antibodies against CD63 (BioRad, UK), CD9, and CD81 (LifeSpan BioSciences Inc., WA, USA) each in the concentration 100 µg/mL, was prepared with PBS and containing 5% of glycerol and printed as 24 replicated spots. As a positive control, 100 µg/mL of biotinylated human IgG was printed and PBS with 5% glycerol was applied as the negative control.
Catching and visualisation of the EVs were performed as described previously by Jørgensen et al. [Citation23]. with the following modifications: After blocking 100 µl of diluted PFP (1:400) in triplicates were incubated at room temperature for two hours followed by an overnight incubation at 4°C. Following a wash in wash buffer (0.05% Tween 20 (Sigma-Aldrich, MO, USA), in PBS), the slides were incubated for two hours with biotinylated detection antibodies. The detection was performed with either the so-called ‘exosome cocktail’, which is a mixture of biotin-labelled anti-CD9, -CD63, and -CD81 (LifeSpan BioSciences) diluted 1:1500 in wash buffer. After a wash, a subsequent 30 minutes incubation step with Cyanine 5 (Cy5)-labelled streptavidin (1:1500, Life Technologies, Carlsbad, CA, USA) in wash buffer was carried out for detection. Prior to scanning at 635 nm, the slides were washed once in wash buffer and once in MilliQ water and dried using a Microarray High-Speed Centrifuge (ArrayIt, Sunnyvale, CA, USA). Scanning and spot detection was performed as previously described [Citation24].
Statistics
Wilcoxon matched pairs signed rank test was used for comparison of particle concentration before and after the bead procedure.
For correlation analysis Spearman’s correlation was applied.
Statistical analyses were performed and graphs created with GraphPad Prism, version 6.01 (GraphPad Software, Inc., La Jolla, CA, USA). Two-sided p-values were given, and values below 0.05 considered significant.
Results
Effect of bead procedure on lipoprotein isolates
In the undiluted LDL isolate the cholesterol and TG concentrations were 22.0 mmol/L and 1.5 mmol/L, respectively. The undiluted VLDL contained 2.5 mmol/L of cholesterol and 2.2 mmol/L of TG.
Applying the bead procedure on diluted VLDL and LDL isolates resulted in a reduction in particle concentration by 93 and 91%, respectively (). The concentrations measured after the bead procedure were below the linear range for NTA measurements, which implies that they are subject to some uncertainty. Notably, the VLDL as well as the LDL isolate needed to be diluted significantly more than PFP to reach concentrations within the linear range for NTA, and unexpectedly, in both isolates we observed significant numbers of particles with a markedly larger diameter than that described for the respective ApoB-100-exposing lipoprotein particles [Citation18]. A similar observation was described by Sódar et al. [Citation13] who, using tunable resistive pulse sensing, demonstrated the presence of particles sized 100–500 nm in purified human LDL from a different manufacturer. Since, in our study, the majority of the large particles, as the smaller ones, were removed by the bead procedure, they plausibly primarily represented aggregates of ApoB-exposing lipoprotein particles. To further evaluate the effectiveness of the method, the remaining amount of ApoB was quantitated by use of the ApoB ELISA which indicated that the ApoB content in the diluted VLDL isolate was reduced by 97%, whereas the diluted LDL isolate, which had a distinctly higher baseline concentration of ApoB, was only subjected to a decrease by 69% (see )).
Figure 1. Effect of application of the bead procedure on particles in (a) VLDL (1 mg of protein per mL) and (b) LDL (5 mg of protein per mL) isolates from a commercial source. Prior to measurement and application of the bead procedure the isolates were diluted to obtain particle concentrations within the linear range of NTA as specified in the materials and methods section.
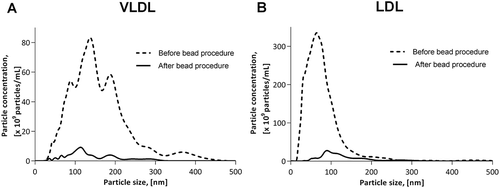
Figure 2. Effect of application of the bead procedure on PFP, employing incubation periods of 10, 30, 60, and 120 minutes, respectively.
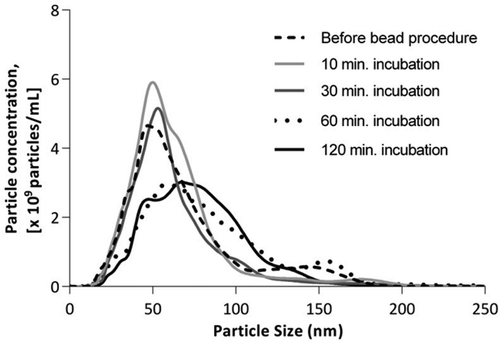
Figure 3. Effect of application of (a) bead procedure on PFP without antibodies and antibody procedure without beads and (b) a single and double bead procedure, respectively.
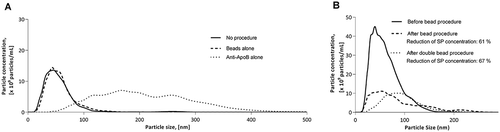
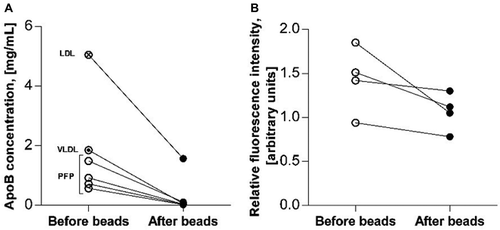
Figure 4. (a) Effect of bead procedure on apolipoprotein B content in PFP (n = 4) and lipoprotein isolates from a commercial source. Lines combine levels measured before (open circles) and after (closed circles) application of the bead procedure on PFP samples from four healthy persons (empty ‘before beads’ circles), diluted VLDL isolate (‘before beads’ circle with dot), and diluted LDL isolate (‘before beads’ circle with cross). (b) Effect of bead procedure on EV content measured as relative fluorescence intensity by EV array in PFP (n = 4). Lines combine levels measured before (open circles) and after (closed circles) application of the bead procedure on PFP samples from four healthy persons.
Effect of bead procedure on PFP samples
Preliminary experiments
Effect of incubation of PFP with beads and anti-ApoB antibodies on particle population
Initially, we studied the effect of various incubation periods for antibody coated beads with diluted fasting PFP on particle concentration. Incubation periods of 10, 30, 60, and 120 minutes were applied, data shown in . Periods of 60 and 120 minutes had comparable effects on particle content, whereas a less significant effect was seen when shorter incubation periods were applied. Hereafter, on all samples undergoing the bead procedure, we applied a standardised incubation period of 120 minutes, which was also used in the abovementioned experiment on lipoprotein isolates.
To investigate to what extent the magnetic beads in themselves, i.e. without preceding antibody coating, would affect the particle population in PFP, we applied an identical bead procedure, except that we abstained from coating the beads with anti-ApoB antibodies prior to the incubation with the diluted PFP sample. This resulted in no changes in particle concentration and size distribution curve ()). In addition, we conducted a parallel experiment with a two-hour incubation of diluted PFP with 10 µg of anti-ApoB antibodies that had not been attached to magnetic beads, which resulted in an increase in particle concentration by 105% as well as a notable shift of the size distribution curve to the right with appearance of a substantial amount of particles with a diameter between 100 and 400 nm ()).
The potential additional effect of a repeated bead procedure was evaluated by applying an identical bead procedure in immediate continuance of the first one on a PFP sample prior to NTA analysis. The data demonstrate a minor additional reduction in the particle count after the additional bead procedure, but also a shift of the size distribution curve to the right ()).
Effect of standardised bead procedure on ApoB concentration
ApoB ELISA results are shown in ). Reductions in ApoB concentration in fasting PFP from four healthy subjects after application of the bead procedure varied between 93 and 97%. In all four PFP samples the ApoB concentration was reduced to a level close to the lower limit of quantification of the ELISA.
Effect of standardised bead procedure on particle concentration
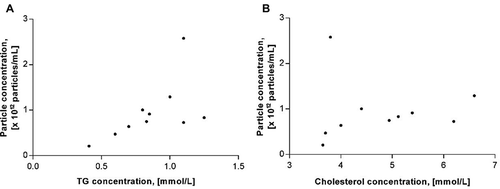
We applied the standardised bead procedure on fasting PFP from 10 healthy subjects. Characteristics of the study population are summarised in . The data suggest a positive correlation between TG and particle concentrations in plasma ()) but no significant correlation between cholesterol and particle concentrations ()).
Table 1. Study population characteristics (n = 10).
Figure 5. Correlation between (a) TG concentrations and particle concentrations in plasma (Spearman’s rs = 0.64; p = 0.05) and (b) cholesterol concentrations and particle concentrations (Spearman’s rs = 0.47; p = 0.18).
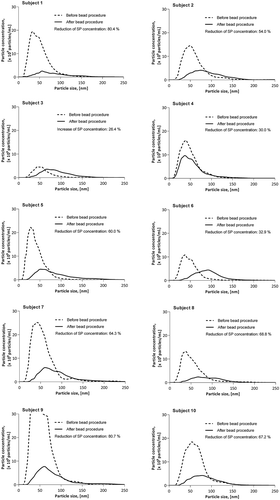
Application of the bead procedure on the diluted PFP samples resulted in significantly decreased particle concentrations (p < 0.01), although for one participant (subject 3, who was the participant with the lowest TG concentration at 0.41 mmol/L) the concentration reproducibly increased, results shown in . The median particle concentration was 7.9 (interquartile range 6.0–10.8) × 1011 particles/mL before and 3.3 (interquartile range 2.5–4.7) × 1011 particles/mL after the bead procedure. Overall, we observed a median reduction by 62% (interquartile range 32–72%). In addition to the general decrease in total particle concentration, we observed a tendency of the size distribution curve being shifted to the right. Thus, the smallest detectable particles in the solution were apparently removed, while more particles larger than 100 nm appeared. The median mean particle diameter was 54.7 (50.2–59.9) nm before the bead procedure and 91.7 (85.2–96.1) nm after the bead procedure, reflecting a statistically significant increase (p < 0.01).
Figure 6. Effect of application of bead procedure on particles in PFP (n = 10).
Effect of standardised bead procedure on EV content
Measurements performed with the EV array on the samples in the main study were close to the limit of detection for the EV array before as well as after the bead procedure. To explore the possibility of applying the bead procedure on less diluted plasma we tested it on PFP at several dilutions from 1:400 to 1:100 dilutions on additional blood samples. At 1:400 dilutions, using 25 µg of ApoB antibodies and 125 µL of magnetic beads, we obtained particle reduction results comparable to those seen with the standardised bead procedure. However, using dilutions lower than 1:400 the particle reductions became increasingly less effective.
Experiments on samples diluted 1:400 provided a sufficient fluorescence signal for EV semiquantification by EV array, showing a median reduction of EVs by 21% (range 9–43%). The relative fluorescence intensities are given in ).
Discussion
In this study we have performed antibody-mediated removal of ApoB-exposing lipoproteins from plasma using magnetic beads as solid phase, a method of sample preparation for EV measurement that, to our knowledge, has not previously been explored. We observed a seemingly effective clearing of ApoB, while EV content decreased variably using a two-hour incubation of diluted PFP with anti-ApoB antibody coated beads followed by magnetic removal of the beads from the samples. The bead procedure prompted a median reduction in particle concentration by 62% and an increase in mean particle size as measured by NTA. Taken together, the results indicate that this approach may have a potential as a way of overcoming hindrances to obtaining useful results with NTA on plasma content of EVs caused by the co-existence of lipoproteins in this medium, while on the other hand some artefactual effect and EV loss may have to be endured.
The effect of the method was tested on VLDL and LDL solutions, showing a reduction in particles to a low level (). Measurement of ApoB showed a reduction to a negligible level in the VLDL solution whereas in the LDL solution about 30% remained after the bead procedure. A probable explanation for this is the potential presence of LDLs too small to be detected by NTA. The lower detection limit of NTA has been reported to be approximately 10–35 nm, depending on the refractive index of the particles [Citation25–Citation27]. In our experiments particles with a diameter down to approximately 20 nm were apparently detected. Since the diameter of LDL particles is roughly 18–23 nm, a substantial fraction of LDLs, each carrying one molecule of ApoB [Citation21], may not be detectable by NTA. Consequently, although we did dilute the LDL isolate to obtain a concentration of detectable particles within the linear range of NTA prior to application of the bead procedure, the actual amount of ApoB-bearing LDLs in the diluted LDL isolate may have exceeded the capacity for ApoB capture by the amount of antibodies used in the bead procedure. However, considering the apparent dissimilarities between native LDLs and LDLs in the isolate, it could also be speculated that the position and conformation of the ApoB in some LDLs from the commercial source may not always imply exposure of the relevant epitopes of the ApoB molecule to the bead-bound anti-ApoB antibodies, resulting in some ApoB molecules steering clear of removal. Regardless of the specific reason for the incomplete LDL depletion from the isolate, the bead procedure seemed to effectively remove ApoB from the samples of our main interest, i.e. the PFP samples.
The observed reduction of EV content in the PFP samples which is an unwanted side effect of the removal of ApoB-bearing lipoproteins may be difficult to avoid, since LDLs have been shown to bind to EVs in vitro [Citation13]. Because of the high dilutions of the samples we were not able to distinguish between specific EV markers to uncover if some subtypes are particularly prone to be lost as a consequence of lipoprotein removal.
Performing the bead procedure with beads in the absence of antibodies did not interfere with the content of particles ()), whereas the procedure in the presence of antibodies without beads resulted in a high number of larger particles ()), plausibly because of aggregation of antibodies and lipoproteins. It is therefore important to avoid admixture of unbound ApoB antibodies.
Although lipid levels do not directly reflect the number of lipoprotein particles [Citation21] the observed correlation between TG (which is mainly present in VLDLs in the fasting state [Citation28]) levels and particle levels supports the premise that lipoproteins constitute a considerable part of the particles measured in fasting plasma by NTA. Using NTA with our chosen settings, our observations on the effect of the bead procedure mainly apply to particles in the size range of exosomes. NTA does not enable distinction between these small-sized EVs and lipoproteins present in plasma in the fasting state, which have diameters below 100 nm [Citation18], except for the less plentiful large VLDLs [Citation18] and any remaining chylomicrons present in plasma in spite of an overnight fast in individuals who clear lipoproteins at a low rate [Citation19]. Accordingly, we applied EV array with inclusion of capture antibodies against tetraspanins that are predominantly expressed by exosomes [Citation29] to yield information on the abundance of these EVs before and after applying the bead procedure. The unavoidable reduction of the EV content may be acceptable, not precluding subsequent EV analysis but we were not able to determine whether it is a random loss or specific EVs were removed. Recently, in vitro attachment of LDLs onto the surface of EVs upon in vitro mixing was demonstrated for the first time [Citation13]. This phenomenon may explain the observed reduction in EV content after the bead procedure, as some EVs may be bound to the lipoproteins being removed. In case interaction between EVs and lipoproteins primarily occurs in an in vitro setting it may be possible to decrease the undesirable effect of the bead procedure on the EV population by applying it immediately after blood sampling and centrifugation, minimising the time for lipoproteins to adhere to EVs. However, the observed shift of the particle size distribution curve generated by NTA indicates that the procedure had an effect on the samples other than merely reducing the particle concentration. Comparison of this effect with the effect of the presence of large amounts of unbound anti-ApoB antibodies ()), which resulted in a similar yet far more marked increase in the concentration of larger sized particles, could indicate crosslinking of potentially unbound anti-ApoB antibodies to ApoB causing formation of aggregates of antibodies and lipoproteins in the sample. However, we could not detect the presence of free antibodies in the fluid removed from the mixture of beads and antibodies. Alternatively, it could be speculated that the presence of lipoproteins in plasma to some degree prevents EVs binding to each other forming larger particles. Consequently, removing lipoproteins from the sample would cause EV adherence, which may possibly reduce the fluorescence signal from the EVs detected by EV array, representing an alternative explanation for the reduction of the measured EV content. On the other hand, as challenges related to performing precise NTA on polydisperse samples have been described [Citation12], the apparent increase in EV size after the bead procedure could conceivably have to do with a change in the relative number of larger particles caused by the lipoprotein depletion step.
The results on ApoB concentration in PFP samples indicate that the procedure provides effective removal of the amounts of ApoB, and thereby ApoB-exposing lipoproteins, present in these samples. This compared with the median reduction of particle concentration by 62% after application of the bead procedure suggests that a substantial part of the particle concentration in fasting samples is accounted for by particles different from ApoB-exposing lipoproteins, feasibly essentially EVs. However, some of the particles may represent protein aggregates as shown by György et al. [Citation30].
A limitation of our study is that the bead procedure only showed consistent effect on particle concentrations when performed on samples that had been diluted at least 400 times. The high dilutions narrow the range of other methods for EV detection which can be applied on the samples after the bead procedure. Applying an equivalently efficient bead procedure with regard to lipoprotein removal on undiluted plasma may theoretically be possible but would expectedly necessitate a sizeable concentration of anti-ApoB antibodies in the incubation step in order to capture the high amounts of ApoB-bearing lipoprotein particles present in plasma as indicated by the findings by Sódar et al. [Citation13]. However, in our study even the application of amounts of antibodies and beads corresponding to the lower plasma dilutions did not enable consistent particle reduction.
As particles detected by NTA may represent lipoprotein aggregates and these had a considerable size in the LDL and VLDL isolates, it is not inconceivable that even the small non-ApoB-exposing HDLs can form aggregates measurable with NTA. It may be possible to remove HDLs from plasma using antibodies against apolipoprotein A. Consequently, a residual interference on NTA measurements from lipoproteins present in the samples even after ApoB-depletion is thinkable as also protein aggregates may be a possible source of noise in NTA measurements on EVs [Citation6,Citation30].
The results in this study represent a proof of concept for the adapted procedure with regard to removal of measurable ApoB. However, the study also demonstrated some limitations of the procedure, and for validation and improvement of the method additional investigations are warranted to evaluate the impact of using various sample dilutions, incubation times, wash steps, and amounts and types of antibodies (e.g. monoclonal anti-ApoB antibodies as an alternative).
Conclusion
Based on our data, targeted lipoprotein removal from plasma by use of magnetic bead-coupled antibodies specifically directed against apolipoproteins appears to be achievable. However, data also indicate that application of the described bead procedure causes some reduction in the EV content of the samples and some increase in the number of relatively large particles.
Acknowledgments
We thank laboratory technician Aida Beganovic (Department of Clinical Biochemistry, Aalborg University Hospital) for her well performed implementation of the ApoB ELISA.
Disclosure statement
No potential conflict of interest was reported by the authors.
Additional information
Funding
Related Research Data
References
- van der Pol E, Böing AN, Harrison P, et al. Classification, functions, and clinical relevance of extracellular vesicles. Pharmacol Rev. 2012;64:1–10.
- Burger D, Schock S, Thompson CS, et al. Microparticles: biomarkers and beyond. Clin Sci (Lond). 2013;124:423–441.
- Boukouris S, Mathivanan S. Exosomes in bodily fluids are a highly stable resource of disease biomarkers. Proteomics Clin Appl. 2015;9:358–367.
- Yanez-Mo M, Siljander PR, Andreu Z, et al. Biological properties of extracellular vesicles and their physiological functions. J Extracell Vesicles. 2015;4:27066. eCollection 2015. DOI:10.3402/jev.v4.27066
- Yuana Y, Levels J, Grootemaat A, et al. Co-isolation of extracellular vesicles and high-density lipoproteins using density gradient ultracentrifugation. J Extracell Vesicles. 2014;3. eCollection 2014. DOI:10.3402/jev.v3.23262
- Witwer KW, Buzas EI, Bemis LT, et al. Standardization of sample collection, isolation and analysis methods in extracellular vesicle research. J Extracell Vesicles. 2013;2. eCollection 2013. DOI:10.3402/jev.v2i0.20360
- Thery C, Ostrowski M, Segura E. Membrane vesicles as conveyors of immune responses. Nat Rev Immunol. 2009;9:581–593.
- Raposo G, Stoorvogel W. Extracellular vesicles: exosomes, microvesicles, and friends. J Cell Biol. 2013;200:373–383.
- Kalra H, Drummen GP, Mathivanan S. Focus on extracellular vesicles: introducing the next small big thing. Int J Mol Sci. 2016;17(2):170.
- Dragovic RA, Gardiner C, Brooks AS, et al. Sizing and phenotyping of cellular vesicles using Nanoparticle Tracking Analysis. Nanomedicine. 2011;7:780–788.
- Gardiner C, Shaw M, Hole P, et al. Measurement of refractive index by nanoparticle tracking analysis reveals heterogeneity in extracellular vesicles. J Extracell Vesicles. 2014;3:25361. eCollection 2014. DOI:10.3402/jev.v3.25361
- Gardiner C, Ferreira YJ, Dragovic RA, et al. Extracellular vesicle sizing and enumeration by nanoparticle tracking analysis. J Extracell Vesicles. 2013;2. eCollection 2013. DOI:10.3402/jev.v2i0.19671
- Sodar BW, Kittel A, Paloczi K, et al. Low-density lipoprotein mimics blood plasma-derived exosomes and microvesicles during isolation and detection. Sci Rep. 2016;6:24316. DOI:10.1038/srep24316
- Davila M, Robles-Carrillo L, Unruh D, et al. Microparticle association and heterogeneity of tumor-derived tissue factor in plasma: is it important for coagulation activation? J Thromb Haemost. 2014;12:186–196.
- Boing AN, van der Pol E, Grootemaat AE, et al. Single-step isolation of extracellular vesicles by size-exclusion chromatography. J Extracell Vesicles. 2014;3. eCollection 2014. DOI:10.3402/jev.v3.23430
- Mørk M, Pedersen S, Botha J, et al. Preanalytical, analytical, and biological variation of blood plasma submicron particle levels measured with nanoparticle tracking analysis and tunable resistive pulse sensing. Scand J Clin Lab Invest. 2016;76(5):349–360.
- Colhoun HM, Otvos JD, Rubens MB, et al. Lipoprotein subclasses and particle sizes and their relationship with coronary artery calcification in men and women with and without type 1 diabetes. Diabetes. 2002;51:1949–1956.
- Wojczynski MK, Glasser SP, Oberman A, et al. High-fat meal effect on LDL, HDL, and VLDL particle size and number in the Genetics of Lipid-Lowering Drugs and Diet Network (GOLDN): an interventional study. Lipids Health Dis. 2011;10. DOI:10.1186/1476-511X-10-181.
- Savorani F, Kristensen M, Larsen FH, et al. High throughput prediction of chylomicron triglycerides in human plasma by nuclear magnetic resonance and chemometrics. Nutr Metab (Lond). 2010;7:43. DOI:10.1186/1743-7075-7-43
- Lacroix R, Judicone C, Poncelet P, et al. Impact of pre-analytical parameters on the measurement of circulating microparticles: towards standardization of protocol. J Thromb Haemost. 2012;10:437–446.
- Barter PJ, Ballantyne CM, Carmena R, et al. Apo B versus cholesterol in estimating cardiovascular risk and in guiding therapy: report of the thirty-person/ten-country panel. J Intern Med. 2006;259:247–258.
- Jørgensen MM, Baek R, Varming K. Potentials and capabilities of the Extracellular Vesicle (EV) Array. J Extracell Vesicles. 2015;4:26048. eCollection 2015. DOI:10.3402/jev.v4.26048
- Jørgensen M, Baek R, Pedersen S, et al. Extracellular Vesicle (EV) Array: microarray capturing of exosomes and other extracellular vesicles for multiplexed phenotyping. J Extracell Vesicles. 2013;2. eCollection 2013. DOI:10.3402/jev.v2i0.20920
- Baek R, Jørgensen MM. Multiplexed phenotyping of small extracellular vesicles using protein microarray (EV Array). Methods Mol Biol. 2017;1545:117–127.
- Azonano W. Reviewing the use of nanoparticle tracking analysis (NTA) for nanomaterial characterization. [ updated 2015; cited 2017 Jan 31]. Available from: http://www.azonano.com/article.aspx?ArticleID=4134.
- Nanowerk W. NanoSight adds DLS capability to NTA systems, accelerating aggregation studies. [ updated 2013; cited 2017 Jan 31]. Available from: http://www.nanowerk.com/news2/newsid=31641.php.
- Filipe V, Hawe A, Jiskoot W. Critical evaluation of Nanoparticle Tracking Analysis (NTA) by NanoSight for the measurement of nanoparticles and protein aggregates. Pharm Res. 2010;27:796–810.
- Parks EJ, Krauss RM, Christiansen MP, et al. Effects of a low-fat, high-carbohydrate diet on VLDL-triglyceride assembly, production, and clearance. J Clin Invest. 1999;104:1087–1096.
- Mathivanan S, Ji H, Simpson RJ. Exosomes: extracellular organelles important in intercellular communication. J Proteomics. 2010;73:1907–1920.
- György B, Modos K, Pallinger E, et al. Detection and isolation of cell-derived microparticles are compromised by protein complexes resulting from shared biophysical parameters. Blood. 2011;117(4):39–48.