
ABSTRACT
Extracellular vesicles (EVs) secreted by prostate cancer (PCa) cells contain specific biomarkers and can be isolated from urine. Collection of urine is not invasive, and therefore urinary EVs represent a liquid biopsy for diagnostic and prognostic testing for PCa. In this study, we optimised urinary EV isolation using a method based on heat shock proteins and compared it to gold-standard ultracentrifugation. The urinary EV isolation protocol using the Vn96-peptide is easier, time convenient (≈1.5 h) and no special equipment is needed, in contrast to ultracentrifugation protocol (>3.5 h), making this protocol clinically feasible. We compared the isolated vesicles of both ultracentrifugation and Vn96-peptide by proteome profiling using mass spectrometry-based proteomics (n = 4 per method). We reached a depth of >3000 proteins, with 2400 proteins that were commonly detected in urinary EVs from different donors. We show a large overlap (>85%) between proteins identified in EVs isolated by ultracentrifugation and Vn96-peptide. Addition of the detergent NP40 to Vn96-peptide EV isolations reduced levels of background proteins and highly increased the levels of the EV-markers TSG101 and PDCD6IP, indicative of an increased EV yield. Thus, the Vn96-peptide-based EV isolation procedure is clinically feasibly and allows large-scale protein profiling of urinary EV biomarkers.
Responsible Editor Suresh Mathivanan La Trobe University AUSTRALIA
Introduction
System-wide profiling of cancer has led to the identification of many important tissue biomarkers. Cancer biomarkers can be found in liquid biopsies, and by this way of testing the need for tumour tissue biopsies that are costly, risky, and painful decreases. Recent improvements in the technology of liquid chromatography–mass spectrometry (LC-MS)/MS proteomics enable a very deep profiling of the proteome of clinical samples [Citation1–Citation3]. This allows us to profile a large proportion of the proteome of liquid biopsies, including urine. Urine is an attractive fluid for diagnosis of cancer, as its collection is not invasive. For prostate cancer (PCa), urine is widely investigated for the use of non-invasive diagnostic testing [Citation4–Citation6]. Because of the anatomical location of the prostate gland, proteins and extracellular vesicles (EVs) that are secreted by prostate (cancer) cells can be found in urine [Citation7,Citation8] and these are increased after digital rectal examination (DRE) [Citation5]. Isolating urinary EVs is an attractive approach to improve the sensitivity and specificity for the detection of relevant PCa secreted protein biomarkers and may overcome the limitations in PCa diagnosis [Citation9]. There is no gold standard for isolation of urinary EVs, however, ultracentrifugation remains the most commonly used method [Citation10,Citation11]. Ultracentrifugation is time consuming, special equipment is needed and it cannot be implemented in the clinic for diagnostic testing. Development of other urinary EV isolation methods that are clinically feasible is needed. Recently, a new rapid EV isolation method was reported [Citation12]. For this new method, we demonstrated that EVs from cell culture media have a similar protein profile (as measured by LC-MS/MS proteomics) as those isolated by ultracentrifugation [Citation13]. This new method is based on the Vn96-peptide which binds to heat shock proteins (HSPs) that are abundant proteins on the surface of EVs and has the capacity to aggregate bound EVs at low centrifugation speed [Citation12]. The EV-aggregating propensity of Vn96-peptides allows simple isolation of “small EVs” at high speed from samples using a standard table-top centrifuge. Although Ghosh et al. demonstrated that urinary EVs can also be isolated using this method [Citation12], no comprehensive comparison of the protein profiles by LC-MS/MS analysis or reproducibility and no optimisation of the isolation procedure were performed. To elaborate on these basic findings, we benchmarked and optimised its performance to ultracentrifugation in replicate proteome analyses and evaluated the suitability of Vn96-peptide-mediated EV isolation from urine samples as a tool to produce EV minipreps for global proteomics and biomarker discovery.
Therefore, in the present study, we investigated whether the isolation of urinary EVs results in similar protein profiles as those isolated by ultracentrifugation using in-depth proteomics based on gel fractionation and nano-liquid chromatography coupled to tandem mass spectrometry (GeLC-MS/MS). Subsequently, we optimised Vn96-peptide-mediated EV capture using a mild detergent.
Materials and methods
Collection of urine samples
For initial optimisation experiments where the concentration of the VN96-peptide was tested and the effect of NP40 on EV yield, urine was collected from healthy male individuals without DRE. For the proteomics experiments, 20–70 ml of urine was used from age-matched patients diagnosed with PCa (Gleason score was adjusted when prostate surgery was performed) or control males (without PCa, confirmed by biopsy). Only men who were scheduled for prostate biopsies, based on elevated prostate-specific antigen (PSA) levels or abnormal DRE were included. Urine was collected in the morning (between 9:00 a.m. and 12:00 a.m.) and first catch urine after DRE was collected. Urine was collected after signed informed consent and approval of the medical ethical committee of the VU University Medical Center. Urine was centrifuged within 1 h of collection at 500g for 10 min at 4°C to remove cells and at 2000g for 20 min at 4°C to remove the debris. The supernatant was subsequently stored at −80°C until EV isolation.
Isolation of urinary EVs
Isolation of urinary EVs using ultracentrifugation was performed as previously described [Citation6,Citation7] with a small modification. In brief, 20–70 ml urine was centrifuged at 2000g for 20 min at 4°C, and subsequently concentrated using a cut-off filter of 100 kDa (Amicon Ultra, Millipore, Amsterdam, The Netherlands) to 2–4 ml of urine. The concentration of urine through this filter will remove proteins that are smaller than 100 kDa, while it retains (concentrates) the EVs. The samples were subsequently aliquoted into 1 ml samples for further EV isolations, thus for each isolation method equal volumes of urine are used Where indicated, detergent Nonidet™ P 40 Substitute (NP40, Sigma-Aldrich, Zwijndrecht, The Netherlands) at concentrations varying from 0% to 0.1% was added. Concentrated urine samples were centrifuged at 16,000g for 20 min to remove larger sized vesicles and debris. For ultracentrifugation, the concentrated urine was centrifuged at 100,000g for 90 min at 4°C. The EV pellet was washed in PBS and subsequently centrifuged at 100,000g for 90 min at 4°C (see schematic overview in )). The EV pellet was dissolved in SDS-sample buffer, and stored at −20°C. For isolation with the ME-Kit (microvesicles enrichment kit (#W1073-2, New England Peptide, USA), 1 ml concentrated urine was incubated with 50–100 µg of Vn96-peptide and protease inhibitor cocktail (PIC, #10276200, Roche) for 1 h at room temperature (RT). After incubation, the samples were centrifuged at 16,000g for 10 min at RT and the pellet was washed in PBS with PIC. The sample was centrifuged again at 16,000g for 10 min at RT. The EV pellet was dissolved in sample buffer and stored at −20°C.
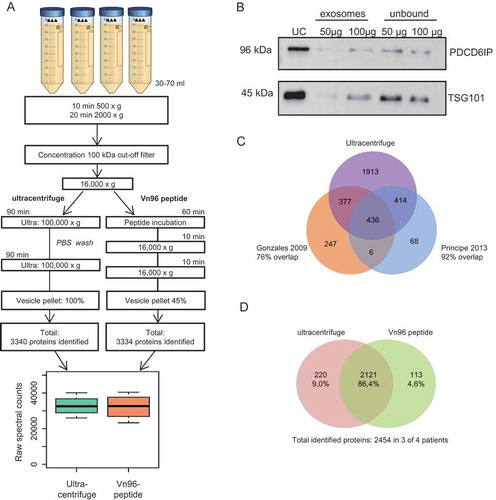
Figure 1. Comparison between ultracentrifuge and Vn96-peptide for urinary EV isolation. (a) Schematic overview of urinary EV isolation between ultracentrifuge and the easier and shorter protocol by using the Vn96-peptide. Of the ultracentrifuge EV sample 100% was used for LC-MS/MS analysis, while for the Vn96-peptide 45% was used for LC-MS/MS analysis. Both isolation methods resulted in a comparable number of identified proteins by LC-MS/MS and total spectral counts. (b) Representative western blot (of n = 3) showing the effect of 50 and 100 µg of the Vn96-peptide and the abundancy of PDCD6IP and TSG101. UC = ultracentrifuge, unbound indicates isolated EVs from supernatant after isolation with VN96-peptide. (c) Venn diagram comparing the identified proteins in urinary EVs isolated by ultracentrifugation between our study and data available from others Citation15,Citation16. (d) Venn diagram indicating the number of overlapping proteins between exosomes isolated using the ultracentrifuge and VN96-peptide. Shown proteins were identified in at least 3 of the 4 patients in each group.
Western blotting
Western blot was performed as described previously [Citation7]. The membranes (Immobilon-P PVDF, #IPVH00010, Millipore) were incubated with mouse anti-PDCD6IP (1:500; #2171, Bioke, Leiden, The Netherlands) and goat anti-TSG101 (1:1000; # HPA006161, Sigma-Aldrich) O/N at 4°C. Secondary anti-mouse or anti-rabbit-HRP were incubated for 1 h at RT and subsequently washed with PBS-Tween (0.05% Tween-20). HRP signals were developed using ECL (SuperSignal™ West Pico, Thermo Fisher, Breda, The Netherlands) and were scanned using the Uvitec Alliance 4.7 (Uvitec, Cambridge, UK).
Protein fractionation, in-gel digestion, nano-LC-MS/MS and database searching
Proteomics has been performed as described previously [Citation14]. In brief, samples were loaded on gradient gels from Invitrogen (NuPAGE 4–12% Bis-Tris gel, 1.5 mm ×10 wells). The gels were then stained with Coomassie brilliant blue G-250 (Pierce, Rockford, IL) and washed and dehydrated once in 50 mM ammonium bicarbonate (ABC) and twice in 50 mM ABC/50% acetonitrile (ACN). Cysteine bonds were reduced by incubation with 10 mM DTT/50 mM ABC at 56°C for 1 h and alkylated with 50 mM iodoacetamide/50 mM ABC at RT for 45 minutes. Each gel lane was sliced in five bands and further sliced up into approximately 1 mm cubes and incubated overnight at 23°C with 6.25 ng/ml trypsin (Promega, sequence grade V5111). For the experiment described in , the top gel-band failed due to human error, and therefore only 4 bands were measured, leading to slightly lower numbers of identified proteins in the samples of this experiment as compared to the experiment reports in . Peptides were extracted once in 1% formic acid and twice in 5% formic acid/50% ACN. Extracted peptides were concentrated in a vacuum centrifuge (Eppendorf) to 50 µl. Peptides (5 µl) were separated on a 75 µm × 42 cm custom packed Reprosil C18 aqua column (1.9 µm, 120 Å) in a 90 min. gradient (2–32% acetonitrile + 0.5% acetic acid at 300 nl/min) using a U3000 RSLC high pressure nanoLC (Dionex). Eluting peptides were measured on-line by a Q Exactive mass spectrometer (Thermo Fisher) operating in data-dependent acquisition mode. Peptides were ionised using a fused silica emitter (New Objective, Woburn MA)with a distal high voltage of +2 kV. Intact peptide ions were detected at a resolution of 35,000 (at m/z 200) and fragment ions at a resolution of 17,500 (at m/z 200); the MS mass range was 350–1400 Da. AGC Target settings for MS were 3E6 charges and for MS/MS 2E5 charges. Peptides were selected for higher-energy dissociation (HCD) fragmentation at an underfill ratio of 1% and a quadrupole isolation window of 1.5 Da; peptides were fragmented at a normalised collision energy of 25. Raw files from MS analysis were processed using the MaxQuant (version 1.5.2.8). MS/MS spectra were searched against the Swissprot human database (download September 2015, canonical and isoforms; 42,122 entries) with a precursor tolerance of 4.5 ppm and an MS/MS tolerance of 20 ppm. Peptides with a minimum of seven amino acid lengths were considered with both the peptide and protein false discovery rate (FDR) set to 1%. Enzyme specificity was set to trypsin and up to two missed cleavage sites were allowed. Cysteine carbamidomethylation (Cys) was searched as a fixed modification, whereas N-acetylation of proteins and oxidised methionine (Met) were searched as variable modifications (default MaxQuant settings).
Figure 2. Comparison of identified proteins between ultracentrifuge and Vn96-peptide by LC-MS/MS. (a) Venn diagrams showing the identified proteins in ultracentrifuge and Vn96-peptide within urinary EVs from the same donor. (b) Correlation analysis of proteins identified in urinary EVs isolated by ultracentrifuge compared to Vn96-peptide (kit). (c) Bar graph showing the abundancy of 7 EV protein markers in urinary EVs isolated by ultracentrifuge and Vn96-peptide. Spectral counts for the Vn96-peptide were corrected for 45% input in the measurement, and show a comparable abundancy of each proteins within the samples. (d) Comparative analysis showing the cellular component enrichment of identified proteins. Most identified proteins were related to exosomes, lysosome and extracellular proteins.
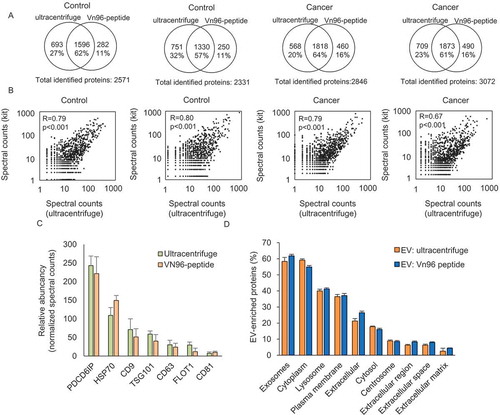
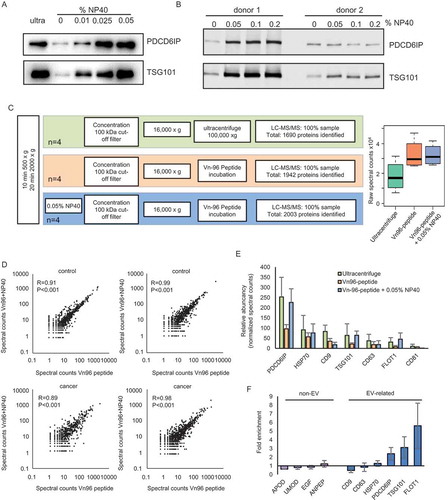
Figure 3. Effect of addition of NP40 to urinary EVs. (a) Western blot showing an increased expression of PDCD6IP and TSG101 after addition of increasing concentrations of the detergent NP40 during EV isolation. (b) Western blot showing that further increasing the concentration of NP40 does not lead to a further increase in the expression of PDCD6IP and TSG101. (c) Schematic overview of the proteomics workflow of isolating EVs and boxplot showing the total raw spectral counts. (d) Correlation analysis of proteins identified using LC-MS/MS in urinary EVs isolated by the Vn96-peptide (kit) or the Vn96-peptide with addition of 0.05% NP40. (e) Bar graph showing the abundancy of 7 EV-markers between the EVs isolated by ultracentrifuge, VN96-peptide and Vn96-peptide + 0.05% NP40. (f) Enrichment of non-EV related proteins and EV-related proteins after addition of NP40, showing a small reduction in several background proteins, and an increase in EV-markers.
Protein analysis
Proteins were label-free quantified by spectral counting. Normalisation was performed as previously described [Citation17], where the spectral counts of each protein are divided by the total spectral counts of all proteins within a sample. This number was multiplied with a constant equal to the average of total spectral counts of all samples. Normalisation and statistical testing using the paired beta-binominal test was performed using R [Citation17]. In the initial comparison ultracentrifugation versus kit, urine samples from four different donors were compared, of which two were control males and two PCa patients. In the experiment where the comparison was made between isolations using ultracentrifuge, Vn96-peptide and Vn96-peptide + 0.05% NP40, four urine samples were used, of which two were control males and two PCa patients. Identified proteins were analysed for the presence of a transmembrane domain using TMHMM Server v. 2.0 (http://www.cbs.dtu.dk/services/TMHMM/). Funrich was used as gene ontology mining tool [Citation18,Citation19].
Results
Urinary EVs isolated by the Vn96-peptide and ultracentrifugation show a similar protein profile
For clinical application of urinary EVs in diagnostic testing, a convenient, robust and scalable EV isolation method is essential. The ultracentrifugation procedure is very labour-intensive; therefore, we assessed whether the commercially available Vn96-peptide-based isolation method (ME-kit) is more convenient in use and the whether the isolated small EV populations that are recovered at high speed were similar by measuring the protein profiles (GeLC-MS/MS). The isolation time was short ≈2 h in a simple table-top centrifuge, compared to ≈4.5 h using ultracentrifugation ()). We tested two amounts of Vn96-peptide for EV isolation from 1 ml of concentrated urine: 50 µg and 100 µg, with 50 µg being specified in the manufacturer’s instructions. About twofold more EVs were isolated using 100 µg peptide compared to 50 µg peptide, as determined by the levels of the EV-markers PDCD6IP and TSG-101 by western blotting ()).
To test whether the protein profile of the isolated EVs was similar to that obtained by ultracentrifugation, we isolated urinary EVs of two control males and two PCa patients. This allows evaluation of whether cancer patients have similar EV profiles as assessed by both methods and whether the kit is compatible for the detection of cancer-related EVs. For label-free proteomics, we aimed at comparable concentrations of proteins as input. Therefore, 100% of the ultracentrifuge sample was loaded on the gel and 45% of the Vn96-peptide samples () and Supplemental )). Both isolation methods resulted in a similar number of identified proteins ()), with a total of 3340 and 3334 proteins identified in EVs isolated by Ultracentrifugation and Vn96-peptide, respectively. The overlap between proteins identified in EVs by both isolation methods was >86% ()). For each patient, several unique proteins were identified in EVs isolated by either ultracentrifugation or the Vn96-peptide ()). However, these proteins were frequently low abundant (relative spectral counts <5) (Supplemental Tables 1 and 2). The identified proteins in the ultracentrifuge-EV pellet showed a large overlap between other available datasets () [Citation15,Citation16]. Notably, we identified many more proteins (e.g. total 3140 with 1913 unique proteins) using our optimised GeLC-MS/MS approach/workflow. We found a substantial overlap (≈60%) between the identified proteins using the two EV isolation methods in all four urine samples ()). The overlap between proteins that were identified consistently between the 4 pairs of donors was even higher (>86%), indicating that both isolated fractions are highly similar () and Supplemental Table 3). In addition, the correlation of protein levels between EVs isolated using ultracentrifugation and the Vn96-peptide was high ()). In line with this, EVs isolated by ultracentrifugation and Vn96-peptide had similar pattern of spectral count based abundancy between known EV-markers (Supplemental )). However, the abundancy of EV-markers seemed somewhat lower for vesicles isolated by the Vn96-peptide. This may be related to the 2.2-fold lower input for the EVs that were isolated by the Vn96-peptide. When the counts are corrected for the lower input, the abundancy of the EV-markers is similar between the two methods ()). GO-term analysis confirms that EVs were enriched in both isolated fractions, and with the Vn96-peptide a somewhat higher enrichment of extracellular proteins are identified ()). Overall, these data indicate that the Vn96-peptide method isolates a similar EV fraction as the ultracentrifugation method.
Reduction of background proteins by detergent
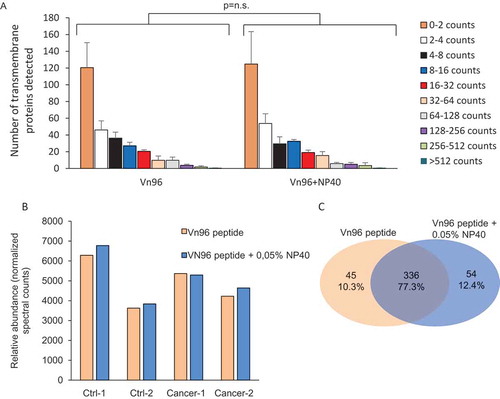
In the proteomics data, we observed various highly abundant proteins, including some that are not directly related to EVs, including UMOD, ANPEP, EGF and APOD. To reduce abundant background proteins, we evaluated whether addition of mild detergent NP40 during EV isolation could improve EV isolation. Addition of detergent indeed increased the EV-yield, as both PDCD6IP and TSG101 levels increased in EVs isolated in the presence of increasing concentrations of NP40 ()). Increasing the concentration higher than 0,05% did not further increase the EV-yield ()). We determined whether NP40 affects the general protein profile, and whether background proteins were reduced by Coomassie staining and LC-MS/MS ()). Overall, the general protein profile did not change when NP40 was added during the EV isolation (,)). The correlation of protein expression between Vn96-peptide and Vn96-pepeptide + NP40 isolated EVs varied from 0.89 to 0.99 ()), demonstrating that the isolated fractions are very similar. In this dataset, the correlation between EV-markers and other classes of proteins [Citation10] and between proteins identified in Vn96-peptide and ultracentrifuge isolated EVs was similar as found in the first proteomics experiment (, Supplemental and and Table 4), indicative of a high consistency in the urinary EV isolation method. Importantly, we observed that the abundance of EV-markers was increased by using NP40 ()). Analysis on background proteins showed that the top 30 most abundant proteins were not significantly reduced by NP40 (Supplemental )). Various background proteins were somewhat decreased, but the decrease was in general not very high (e.g. around 1.2–1.5-fold) (Supplemental Table 5). Therefore, NP40 reduces the overall level of background proteins only to some extent. We noticed that CD9 levels were reduced and CD63 levels were not increased compared to other EV-related proteins. Other tetraspanins were not decreased (Supplemental and 5), therefore the reduction is not specific for these proteins. Because these proteins are transmembrane proteins, we analysed whether the detergent has any effect on the levels of other transmembrane proteins. For each identified protein, the number of transmembrane regions was predicted using TMHMM. Proteins were grouped based on their abundance (spectral counts) and for each group, the total number of proteins with at least 1 transmembrane domain were selected (). No significant changes between the predicted transmembrane proteins of EVs isolated by Vn96-peptide and with or without addition of NP40 were found ( and Supplemental )). The number of predicted transmembrane proteins had a high overlap (Supplemental ). Therefore, NP40 does not seem to affect the levels of the transmembrane proteins, while it reduces background proteins and improves the isolation of EVs.
Figure 4. Effect of NP40 on the abundancy of predicted transmembrane proteins. (a) Effect of 0.05% NP40 on the detection of predicted transmembrane proteins showing no effect on the number of proteins identified in any of the abundancy classes. (b) Effect of NP40 on the total normalised spectral counts of the total of transmembrane proteins. (c) Venn diagram of transmembrane proteins in Vn96-peptide with and without NP40.
Discussion
In the present study, we show that in terms of identified proteins (>86% overlap; ≈3000 proteins) and associated gene ontologies, the proteome of urinary EVs isolated by the simple Vn96-peptide based capture method is largely comparable to that of EVs isolated by ultracentrifugation. The majority of the EV-associated proteins identified in Vn96-peptide isolated EV fractions show a high quantitative correlation of spectral counts to the EV proteins captured by ultracentrifugation (r = 0.7–0.8). Therefore, this novel capture approach indeed isolates EVs and its ease-of-use will enable clinical implementation of EV-based applications and will allow large-scale profiling to identify and validate urinary EV biomarkers.
An improved detection of several EV-markers, possibly through a mild reduction of non-EV related background proteins is achieved by adding detergent. In general, the abundancy of transmembrane proteins was not changed, thus the detergent does not reduce these proteins. Previously it was shown that detergent may decrease the number of larger vesicles in the sample [Citation20]. CD9 is expressed in all vesicles sizes, while TSG101 is more specific for smaller EVs [Citation21]. From electron microscopy pictures of urinary EVs isolated by ultracentrifugation we estimated that about 10% of the isolated vesicles are larger than 300 nm, while the most dominant EVs are sized 50–300 nm [Citation6]. The protein profiles between ultracentrifugation and Vn96-peptide are very similar, therefore we expect that both isolation methods isolate a comparable pool of EVs from urine. Size evaluation of EVs isolated by the Vn96-peptide is not possible due to the large aggregations, therefore we cannot determine whether detergent at 0.05% affected the larger-sized vesicle populations. However, for diagnostic use, the specific size or origin of the isolated EVs are not relevant.
For measuring PCa biomarkers, evaluation for identification of PCa biomarkers in urinary EVs isolated by our optimised method using the Vn96-peptide shows its feasibility for this purpose. Notably, the depth of GeLC-MS/MS profiling is important to allow identification and validation of biomarkers. In the present study, we identified more than 3000 urinary EV-proteins, with about 2400 proteins that were detected consistently between different donors. That we achieved such greater depth in the identification of amount of proteins compared to others [Citation15,Citation16] may be related to our optimised proteomics GeLC-MS/MS workflow [Citation14,Citation22]. Additional protein profiling of urinary EVs from larger sized cohorts of PCa patients may enable to identify PCa associated proteins, and may also allow identification of proteins that are specifically secreted within EVs secreted by cancer cells. For example, transmembrane proteins may be used for specific EV-capture, as also demonstrated using Glypican-1 for pancreatic cancer [Citation23]. In conclusion, the Vn96-peptide-based EV isolation procedure is clinically feasibly and allows high-throughput profile and validation of urinary EV biomarkers.
suppl_Figures-revisedv2_final.pdf
Download PDF (1.3 MB)Suppl_Table_5r.xlsx
Download MS Excel (19.4 KB)Suppl_Table_2.xlsx
Download MS Excel (18.3 KB)Suppl_Table_1.xlsx
Download MS Excel (25.9 KB)Suppl_Table_4_r2.xlsx
Download MS Excel (501.9 KB)Suppl_Table_3_-_final_revision_2.xlsx
Download MS Excel (496.9 KB)Acknowledgments
The Dutch Cancer Society (IMMPROVE, EMCR 2015-8022) financially supported this study. We thank Jannette Bossenga for the collection of the urine samples.
Disclosure statement
No potential conflict of interest was reported by the authors.
Supplemental data
Supplemental data for this article can be accessed here.
Additional information
Funding
Related Research Data
References
- Tyanova S, Albrechtsen R, Kronqvist P, et al. Proteomic maps of breast cancer subtypes. Nat Commun. 2016;7:1. DOI:10.1038/ncomms10259
- Chiasserini D, van Weering JRT, Piersma SR, et al. Proteomic analysis of cerebrospinal fluid extracellular vesicles: a comprehensive dataset. J Proteomics. 2014;106:191–9. DOI:10.1016/j.jprot.2014.04.028
- Jimenez CR, Verheul HM. Mass spectrometry-based proteomics: from cancer biology to protein biomarkers, drug targets, and clinical applications. Am Soc Clin Oncol Educ Book. 2014;34:e504–e510. DOI:10.14694/EdBook_AM.2014.34.e504
- Duijvesz D, Luider T, Bangma CH, et al. Exosomes as biomarker treasure chests for prostate cancer. Eur Urol. 2011;59:823–831. DOI:10.1016/j.eururo.2010.12.031
- Dijkstra S, Birker IL, Smit FP, et al. Prostate cancer biomarker profiles in urinary sediments and exosomes. J Urol. 2014;191:1132–1138. DOI:10.1016/j.juro.2013.11.001
- Koppers-Lalic D, Hackenberg M, de Menezes R, et al. Noninvasive prostate cancer detection by measuring miRNA variants (isomiRs) in urine extracellular vesicles. Oncotarget. 2016;7:22566–22578. DOI:10.18632/oncotarget.8124
- Bijnsdorp IV, Geldof AA, Lavaei M, et al. Exosomal ITGA3 interferes with non-cancerous prostate cell functions and is increased in urine exosomes of metastatic prostate cancer patients. J Extracell Vesicles. 2013;2:1–10. DOI:10.3402/jev.v2i0.22097
- Nilsson J, Skog J, Nordstrand A, et al. Prostate cancer-derived urine exosomes: a novel approach to biomarkers for prostate cancer. Br J Cancer. 2009;100:1603–1607. DOI:10.1038/sj.bjc.6605058
- Leyten GHJM, Hessels D, Smit F, et al. Identification of a candidate gene panel for the early diagnosis of prostate cancer. Clin Cancer Res. 2015;21:3061–3070.
- Lötvall J, Hill AF, Hochberg F, et al. Minimal experimental requirements for definition of extracellular vesicles and their functions: a position statement from the International Society for Extracellular Vesicles. J Extracell Vesicles. 2014;3:26913. DOI:10.3402/jev.v3.26913
- Théry C, Amigorena S, Raposo G, et al. Isolation and characterization of exosomes from cell culture supernatants and biological fluids. Curr Protoc Cell Biol. 2006;1–29. DOI:10.1002/0471143030.cb0322s30
- Ghosh A, Davey M, Chute IC, et al. Rapid isolation of extracellular vesicles from cell culture and biological fluids using a synthetic peptide with specific affinity for heat shock proteins. PLoS One. 2014;9:e110443. DOI:10.1371/journal.pone.0110443
- Knol JC, de Reus I, Schelfhorst T, et al. Peptide-mediated “miniprep” isolation of extracellular vesicles is suitable for high-throughput proteomics. EuPA Open Proteomics. 2016;11:11–15.
- Piersma SR, Fiedler U, Span S, et al. Workflow comparison for label-free, quantitative secretome proteomics for cancer biomarker discovery: method evaluation, differential analysis, and verification in serum. J Proteome Res. 2010;9:1913–1922. DOI:10.1021/pr901072h
- Gonzales PA, Pisitkun T, Hoffert JD, Tchapyjnikov D, Star RA, Kleta R, Wang NS, Knepper MA. Large-scale proteomics and phosphoproteomics of urinary exosomes. J Am Soc Nephrol. 2009;20(2):363–379. doi: 10.1681/ASN.2008040406
- Principe S, Jones EE, Kim Y, Sinha A, Nyalwidhe JO, Brooks J, Semmes OJ, Troyer DA, Lance RS, Kislinger T, Drake RR. In-depth proteomic analyses of exosomes isolated from expressed prostatic secretions in urine. Proteomics. 2013;13(10–11):1667–1671. doi: 10.1002/pmic.201200561
- Pham TV, Jimenez CR. An accurate paired sample test for count data. Bioinformatics. 2012 Sep 15;28(18):i596–i602. DOI:10.1093/bioinformatics/bts394
- Pathan M, Keerthikumar S, Ang C-S, et al. FunRich: an open access standalone functional enrichment and interaction network analysis tool. Proteomics. 2015;15:2597–2601. DOI:10.1002/pmic.201400515
- Benito-Martin A, Peinado H. FunRich proteomics software analysis, let the fun begin! Proteomics. 2015;15:2555–2556. DOI:10.1002/pmic.201500260
- Osteikoetxea X, Sódar B, Németh A, et al. Differential detergent sensitivity of extracellular vesicle subpopulations. Org Biomol Chem. 2015;13:9775–9782. DOI:10.1039/c5ob01451d
- Kowal J, Arras G, Colombo M, et al. Proteomic comparison defines novel markers to characterize heterogeneous populations of extracellular vesicle subtypes. Proc Natl Acad Sci U S A. 2016;113:E968–E977. DOI:10.1073/pnas.1521230113
- Piersma SR, Warmoes MO, de Wit M, et al. Whole gel processing procedure for GeLC-MS/MS based proteomics. Proteome Sci. 2013;11:17. DOI:10.1186/1477-5956-11-17
- Melo SA, Luecke LB, Kahlert C, et al. Glypican-1 identifies cancer exosomes and detects early pancreatic cancer. Nature. 2015 Jul 9;523:177–182. DOI:10.1038/nature14581