
ABSTRACT
Human proximal tubular epithelial cells (PTEC) of the kidney are known to respond to and mediate the disease process in a wide range of kidney diseases, yet their exosomal production and exosome molecular cargo remain a mystery. Here we investigate, for the first time, the production and molecular content of exosomes derived from primary human PTEC cultured under normal and diseased conditions representing a spectrum of in vivo disease severity from early inflammation, experienced in multiple initial kidney disease states, through to hypoxia, frequently seen in late stage chronic kidney disease (CKD) due to fibrosis and vascular compromise. We demonstrate a rapid reproducible methodology for the purification of PTEC-derived exosomes, identify increased numbers of exosomes from disease-state cultures and identify differential expression levels of both known and unique miRNA and protein species from exosomes derived from different disease-culture conditions. The validity of our approach is supported by the identification of miRNA, proteins and pathways with known CKD associations, providing a rationale to further evaluate these novel and known pathways as targets for therapeutic intervention.
RESPONSIBLE EDITOR Giovanni Camussi Universita degli Studi di Torino ITALY
Introduction
Extracellular vesicles (EVs) have been collectively recognised as fundamental components of intercellular communication that can be broadly grouped into three main classes (exosomes, microvesicles and apoptotic bodies) according to their biogenesis, size and molecular cargo. Of these, exosomes are produced within the multivesicular endosome compartments of the cell and are secreted when these compartments fuse with the plasma membrane [Citation1]. They are characterised on their size distribution (50–120 nm) and expression of certain tetraspanins including CD9, CD63 and CD81 [Citation2]. This specialised subset of EVs is secreted by many different cell types in a constitutive process [Citation3], but their numbers have also been shown to be increased in oxidative stress and hypoxia [Citation4,Citation5]. They have been demonstrated to play a major role in cell-to-cell communication and carry a cargo of specific bioactive proteins, lipids, mRNA and miRNA to facilitate this communication. Over recent years exosomes and their specific molecular cargo have also been implicated as both positive and negative disease progression mediators, prompting much investigation into their role as novel biomarkers and potential therapeutic targets [Citation6,Citation7].
Renal researchers have also reported exosome production from the kidney and it is emerging that they play a role in embryonic renal development [Citation8], intra-tubular cellular communication [Citation9], tumour development [Citation10], disease progression [Citation11] and disease control [Citation12]. Urinary exosomes derived from the kidney also offer the potential for novel non-invasive biomarkers of specific kidney diseases and the monitoring of acute and chronic kidney disease (CKD) [Citation13–Citation16]. A number of research groups have purified exosomes from urine of people with diseased and normal kidneys and characterised their miRNA and protein content using gene array and mass spectrophotometry in efforts to identify suitable molecular candidates. However, most of these studies are unable to define the cellular source of urinary exosomes as they may originate from any cell type lining the urinary space from podocytes through proximal and distal renal epithelial cells down to urethral–bladder epithelial cells. In addition, glomerular damage that occurs in numerous kidney diseases may even allow the filtering of exosomes direct from the circulating plasma.
Proximal tubular epithelial cells (PTEC) of the kidney are known to respond to and mediate the disease process in a wide range of kidney diseases [Citation13] and we have demonstrated that they may play a regulatory role during the initial acute injury phase, characterised by inflammation [Citation14,Citation15], but a pathogenic role in the developed chronic fibrotic disease state, characterised by hypoxia [Citation16,Citation17]. PTEC are uniquely sensitive to the hypoxic conditions that prevail in renal fibrosis, a common pathological finding in multiple renal diseases. These perturbed PTEC undergo multiple molecular and cellular changes [Citation17,Citation18] and it seems very likely that such perturbation would also induce changes within their exosome profile. Minimal work using mouse models and transformed human PTEC cell lines has demonstrated that PTEC-derived exosomes may also play a role in disease progression [Citation11]. However, to our knowledge, no one has directly characterised exosomes from human primary PTEC under normal or diseased conditions. To address this issue we purified and characterised exosomes from primary human PTEC that were cultured under normal conditions and under inflammatory and hypoxic conditions to mimic the acute and chronic conditions likely to be encountered by these cells in vivo.
Our results demonstrate that exosomes are readily purified from human primary PTEC using a reproducible commercially available kit, that production of exosomes are elevated under inflammatory and hypoxic states and that these “perturbed” exosomes contain condition-specific miRNA species and proteins linked to renal pathological processes.
Materials and methods
Isolation and culture of human primary PTEC
Renal cortical tissue was obtained with informed patient consent from the macroscopically/microscopically healthy portion of tumour nephrectomies, following approval by the Royal Brisbane and Women’s Hospital Human Research Ethics Committee (2006/072). PTEC were purified following the method of Glynne and Evans [Citation19] and cultured in defined medium (DM) as previously described [Citation20]. All PTEC underwent a maximum of three passages prior to use in this study.
Activation of human primary PTEC to mimic the disease state
PTEC were cultured in DM to 70–80% confluence and then further cultured for 72 h in fresh DM for normal control PTEC, in fresh DM in the presence of IFN-γ (100 ng/ml) and TNF-α (20 ng/ml) (both from R&D Systems, Minnesota, USA) for inflammatory PTEC and in fresh DM (pre-treated to hypoxia (1% O2 for 24 h) and then cultured under 1% O2 hypoxia for 72 h in an Invivo2 1000 Hypoxia Workstation (Ruskinn Laftec, Bayswater North, Victoria, Australia). Cell culture supernatants were harvested for exosome purification and subsequent analysis, whilst PTEC were harvested for HLA-DR and PD-L1 expression by flow cytometry and protein extraction for HIF-1α expression by Western blotting where required.
Exosome purification
Ultracentrifugation/density gradient (UC/DG)
PTEC cell culture medium (75 ml) was centrifuged at 300g for 10 mins at 4°C and filtered through a 0.22 µm filter (Merck Millipore, Bayswater, Victoria, Australia) to remove contaminating apoptotic bodies and cell debris. The clarified supernatant was then centrifuged at 100,000g overnight at 4°C using a SW31Ti rotor to pellet exosomes. Each crude exosome pellet was re-suspended in 1 ml of ice-cold PBS, pooled and re-centrifuged on a TLA100.3 rotor at 100,000g for 1 h at 4°C. Pellets were then washed a further two times at 100,000g for 30 mins at 4°C and re-solubilised in 200 μl PBS. This sample was applied to a 5–40% Iodixanol gradient (in 0.25 M sucrose 10 mM Tris pH 7.2) and centrifuged at 100,000g for 18 h at 4°C. One millilitre fractions were harvested from the gradient, the absorbance of each fraction measured at 244 nm and fraction 1.12–1.24 g/ml Iodixanol (calculated via the Beer–Lambert law) containing the exosomes was then washed and ultracentrifuged at 100,000g for 2 h at 4°C, followed by a final wash at 100,000g for 30 mins and resuspension in 20 μl PBS.
Commercial kit purification
Exosomes from PTEC cell culture medium (75 ml), from the same pool used in the UC/DG experiments, were purified using the exoEasy Maxi Kit (Qiagen, Melbourne, Vic. Australia) as per the manufacturer instructions. Following the final step exosomes were ultracentrifuged at 100,000g for 30 mins at 4°C and re-solubilised in 20 μl PBS.
Exosome purification from donor PTEC cultured under normal and disease conditions
Six separate donor PTEC samples were cultured under normal, inflammatory and hypoxic conditions for 3 days. Exosomes were purified from 180 ml of PTEC culture supernatants, from each culture condition, using the exoEasy Maxi Kit from Qiagen. The concentration and size distribution of particles was analysed with tuneable resistive pulse sensing (TRPS) (qNano, Izon Science Ltd. Christchurch, New Zealand) following the method of Lobb et al. [Citation21]. Briefly, a NP100 nanopore was used at a 45 mm stretch and the concentration of particles was standardised using multi-pressure calibration with 70 nm carboxylated polystyrene beads at a concentration of 1.5 × 10¹¹ particles/ml.
Electron microscopy
Ten microlitres of exosome suspension were applied on a Formvar-coated and carbon stabilised copper grid and stained with 1% aqueous uranyl acetate. Samples were examined using a JEM 1011 transmission electron microscope operated at 80 kV and equipped with a digital camera.
Flow cytometry
For surface HLA-DR and PD-L1 expression, single cell suspensions were initially stained with LIVE/DEAD® Fixable Near-IR Dead Cell Stain Kit (Invitrogen) to allow exclusion of non-viable cells. Cells were then stained on ice for 30 min with combinations of test (0.25 μg per antibody) or isotype-matched control antibodies in cold FACS buffer [0.5% BSA (Sigma, St Louis, MO, USA) and 0.02% sodium azide (Sigma) in PBS]. Anti-HLA-DR-APC (clone G46-6) was from BD Biosciences (San Jose, CA, USA) and anti-PD-L1-BV421 (clone 29E.2A3) was from Biolegend (San Diego, CA, USA). Cell acquisition was performed on an LSR Fortessa (BD, San Jose, CA, USA) and data analysed with FlowJo software (TreeStar, Ashland, OR, USA).
Western blotting
Antibodies (Ab) used in western blot (WB) included CD9 (Clone Ts9, Invitrogen/Thermo Fisher Scientific, Carlsbad, CA, USA), CD63 (Clone Ts63, Invitrogen/Thermo Fisher Scientific), CD81 (Clone M38, Invitrogen/Thermo Fisher Scientific), HIF-α (Clone 54/HIF-1α, BD Biosciences), calnexin (Clone AF18, Santa Cruz, Dallas, Texas. USA) and beta-tubulin (Cat. No. ab6046, Abcam, Melbourne, Vic. Australia). Cells and exosomes were lysed with RIPA/PI buffer and protein content determined using the BCA protein assay (Pierce/Thermo Fisher Scientific). PAGE was undertaken using standard reagents from Invitrogen. Samples were denatured for 5 mins at 95°C, loaded onto Bolt™ 4–12% Bis-Tris Plus Gels, run at 165 V for 38 mins and transferred to nitrocellulose membrane at 10 V for 60 mins. Membranes were probed with primary Ab overnight at 4°C, blocked for 1 h at RT using Odyssey® blocking buffer (LI COR, Lincoln, NE USA) and visualised with IRDye 800CW Goat anti-Mouse (Millennium Science, Mulgrave, Vic. Australia) or IRDye 680LT Goat anti-Rabbit (Millennium Science) using the Odyssey CLX (LI COR) and Image Studio 2.0 software (LI COR).
miRNA analysis
RNA was isolated using a Qiagen RNeasy Kit. The manufacturer’s protocol was varied by replacing washing Buffer RW1 with Buffer RWT which prevents the miRNA from being washed off the column prior to elution. RNA QC was performed on a BiOptics QSep and a Thermofisher NanoDrop 2000; 500 ng of exosome RNA were then used to create an RNAseq library using the NEBNext Small RNA Library Prep Kit (NEB), and sequenced at 1 × 36bp on an Illumina NextSeq 500. FastQ files were aligned to a reference consisting of pre-miRNA hairpins from miRBase v21 (http://miRBase.org). Alignment was performed using RNA-STAR v2.3.0 (reference: http://bioinformatics.oxfordjournals.org/content/29/1/15.full) using the following parameters: “–runThreadN 16 – outSAMattributes All – outFilterMultimapNmax 1”, and all other parameters at default. Differential miRNA expression was calculated using the R Bioconductor package edgeR. MiRNAs with less than 10 total counts were filtered, and the libraries were normalised using the TMM method. MiRNAs were considered as statistically significantly differentially expressed when the log2 fold change was greater than 1, and the adjusted p-value (accounting for multiple testing false discovery rate (FDR) correction) was less than 0.05.
Reduction, alkylation and tryptic digest of exosome proteins for tandem mass spectrometry
Purified exosomes were lysed with a 1% SDS, 10 mM CHAPS, 5 mM MgCl2 in 100 mM TEAB for 30 min under agitation at 4°C and the total exosomal protein content was determined for each samples by Pierce BCA protein assay (Thermo Scientific). Exosome proteins were then prepared for mass spectroscopy using a modified FASP protocol as previously described [Citation22]. Briefly, proteins were reduced, alkylated and digested on a 30 kDa molecular weight cut-off membrane in 96-well plates. Recovered peptides were dried in a speed vacuum for 4 h at 45°C.
Tandem mass spectrometry
Tryptic peptides were solubilised in a solution of 0.1% trifluoroacetic acid (TFA), desalted on ZipTip C18 pipette tips (Millipore) and spiked with iRT calibrant (Biognosys, Zurich, Switzerland) for use in spectral library generation [Citation23]. Peptides were then chromatographically separated before tandem mass spectrometry in IDA mode on an AB Sciex 5600+ TripleTOF as previously described [Citation24]. For SWATH acquisition, the mass spectrometer was operated under the same conditions as for the DDA experiments and a rolling collision energy method was used to fragment all ions in a set of 26 sequential overlapping windows of 25 AMU over a mass range coverage of 350–1000 (m/z). An accumulation time of 100 ms was used for each fragment ion scan resulting in a total cycle time of 2.9 s. Data was acquired and processed using Analyst TF 1.7 software (AB SCIEX).
Spectral searches and library generation from DDA files
Spectral searches of processed LC-MS/MS data were performed using ProteinPilot v4.5 (AB SCIEX) using the Paragon algorithm (version 4.5.0.0). Background correction was used and biological modifications specified as an ID focus. The detected protein threshold was set as 0.5 and the FDR was calculated using searches against a decoy database comprised of reversed sequences. Searches were conducted against the UniProt human reference proteome set comprising 70,236 protein sequences (downloaded 30 March 2016). For spectral library generation X! Tandem Jackhammer TPP (2013.06.15.1) was used to search all DDA files against a target/decoy version of the UniProt human reference proteome set additionally containing a reversed version of each sequence and the iRT sequences as previously described [Citation25]. OpenSwath was used to conduct searches against the spectral library using a FDR below 0.1% as previously described [Citation23]. Feature alignment was performed using the transition of identification confidence algorithm (https://pypi.python.org/pypi/msproteomicstools) and the R package SWATH2stats [Citation26] was used to filter low scoring peak groups and remove proteins with less than two associated peptides. MSstats [Citation27] was used to generate differential expression values with an adjusted p-value ≤ 0.05 considered significant.
Pathway analysis
Annotations for significantly dysregulated proteins were obtained using the Qiagen ingenuity pathway analysis (IPA) program following the core analysis workflow using standard parameters: stringent filter for molecules and relationship and no protein fold change cut-off applied. Readouts included the “Disease and Biological Function”, “Tox” clustering and “Networks” pathway analyses.
Results
Exosomes purified from normal primary human PTEC
We undertook initial experiments to compare the purity and recovery rates of exosomes, from the cell culture media of PTEC cultured under normal conditions, using ultracentrifugation-density gradient (UC-DG) purification versus a rapid commercial kit procedure. Western Blotting of proteins extracted from both populations of exosomes demonstrated the presence of the canonical exosome protein CD9 and the absence of the endoplasmic reticulum protein Calnexin, confirming their exosome purity ()). Using TRPS, we obtained a large increase in numbers of exosomes using the standardised quality controlled commercial kit compared to the UC-DG methodology ()). However, both populations demonstrated the same exosomal size profile of 50–120 nm ()). All subsequent exosome purifications were undertaken using the commercial kit methodology.
Figure 1. Exosomes purified from primary human PTEC cultured under normal conditions using ultracentrifugation/density gradient purification (UC-DG) and commercial kit purification (Kit) demonstrate comparable purity. (a) PTEC exosomes from both purification methodologies express CD9 but not calnexin. Western blot analysis of whole PTEC/exosome lysate (5 µg total protein per sample). (b) Numbers of exosomes purified from equivalent cell culture volumes. One representative of two PTEC donor experiments. (c) Equivalent size distribution of exosomes produced with the two methodologies; analysed with TRPS (qNano, Izon Science Ltd. Christchurch, New Zealand) using a NP100 nanopore at a 45 mm stretch. One representative of two PTEC donor experiments.
Inflammatory and hypoxic markers on PTEC cultured under disease conditions
To ensure our primary human PTEC responded appropriately to our inflammatory and hypoxic culture conditions we monitored their expression of human leucocyte antigen DR (HLA-DR) and programmed death-ligand 1 (PD-L1) by flow cytometry and hypoxia inducible factor 1α (HIF-1α) by Western blotting (WB). As we have previously published [Citation15], PTEC up-regulated both HLA-DR and PD-L1 in response to inflammatory cytokine stimulation, but demonstrated no up-regulation of these surface molecules in response to hypoxia ()). As expected there was a significant up-regulation of HIF-1α within PTEC cultured under hypoxic conditions but no increase of this molecule in PTEC cultured under inflammatory conditions ()).
Figure 2. Primary human PTEC express inflammation markers and HIF-1α under inflammatory (IFN-γ (100 ng/ml) and TNF-α (20 ng/ml)) and hypoxic (1% O2) culture conditions, respectively. (a) Flow cytometry profiles demonstrate PTEC up-regulate HLA-DR and PD-L1 under inflammatory culture conditions (thick line, unfilled) but show no up-regulation of these molecules under hypoxia (thin line, unfilled). Dashed line, unfilled is normal culture conditions and grey filled is isotype control. One representative of two PTEC donor experiments. (b) Western blot analysis of whole PTEC cell lysate (5 µg total protein) demonstrate HIF-1α expression under hypoxic culture conditions but no HIF-1α expression under normal or inflammatory culture conditions. One representative of two PTEC donor experiments.
Exosomes purified from primary human PTEC cultured under normal versus disease conditions
PTEC cultured under inflammatory conditions produced on average 60% more exosomes than those cultured under normal control conditions whilst those cultured under hypoxic conditions produced on average 80% more exosomes than those cultured under normal control conditions ()). There were no significant differences in the size distribution of these 3 exosome populations ()). In line with this quantitative data, we also observed more exosomes from equivalent cell culture volumes under disease conditions by electron microscopy. However, all 3 populations displayed the same exosomal cup-shaped morphology ()). Analysis of these 3 exosome populations by WB for CD9, CD63 and CD81 expression, using equivalent ml of supernatant input, indicated increasing CD9 expression from normal < inflammation < hypoxia, whilst CD63 and CD81 expression increased normal < hypoxia/inflammation ().
Figure 3. Primary human PTEC produce more exosomes under disease culture conditions but with comparable morphology. (a) Exosome numbers produced by equivalent cell culture volumes under normal and disease (inflammation and hypoxia) culture conditions. All exosomes purified using the Kit methodology. Results represent mean ± SEM of six individual PTEC donor experiments. *p < 0.05 by one-way analysis of variance with Bonferroni’s multiple-comparison test. (b) Equivalent size distribution of exosomes derived from primary human PTEC under normal and disease conditions; analysed with TRPS (qNano, Izon Science Ltd. Christchurch, New Zealand) using a NP100 nanopore at a 45 mm stretch. All exosomes purified using the Kit methodology. Results represent mean ± SEM of six individual PTEC donor experiments. (c) Electron microscopy images of exosomes purified from PTEC cultured under normal and disease conditions. Scale bars = 100 nm. All exosomes purified using the Kit methodology.
Figure 4. Primary human PTEC cultured under disease conditions produce greater numbers of exosomes – defined by CD9/CD63/CD81 content. Western blot of whole exosome lysates (5 µg total protein) following purification of exosomes from equivalent cell culture volumes under normal and disease (inflammation and hypoxia) culture conditions. Blots were probed with anti-CD9 (top gel), anti-CD63 (middle gel) and anti-CD81 (bottom gel). All exosomes purified using the Kit methodology.
miRNA analysis of exosomes cultured under normal versus disease conditions
We next examined miRNA content of purified exosomes using NextSeq 500 sequencing. When miRNAs with less than 10 total counts were filtered, and the libraries were normalised using the TMM method, we identified a total of 59 miRNA within exosomes produced by our six donors. Analysis of these miRNA using high-stringency FDR analysis identified five miRNA species that were significantly different between the inflammation versus the normal control culture group, three miRNA species that were significantly different between the hypoxia versus the normal control culture group and three miRNA species that were significantly different between the hypoxia versus the inflammation culture group (). One miRNA species, hsa-miR-7641-2-3p, appeared across all three culture groups with a minus log2 fold change of 2.13 in inflammation vs normal (FDR 4.12 × 10⁻⁹), 3.53 in hypoxia vs normal (FDR 1.67 × 10⁻¹⁵) and 1.40 in hypoxia vs inflammation (FDR 0.045).
Table 1. Significantly differentially expressed exosomal miRNA.
Three of the four miRNA species that were significantly elevated in the inflammation vs the normal control group (hsa-miR-200a, hsa-miR-222 and hsa-miR-204) and one of the two miRNA species that was significantly elevated in the hypoxia vs inflammation culture group (hsa-miR-375) have been previously implicated in one or more studies as players in renal disease (see discussion).
Proteomic analysis of exosomes cultured under normal versus disease conditions
Analysis of the protein content of exosomes across all six donors identified a total of 536 proteins each containing at least two significant peptides (>95% probability with at least one peptide unique to the protein) at a FDR < 0.05. Of these, 212 were found in exosomes derived from all three culture conditions; 31 were shared between exosomes derived from normal and inflammation culture conditions; 62 were shared between exosomes derived from normal and hypoxic culture conditions; and 18 were shared between exosomes derived from inflammation and hypoxic culture conditions. Of the unique proteins, 88 were unique to exosomes produced under normal control culture conditions, 72 to exosomes produced under inflammatory culture conditions and 53 to exosomes produced under hypoxic culture conditions ().
Figure 5. Exosomes purified from human primary PTEC cultured under normal and disease conditions contain both shared and unique proteins. Total numbers of identified proteins (bold) and percentage of total identified proteins (in brackets) for each individual culture condition are presented.
A comparison of exosome protein expression levels across the culture condition groups was performed using SWATH/MS. A spectral library was constructed composed of the spectra used to identify the 536 proteins described above and total exosome protein from each of the different culture conditions were subjected to SWATH analysis; relative expression levels were then calculated using OpenSwath and MSstats. Seven proteins were identified as significantly down-regulated and five as significantly up-regulated between inflammation versus normal; one and four proteins, respectively, between hypoxia versus normal; and one and six proteins, respectively, between hypoxia versus inflammation (). Many of these individual proteins have described roles in pathways involved in renal fibrosis including extracellular matrix deposition (laminin, plectin, fibronectin, tenascin, heparan sulfate) and protein binding/cell junction assembly (plectin, T-complex protein, thrombospondin-1, filamin-A), providing a possible link between extracellular signalling and this pathophysiological process.
Table 2. Significantly differentially expressed exosomal proteins.
To further investigate the function of the proteins that were significantly differentially expressed between the normal and diseased culture conditions we conducted unbiased pathway analyses using the “Disease and Biological Function” clustering function of the IPA program with a stringent p-value cut-off of < 1e-4. Two renal associated pathways were identified: (i) renal and urological diseases, and (ii) renal and urological systems development and function. Additionally, as expected, a number of pathways intimately linked with inflammatory and hypoxic processes were also identified, including (i) inflammatory response, (ii) inflammatory disease, (iii) cellular compromise, (iv) cell to cell signalling, (v) immune cell trafficking, (vi) cell death and survival, (vii) cellular function and maintenance, (viii) cellular compromise and (ix) cell-mediated immune response.
Mapping these same proteins within the “Tox Function” of IPA, which maps pathways upon toxicological phenotypes and clinical pathology end-points, identified numerous renal-associated pathways that are known to occur in CKD, including (i) renal fibrosis, (ii) renal nephritis, (iii) renal inflammation, (iv) renal dysfunction, (v) renal tubular injury, (vi) renal damage and (vii) kidney failure. Two specific examples from the inflammation versus normal culture group are C3, FN1 and THBS1 associating with “Damage of Renal Tubules” (2.13E-6), and C3, TF and THBS1 associating with “Renal Impairment” (4.37E-4).
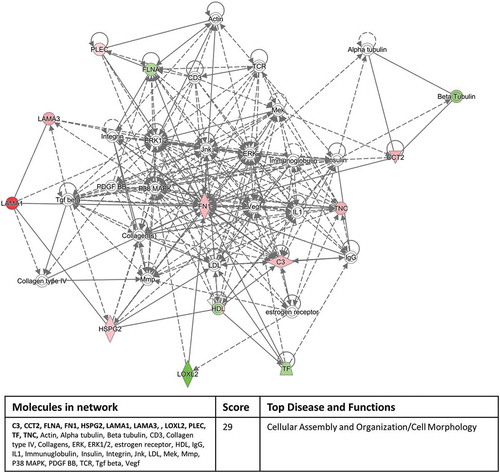
Interrogating the “Networks” function of IPA with our significantly expressed proteins highlighted a cell to cell signalling/inflammatory response pathway involving 11 out of the 12 proteins in the inflammation versus normal culture group () and a cellular assembly and organisation/cell morphology pathway involving 11 out of 17 proteins in the hypoxic culture group versus inflammation/normal culture condition groups (). These network pathway findings confirm the validity of our experimental approach.
Figure 6. Eleven out of the 12 significantly differentially expressed exosomal proteins, derived from the inflammatory culture conditions compared to the normal culture conditions, associate with a cell to cell signalling/inflammatory response pathway identified by the Networks function of IPA. The colour intensity indicates amount of up-regulation within the network. Proteins highlighted in bold within the data table are the 11 significantly differentially expressed exosomal proteins.
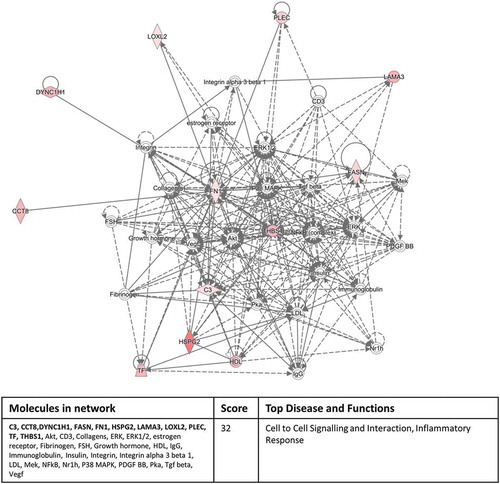
Figure 7. Eleven out of 17 significantly differentially expressed exosomal proteins, derived from the hypoxic culture conditions compared to the inflammation/normal culture condition groups, associate with a cellular assembly and organisation/cell morphology pathway identified by the Networks function of IPA. Red colour indicates up-regulation and green colour indicates down-regulation within the network and colour intensity indicates levels of regulation. Proteins highlighted in bold within the data table are the 11 significantly differentially expressed exosomal proteins.
Discussion
PTEC play a central role in the development of fibrosis, a common end stage result of many renal diseases, irrespective of aetiology. Exosomes, and their cargo of specific bioactive molecules, produced by the kidney, have been implicated in numerous disease pathways. Despite this, until now, no one has characterised the production of exosomes from human primary PTEC under normal or diseased conditions. In our study, we demonstrate for the first time, that purified primary human PTEC produce increased numbers of exosomes under disease conditions and that these exosomes contain both miRNA and protein specific signatures that differ from those derived from PTEC cultured under normal control conditions.
We initially compared the purification methods of UC/DG and a commercially available kit, the Qiagen exoEasy Maxi Kit, to obtain purified exosome preparations. We undertook this comparison because our initial work with exosome purification using UC/DG methodology demonstrated that this procedure was extremely laborious and time consuming and prone to technical problems including breakage of UC tubes and DG dissociation leading to exosome sample loss. The use of the commercial kit held the benefit of a simple, time efficient methodology that was reproducible and quality controlled. Our results clearly demonstrate that exosomes purified with the kit were of equivalent quality to those produced using UC/DG and also resulted in a much greater yield of exosomes, probably due to the large reduction in the number of centrifugation steps the samples were subjected to.
We examined exosome production from the supernatants of six separate PTEC donors cultured under three separate conditions to replicate normal control culture conditions, inflammatory disease culture conditions and hypoxic disease culture conditions. Supporting the findings of others who have reported increased exosome production from breast cancer cell lines [Citation5], mesenchymal stem cells [Citation28] and a mouse renal cell line (MCT) [Citation11] under hypoxic and stressed culture conditions, we also identified an increase of exosome secretion under diseased conditions from primary human PTEC. These increases were confirmed by both particle number defined by TRPS and the relative abundance of CD9, CD63 and CD81 assessed by WB, normalised to equivalent ml of supernatant. Interestingly, despite this finding that PTEC secrete increased numbers of exosomes under disease conditions and the fact that PTEC form a major cell population lining the urinary space, no definitive report has described increased numbers of exosomes in urine from renal disease patients.
Applying high stringency statistical analysis and FDR to our miRNA data, we have identified different miRNA species expressed in exosomes between our normal and disease culture groups. One miRNA species of particular interest is hsa-miR-7641-2-3p. This miRNA was identified as the most significantly down-regulated of all the miRNA species and has been identified as negatively regulating the expression of CXCL1 in human embryonic stem cells [Citation29]. Yoo et al. [Citation29] clearly demonstrated CXCL1 as the target gene for this miRNA and showed that miR-7641 decreased the expression of both CXCL1 mRNA levels and protein levels. There are no other reports of this miRNA-CXCL1 interaction within the scientific literature but CXCL1 is the primary chemokine responsible for neutrophil chemotaxis during early inflammation [Citation30,Citation31]. It is therefore tempting to hypothesise that the significant down-regulation of miR-7641 within inflammatory cultured PTEC exosomes represents a novel pathway to increase CXCL1 expression and subsequent neutrophil influx into the kidney as a first line of defence against the inflammatory response.
Four further miRNA species were identified as being significantly up-regulated in the exosomes of PTEC from inflammatory cultures compared to controls. Of these, three (hsa-miR-200a, hsa-miR-222 and hsa-miR-204) have been recently identified in EVs isolated from non-activated PTEC culture supernatants [Citation32]. Furthermore, these three miRNA have been previously identified with roles within renal disease pathways. In rat cell lines and mouse models miR-200a down-regulates TGF-β2, a central inducer molecule in kidney fibrosis, and other molecules of the fibrotic process including alpha smooth muscle actin, fibronectin and collagen 1 [Citation33]. Elevated levels of this miRNA have been identified in patients with hypertensive nephrosclerosis and the miRNA levels correlated with proteinuria within this disease group [Citation34]. Thus, our findings of increased miR-200a from exosomes derived from inflammatory PTEC could potentially identify a specific in-vivo source for this miRNA. MiR-222 has been implicated in lupus nephritis pathology, with miR-222 in urinary sediment being inversely correlated with serum anti-dsDNA level in patients with active lupus nephritis [Citation35]. MiR-204 was recently identified as one of seven miRNA associated with progressive CKD [Citation36] and it has also been identified as one of three possible urinary miRNA biomarkers for interstitial fibrosis/tubular atrophy (IF/TA) in transplant patients [Citation37]. There are no reports of the fifth miRNA, miR-4419a, in kidney disease.
Of the two remaining miRNA species identified as being significantly different between the exosomes produced from hypoxic versus normal PTEC, miR-3182 has been reported amongst the top 15 significantly up-regulated miRNA in a study of renal cell carcinoma [Citation38]. Again miR-4448 has not been reported in the kidney disease literature.
Of the three miRNA species identified as significantly different between the hypoxia and inflammation cultured PTEC, miR-375 has been implicated in renal pathology [Citation39], where it was identified as one of a subset of cell-fraction miRNA in urine that was associated with rejection of kidney allografts before any histological evidence was detected. MiR-3613 has been reported at significantly decreased expression levels in urinary sediments of IgA nephropathy patients with grade I-II and III disease [Citation40]. This is somewhat at odds with our findings that miR-3613 is elevated in disease PTEC sample exosomes. However, other reports have identified this miRNA as an important down-regulator of the inflammatory response in other organs, where it appears to function via two distinct mechanisms: (i) degrading cytokine RNA and (ii) inhibiting the LPS/IL-1 NF kappa β signalling pathway [Citation41]. Our data would support these findings, extending, for the first time, a role for miR-3613 to an anti-inflammatory response in the kidney.
In line with other proteomic studies of exosomes, we identified large numbers of peptides demonstrating over five hundred different proteins were present within our exosome populations. Of these, the largest grouping (212) were expressed from exosomes across all culture conditions. However, exosomes from all three culture conditions produced proteins that were unique to their specific culture conditions, representing healthy (normal control conditions), early disease (inflammatory disease conditions) and late disease (hypoxic disease conditions). When we used IPA analysis to assign pathways to our proteins that were significantly differentially expressed in our exosomes from different culture conditions, as expected, we identified a range of pathways that were associated with the inflammation/hypoxia process. Importantly however, we also identified a number of renal related pathways using both the “Disease and Biological Function” and “Tox” clustering functions of IPA, providing a linkage between proteins within PTEC exosomes and CKD.
Four of the significantly differentially expressed proteins, complement C3 (C3), heparin sulphate proteoglycan core protein (HSPG2), tenascin (TNC) and galectin-3 binding protein (GALS3BP) were present across two or more culture conditions. C3 was significantly down-regulated in the inflammation culture and up-regulated in the hypoxia cultures compared to normal control culture. We and others have shown that this molecule is produced by PTEC and its expression level changes under perturbed conditions [Citation17]. C3 is a central player in both the classical and alternate complement pathways and is also regarded as an inflammatory mediator. Gerritsma et al. have shown that C3 expression in human PTEC is up-regulated by the inflammatory mediator IL-1α [Citation42] and the breakdown product of C3, C3a increases vascular permeability, recruits neutrophils [Citation43] and induces the respiratory burst in these cells [Citation44]. The increased expression of C3 within exosomes from our hypoxic PTEC may indicate a mechanism by these cells to resolve the hypoxic conditions by increasing vascular permeability and recruiting neutrophils in an effort to degrade extracellular matrix material induced by hypoxia. HSPG2 was significantly increased within exosomes from both inflammatory and hypoxic culture conditions. This molecule plays a major role in both angiogenesis and cell adhesion [Citation45], two processes that require up-regulation to recover from an hypoxic environment, where one sees decreasing oxygenation of the tissues with subsequent cell detachment from basement membranes. TNC is significantly up-regulated within exosomes from hypoxic conditions compared to both normal and inflammation culture-derived exosomes. TNC is an extracellular matrix protein which is closely associated with the formation of stem cell niches [Citation46,Citation47]. It is tempting to speculate that the increased expression of this molecule within exosomes from hypoxic PTEC cultures may be an effort to induce the formation of stem cell niches within the tubulointerstitium, where mesenchymal tubular stem cells may proliferate to replace cellular loss that occurs from hypoxia in vivo. Finally, GALS3BP was also significantly up-regulated in exosomes from hypoxic cultures compared to both normal and inflammation cultures. This molecule also plays a role in cellular adhesion [Citation48] and has been reported as an immune-stimulator/cellular defence protein [Citation49], two biological processes one would expect to be up-regulated within a hypoxic in vivo environment. GALS3BP has previously been identified in urinary exosomes [Citation50] and our findings would identify PTEC as the primary source of these exosomes.
In conclusion, this study investigated, for the first time, the production and molecular content of exosomes derived from primary human PTEC cultured under normal and disease-related conditions. We demonstrate a rapid reproducible methodology for the purification of PTEC-derived exosomes, identified increased numbers of exosomes from disease-state cultures and identified differential expressions levels of both known and unique miRNA and protein species from exosomes derived from different disease-culture conditions. The validity of this unbiased approach is supported by the identification of miRNA and protein pathways with known CKD associations, providing a rationale to further evaluate the known and novel miRNA and protein species within PTEC-derived exosomes as targets for therapeutic intervention.
Acknowledgements
We would like to express our profound thanks to our surgical colleagues and especially our patients for tissue donation.
Disclosure statement
No potential conflict of interest was reported by the authors.
Additional information
Funding
Related Research Data
References
- Heijnen HF, Schiel AE, Fijnheer R, et al. Activated platelets release two types of membrane vesicles: microvesicles by surface shedding and exosomes derived from exocytosis of multivesicular bodies and alpha-granules. Blood. 1999;94(11):1–13.
- Lotvall J, Hill AF, Hochberg F, et al. Minimal experimental requirements for definition of extracellular vesicles and their functions: a position statement from the International society for extracellular vesicles. J Extracell Vesicles. 2014;3:26913.
- Thery C, Duban L, Segura E, et al. Indirect activation of naive CD4+ T cells by dendritic cell-derived exosomes. Nat Immunol. 2002;3(12):1156–1162.
- Hedlund M, Nagaeva O, Kargl D, et al. Thermal- and oxidative stress causes enhanced release of NKG2D ligand-bearing immunosuppressive exosomes in leukemia/lymphoma T and B cells. Plos One. 2011;6(2):e16899.
- King HW, Michael MZ, Gleadle JM. Hypoxic enhancement of exosome release by breast cancer cells. BMC Cancer. 2012;12:421.
- Lin J, Li J, Huang B, et al. Exosomes: novel biomarkers for clinical diagnosis. ScientificWorldJournal. 2015;2015:657086.
- Properzi F, Logozzi M, Exosomes: FS. the future of biomarkers in medicine. Biomark Med. 2013;7(5):769–778.
- Kwon S-H, Liu KD, Mostov KE. Intercellular transfer of GPRC5B via exosomes drives HGF-mediated outward growth. Curr Biol. 2014;24(2):199–204.
- Street JM, Birkhoff W, Menzies RI, et al. Exosomal transmission of functional aquaporin 2 in kidney cortical collecting duct cells. J Physiol. 2011;589(Pt 24):6119–6127.
- Grange C, Collino F, Tapparo M, et al. Oncogenic micro-RNAs and renal cell carcinoma. Front Oncol. 2014;4:49.
- Borges FT, Melo SA, Ozdemir BC, et al. TGF-beta1-containing exosomes from injured epithelial cells activate fibroblasts to initiate tissue regenerative responses and fibrosis. J Am Soc Nephrol. 2013;24(3):385–392.
- Chen HH, Lai PF, Lan YF, et al. Exosomal ATF3 RNA attenuates pro-inflammatory gene MCP-1 transcription in renal ischemia-reperfusion. J Cell Physiol. 2014;229(9):1202–1211.
- Schlondorff DO. Overview of factors contributing to the pathophysiology of progressive renal disease. Kidney Int. 2008;74(7):860–866.
- Sampangi S, Wang X, Beagley KW, et al. Human proximal tubule epithelial cells modulate autologous B-cell function. Nephrol Dial Transplant. 2015;30(10):1674–1683.
- Wilkinson R, Wang X, Roper KE, et al. Activated human renal tubular cells inhibit autologous immune responses. Nephrol Dial Transplant. 2011;26(5):1483–1492.
- Kassianos AJ, Wang X, Sampangi S, et al. Fractalkine-CX3CR1-dependent recruitment and retention of human CD1c+ myeloid dendritic cells by in vitro-activated proximal tubular epithelial cells. Kidney Int. 2015;87(6):1153–1163.
- Wilkinson R, Wang X, Kassianos AJ, et al. Laser capture microdissection and multiplex-tandem PCR analysis of proximal tubular epithelial cell signaling in human kidney disease. Plos One. 2014;9(1):e87345.
- Peng L, Yang J, Ning C, et al. Rhein inhibits integrin-linked kinase expression and regulates matrix metalloproteinase-9/tissue inhibitor of metalloproteinase-1 ratio in high glucose-induced epithelial-mesenchymal transition of renal tubular cell. Biol Pharm Bull. 2012;35(10):1676–1685.
- Glynne PA, Evans TJ. Inflammatory cytokines induce apoptotic and necrotic cell shedding from human proximal tubular epithelial cell monolayers. Kidney Int. 1999;55(6):2573–2597.
- Kassianos AJ, Sampangi S, Wang X, et al. Human proximal tubule epithelial cells modulate autologous dendritic cell function. Nephrol Dial Transplant. 2013;28(2):303–312.
- Lobb RJ, Becker M, Wen SW, et al. Optimized exosome isolation protocol for cell culture supernatant and human plasma. J Extracell Vesicles. 2015;4:27031.
- Potriquet J, Laohaviroj M, Bethony J, et al. A modified FASP protocol for high-throughput preparation of protein samples for mass spectrometry. Biorxiv. 2016; Available from: http://biorxiv.org/content/early/2016/10/31/084533
- Guo T, Kouvonen P, Koh CC, et al. Rapid mass spectrometric conversion of tissue biopsy samples into permanent quantitative digital proteome maps. Nat Med. 2015;21(4):407–413.
- Ponce D, Brinkman DL, Potriquet J, et al. Venom proteome of the pacific sea nettle, chrysaora fuscescens (Cnidaria: scyphozoa). Toxins. 2016;8(4):102.
- Schubert OT, Gillet LC, Collins BC, et al. Building high-quality assay libraries for targeted analysis of SWATH MS data. Nat Protoc. 2015;10(3):426–441.
- Blattmann P, Heusel M, Aebersold R. SWATH2stats: an R/bioconductor package to process and convert quantitative SWATH-MS proteomics data for downstream analysis tools. Plos One. 2016;11(4):e0153160.
- Choi M, Chang CY, Clough T, et al. MSstats: an R package for statistical analysis of quantitative mass spectrometry-based proteomic experiments. Bioinformatics. 2014;30(17):2524–2526.
- Salomon C, Ryan J, Sobrevia L, et al. Exosomal signaling during hypoxia mediates microvascular endothelial cell migration and vasculogenesis. Plos One. 2013;8(7):e68451.
- Yoo JK, Jung HY, Kim C-H, et al. miR-7641 modulates the expression of CXCL1 during endothelial differentiation derived from human embryonic stem cells. Arch Pharm Res. 2013;36(3):353–358.
- De Filippo K, Dudeck A, Hasenberg M, et al. Mast cell and macrophage chemokines CXCL1/CXCL2 control the early stage of neutrophil recruitment during tissue inflammation. Blood. 2013;121(24):4930–4937.
- Hung CC, Chang CT, Chen KH, et al. Upregulation of chemokine CXCL1/KC by leptospiral membrane lipoprotein preparation in renal tubule epithelial cells. Kidney Int. 2006;69(10):1814–1822.
- Chiabotto G, Bruno S, Collino F, et al. Mesenchymal stromal cells epithelial transition induced by renal tubular cells-derived extracellular vesicles. Plos One. 2016;11(7):e0159163.
- Wang B, Koh P, Winbanks C, et al. miR-200a Prevents renal fibrogenesis through repression of TGF-beta2 expression. Diabetes. 2011;60(1):280–287.
- Wang G, Kwan BC, Lai FM, et al. Intrarenal expression of miRNAs in patients with hypertensive nephrosclerosis. Am J Hypertens. 2010;23(1):78–84.
- Guan J, Wang G, Tam LS, et al. Urinary sediment ICAM-1 level in lupus nephritis. Lupus. 2012;21(11):1190–1195.
- Rudnicki M, Perco P, D Haene B, et al. Renal microRNA- and RNA-profiles in progressive chronic kidney disease. Eur J Clin Invest. 2016;46(3):213–226.
- Scian MJ, Maluf DG, David KG, et al. MicroRNA profiles in allograft tissues and paired urines associate with chronic allograft dysfunction with IF/TA. Am J Transplant. 2011;11(10):2110–2122.
- Muller S, Nowak K. Exploring the miRNA-mRNA regulatory network in clear cell renal cell carcinomas by next-generation sequencing expression profiles. Biomed Res Int. 2014;2014:948408.
- Maluf DG, Dumur CI, Suh JL, et al. The urine microRNA profile may help monitor post-transplant renal graft function. Kidney Int. 2014;85(2):439–449.
- Wang N, Bu R, Duan Z, et al. Profiling and initial validation of urinary microRNAs as biomarkers in IgA nephropathy. PeerJ. 2015;3:e990.
- Jura J, Skalniak L, Koj A. Monocyte chemotactic protein-1-induced protein-1 (MCPIP1) is a novel multifunctional modulator of inflammatory reactions. Biochim Biophys Acta. 2012;1823(10):1905–1913.
- Gerritsma JS, Gerritsen AF, Van Kooten C, et al. Interleukin-1 alpha enhances the biosynthesis of complement C3 and factor B by human kidney proximal tubular epithelial cells in vitro. Mol Immunol. 1996;33(10):847–854.
- Pagano MB, Zhou HF, Ennis TL, et al. Complement-dependent neutrophil recruitment is critical for the development of elastase-induced abdominal aortic aneurysm. Circulation. 2009;119(13):1805–1813.
- Elsner J, Oppermann M, Czech W, et al. C3a activates the respiratory burst in human polymorphonuclear neutrophilic leukocytes via pertussis toxin-sensitive G-proteins. Blood. 1994;83(11):3324–3331.
- Mongiat M, Fu J, Oldershaw R, et al. Perlecan protein core interacts with extracellular matrix protein 1 (ECM1), a glycoprotein involved in bone formation and angiogenesis. J Biol Chem. 2003;278(19):17491–17499.
- Oskarsson T, Acharyya S, Zhang XH, et al. Breast cancer cells produce tenascin C as a metastatic niche component to colonize the lungs. Nat Med. 2011;17(7):867–874.
- Von Holst A. Tenascin C in stem cell niches: redundant, permissive or instructive? Cells Tissues Organs. 2008;188(1–2):170–177.
- Sasaki T, Brakebusch C, Engel J, et al. Mac-2 binding protein is a cell-adhesive protein of the extracellular matrix which self-assembles into ring-like structures and binds beta1 integrins, collagens and fibronectin. EMBO J. 1998;17(6):1606–1613.
- Ullrich A, Sures I, D’Egidio M, et al. The secreted tumor-associated antigen 90K is a potent immune stimulator. J Biol Chem. 1994;269(28):18401–18407.
- Gonzales PA, Pisitkun T, Hoffert JD, et al. Large-scale proteomics and phosphoproteomics of urinary exosomes. J Am Soc Nephrol. 2009;20(2):363–379.