
ABSTRACT
We examined the extracellular vesicle (EV) and RNA composition of pooled normal cerebrospinal fluid (CSF) samples and CSF from five major neurological disorders: Alzheimer’s disease (AD), Parkinson’s disease (PD), low-grade glioma (LGG), glioblastoma multiforme (GBM), and subarachnoid haemorrhage (SAH), representing neurodegenerative disease, cancer, and severe acute brain injury. We evaluated: (I) size and quantity of EVs by nanoparticle tracking analysis (NTA) and vesicle flow cytometry (VFC), (II) RNA yield and purity using four RNA isolation kits, (III) replication of RNA yields within and between laboratories, and (IV) composition of total and EV RNAs by reverse transcription–quantitative polymerase chain reaction (RT-qPCR) and RNA sequencing (RNASeq). The CSF contained ~106 EVs/μL by NTA and VFC. Brain tumour and SAH CSF contained more EVs and RNA relative to normal, AD, and PD. RT-qPCR and RNASeq identified disease-related populations of microRNAs and messenger RNAs (mRNAs) relative to normal CSF, in both total and EV fractions. This work presents relevant measures selected to inform the design of subsequent replicative CSF studies. The range of neurological diseases highlights variations in total and EV RNA content due to disease or collection site, revealing critical considerations guiding the selection of appropriate approaches and controls for CSF studies.
Responsible Editor Andrew Hill, University of Melbourne, Australia
Introduction
The diagnoses of neurological diseases are routinely based upon clinical examination, imaging (magnetic resonance imaging, computed tomography, and positron emission tomography), and cerebrospinal fluid (CSF) analyses. CSF, produced in the choroid plexus in the ventricular system of the brain, is in intimate contact with brain tissue [Citation1]. The fluid, an ultrafiltrate of plasma, normally contains less than 1% of plasma proteins [Citation2]. Changes in CSF protein and glucose concentration, inflammatory cells, carcinoma or clonal B cells, immunoglobulins, or infection agents provide important diagnostic information for clinicians [Citation3]. The CSF is easily sampled by needle aspiration from the lumbar subarachnoid space [Citation4], and from the ventricles or the arachnoid before surgical craniotomy. Patients with neurological disorders are found to have changes in the concentration and molecular weight of CSF proteins. Thus, the CSF is an attractive site for identifying diagnostic markers of neurological diseases derived from extracellular vesicles (EVs; exosomes and microvesicles) [Citation5]. EVs are secreted by all human cell types and tissues, are present in CSF [Citation6], and can serve as novel biomarkers for neurological disorders [Citation7]. As part of the National Institutes of Health (NIH) Director’s Office Common Fund Initiative for the Extracellular RNA Communication Consortium (ERCC), we evaluate the CSF for diagnostic biomarkers of neurological diseases including neurodegeneration, glial tumours, and brain injury [Citation8]. To facilitate studies of the sensitivity and specificity of these CSF assays, we established a collaboration to provide CSF-based EV and extracellular RNA (exRNA) evaluations across these neurological diseases. This collaboration included the evaluation of interinstitutional protocols, the provision of data on EV size and concentration, and analysis of CSF-derived total and EV RNAs. We evaluated CSF pools representing: (i) neurologically normal individuals (Control), (ii) non-familial Alzheimer’s disease (AD), (iii) idiopathic typical Parkinson’s disease (PD), (iv) low-grade supratentorial glioma (LGG), (v) glioblastoma multiforme (GBM), and (vi) subarachnoid haemorrhage (SAH). These studies were designed to provide a broad understanding of CSF RNA characteristics that can be used to guide the design of subsequent replicative CSF studies. Assuring uniform results from RNA isolation is a fundamental assumption when comparing results across institutions; consequently, we focused on site-to-site variation in RNA preparation methods. We performed pilot RNA assessments using RNA sequencing (RNASeq) and reverse transcription–quantitiative polymerase chain reaction (RT-qPCR) to illustrate the benefits and challenges of each system for quantitative measurement of CSF RNA. These results provide a template to inform RNA-based study design under the relevant design constraints, including CSF availability, cost limitations, and the ultimate goals of collaborative studies.
CSF study design
We created CSF pools from neurologically normal individuals, and those with neurological disorders, at three parent institutes: the University of California, San Diego (UCSD), Oregon Health & Science University (OHSU), and the Translational Genomics Research Institute (TGen). We first quantified and characterised pooled CSF EVs by nanoparticle tracking analysis (NTA) and vesicle flow cytometry (VFC). We then shared the pooled CSF samples among the three sites, and in parallel evaluated the total and EV RNA (yields and quality) emerging from four preparative kits (study design shown in ). Next, we analysed the total and EV RNA from two of the four preparative kits for messenger RNA (mRNA) and microRNA (miRNA) expression by RT-qPCR and RNASeq (study design shown in ).
Figure 1. Cerebrospinal fluid (CSF) study design. Pools of CSF were generated for six diagnostic groups (five to 12 subjects/group): neurologically normal subjects (Control) from University of California, San Diego (UCSD); neurodegenerative disease [Alzheimer’s disease (AD) and Parkinson’s disease (PD)] from Oregon Health & Science University (OHSU); central nervous system tumour [low-grade glioma (LGG) and glioblastoma multiforme (GBM)] from UCSD; and subarachnoid haemorrhage (SAH) from the Translational Genomics Research Institute (TGen). Aliquots from each pool of CSF were first used to assess the extracellular vesicles (EVs) in pooled CSF samples for each diagnostic group. The remaining aliquots were distributed across three institutes, where RNA isolation was performed in parallel using commercial RNA isolation kits: two designed to isolate total RNA and two designed to isolate EV RNA. The yield and quality of each RNA sample were assessed using RiboGreen and small RNA Bioanalyzer assays performed at each institute, and the outcomes from the studies were compared. QC, quality control.
![Figure 1. Cerebrospinal fluid (CSF) study design. Pools of CSF were generated for six diagnostic groups (five to 12 subjects/group): neurologically normal subjects (Control) from University of California, San Diego (UCSD); neurodegenerative disease [Alzheimer’s disease (AD) and Parkinson’s disease (PD)] from Oregon Health & Science University (OHSU); central nervous system tumour [low-grade glioma (LGG) and glioblastoma multiforme (GBM)] from UCSD; and subarachnoid haemorrhage (SAH) from the Translational Genomics Research Institute (TGen). Aliquots from each pool of CSF were first used to assess the extracellular vesicles (EVs) in pooled CSF samples for each diagnostic group. The remaining aliquots were distributed across three institutes, where RNA isolation was performed in parallel using commercial RNA isolation kits: two designed to isolate total RNA and two designed to isolate EV RNA. The yield and quality of each RNA sample were assessed using RiboGreen and small RNA Bioanalyzer assays performed at each institute, and the outcomes from the studies were compared. QC, quality control.](/cms/asset/55bf0328-c6da-4f23-8520-ab861db33ac5/zjev_a_1317577_f0001_b.gif)
Figure 2. Determination of size distribution of cerebrospinal fluid (CSF) extracellular vesicles (EVs) in CSF samples. CSF from each diagnostic group was analysed using (a) nanoparticle tracking analysis and (b) vesicle flow cytometry. Histograms represent the average of two measurements normalised to the maximum frequency to illustrate the particle size distribution across the six diagnostic groups. AD, Alzheimer’s disease; PD, Parkinson’s disease; LGG, low-grade glioma; GBM, glioblastoma multiforme; SAH, subarachnoid haemorrhage.

Figure 3. Determination of nanoparticle (NP) and extracellular vesicle (EV) concentrations in cerebrospinal fluid (CSF). Nanoparticle tracking analysis (NTA) and vesicle flow cytometry (VFC) were used to determine nanoparticle and EV concentrations for the CSF samples. By NTA, the nanoparticle concentration for the Control was 4.3 × 10⁶/μL, and the diagnostic groups ranged from 4.8 × 10⁶/μL to 42 × 106/μL (grey bars). By VFC, the EV concentration for the Control was 2.2 × 10⁶/μL, and the diagnostic groups ranged from 2.2 × 10⁶/μL to 14.0 × 10⁶/μL (black bars). AD, Alzheimer’s disease; PD, Parkinson’s disease; LGG, low-grade glioma; GBM, glioblastoma multiforme; SAH, subarachnoid haemorrhage.
Figure 4. Replication of RNA yields across sites, normalised to a shared RNA reference sample. RNA yields from 1.0 mL of cerebrospinal fluid (CSF) from each diagnostic group were assessed by RiboGreen assay. The results show the intralaboratory (n = 2 samples) and interlaboratory (n = 3 sites) replication of RNA yields ((a,b)), normalised to a reference RNA sample ((c)) prepared from plasma at the Translational Genomics Research Institute (TGen), and shared with Oregon Health & Science University (OHSU) and University of California, San Diego (UCSD). The linear scale coefficient of variation across all measurements is listed below each diagnostic group. AD, Alzheimer’s disease; PD, Parkinson’s disease; LGG, low-grade glioma; GBM, glioblastoma multiforme; SAH, subarachnoid haemorrhage; ExRNA, extracellular RNA.
Figure 5. Replication of RNA size and purity across sites. RNA from each isolation kit was profiled by small RNA Bioanalyzer assays. Profiles show the intralaboratory (n = 2 samples) and interlaboratory (n = 3 sites) of RNA purity for each diagnostic group. y-axis = fluorescent units; x-axis = time (s) (circle = ~ 4 nt, triangle = ~ 150 nt). AD, Alzheimer’s disease; PD, Parkinson’s disease; LGG, low-grade glioma; GBM, glioblastoma multiforme; SAH, subarachnoid haemorrhage; ExRNA, extracellular RNA.
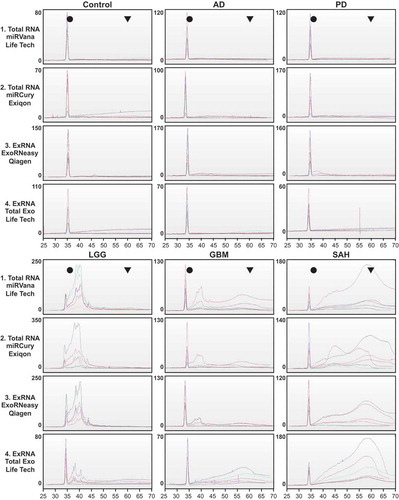
Figure 6. Study design for RNA expression studies. We used total RNA from the mirVana kit and extracellular vesicle (EV) RNA from the exoRNeasy kit for expression analysis. RNA expression was profiled using Qiagen microRNA (miRNA) reverse transcription–quantitative polymerase chain reaction (RT-qPCR) arrays performed at Oregon Health & Science University (OHSU), Qiagen mRNA RT-qPCR arrays performed at University of California, San Diego (UCSD), and small and long RNA sequencing (RNASeq) performed at the Translational Genomics Research Institute (TGen). All RNA present in a 1.0 mL cerebrospinal fluid (CSF) sample was used for the miRNA and messenger RNA (mRNA) RT-qPCR arrays. For the RNASeq assays, two 1.0 mL samples per kit were pooled, then 3.67 ng RNA was used for the small RNASeq and 2.0 ng was used for long RNASeq. See supplemental figures for detailed methods for each expression assay. Dx, diagnostic; AD, Alzheimer’s disease; PD, Parkinson’s disease; LGG, low-grade glioma; GBM, glioblastoma multiforme; SAH, subarachnoid haemorrhage.
Materials and methods
We used consistent methods to examine identical pools of banked CSF at multiple sites. The disease-specific pools of CSF were obtained from different sites and processed under different conditions. Based on our findings in this study, we have prepared a recommended approach for processing and evaluation of CSF at multiple sites.
Enrolment and CSF collection
shows the sample collection and processing for CSF at each site. Consent for CSF collection was approved by the institutional review board (IRB) at each institution (Control, UCSD IRB 080012; AD, OHSU IRB 6845; PD, OHSU IRB 8122; LGG, UCSD IRB 120345X; GBM, UCSD IRB 120345X; SAH, TGen IRB 20110058). All subjects provided informed consent before CSF collection and studies. For terminology, we refer to the collection of the Control, AD, and PD CSF samples as “lumbar” and the cisternal/vesicular CSF samples as “central”.
Table 1. Cerebrospinal fluid sample collection and processing at each institute.
OHSU
The OHSU Oregon Alzheimer’s Disease Center (OADC) and the OHSU Parkinson’s Center use a standardised CSF collection protocol for AD and PD [Citation9]. CSF was collected in the morning after an overnight fast. CSF was aspirated by lumbar puncture using a Sprotte 24 g needle, and transferred to sterile polypropylene tubes in 0.5 mL aliquots. Deidentified, numbered tubes were frozen on dry ice and stored at −80ºC. The CSF pools included equal volumes of samples from 12 AD patients (six male, six female, average age 69.8 years) and 11 PD patients (six male, five female, average age 65.6 years).
UCSD
The Shiley–Marcos Alzheimer’s Disease Research Center (ADRC) provided CSF from neurologically normal donors (Controls). The donors, free of familial or neurological disease, were non-familial friends of patients. Lumbar CSF was collected and processed as per the OHSU AD and PD methods, using protocols established by national Alzheimer’s disease research centres. CSF was collected in the morning after an overnight fast. The CSF pool included samples from seven Control donors (three male, four female, average age 66.9 years).
For CSF collection from brain tumour patients, cisternal samples were obtained before tumour manipulation. CSF was collected in the morning after an overnight fast. The CSF was drawn into a 10 mL syringe, centrifuged at 1500 × g for 15 min at 4°C, and then pooled and stored at −80°C. The CSF pools included virtually equal volumes from 10 LGG patients donated to UCSD by the Phoenix Children’s Hospital (seven male, three female, average age 6.8 years) and five GBM patients (four male, one female, average age 54.8 years).
TGEN
SAH patients provided CSF following admission to the Intensive Care Unit of the Barrow Neurological Institute. Following customary placement of a tube into the ventricles of the brain (ventriculostomy), CSF was collected in the morning after an overnight fast, centrifuged at 470 × g for 10 min at 4°C, then aliquoted and stored at −80ºC. The SAH pools included five patients (two male, three female, average age 54.0 years).
Virtual Biorepository
An encrypted Virtual Biorepository of all anonymised study data was created and is maintained at Baylor University [Citation10]. This repository, of the NIH Directors Common Fund-supported ERCC, included an IRB template, consent form, and Universal Materials Transfer Agreement. We encoded demographic and treatment data, preparative variables (time of CSF collection, centrifugation, preparative kits, aliquots, storage), EV quantification and characterisation by NTA and VFC, RNA yields and characterisation by RiboGreen® and small RNA Bioanalyzer analysis, and mRNA and miRNA expression studies by RT-qPCR and RNASeq. The template for the repository is available upon request, as is collaborative access to specimens.
CSF vesicle characterisation
EVs from all CSF pools were characterised using two approaches, and all experiments were performed at one site: the Scintillon Institute. All CSF samples were centrifuged at 2500 × g for 10 min before dilution and measurement by NTA and VFC.
NTA
Aliquots of all CSF pools were diluted 25-fold in 0.1 μM filtered phosphate-buffered saline (PBS) for NTA. EV concentration (synonymous with “nanoparticle” concentration) and size measures were obtained using NTA [Citation11,Citation12] with a NanoSight LM-20 (Malvern Instruments, Worcestershire, UK), and a 532 nm laser and high-sensitivity sCMOS camera. Diluted CSF (>50–200 particles per field) was measured (five fields measured for 30 s each). Concentrations and diameters of EVs were calculated from averages of histograms. Polystyrene beads (Malvern) and liposomes [Citation13] served as reference standards.
VFC
EV concentrations and sizes were measured by VFC [Citation13,Citation14]. CSF (~1 × 10⁹ nanoparticles/mL as determined by NTA) was stained with 100 nM di-8-ANEPPS (di-8) for 30 min at room temperature. Samples were then diluted 800-fold in PBS and measured [Citation13] by detection of di-8-ANEPPS fluorescence. Liposomes (also measured by NTA) were used as size and quantity calibrators.
Total and EV RNA isolation
Commercial isolation kits
The three institutions purchased commercial RNA isolation kits, all with identical lot numbers. For total RNA isolation, we used (i) the Life Technologies mirVana™ PARIS™ RNA and Native Protein Purification Kit (catalogue no. AMA1556, lot no. 1408099) and (ii) the Exiqon miRCURY™ RNA Isolation Kit (catalogue no. 300112, lot no. 1405/001). For EV RNA isolation, we used (iii) the Qiagen exoRNeasy Serum/Plasma Kit (catalogue no. 77064, lot no. 148037533) and (iv) the Life Technologies Total Exosome RNA and Protein Isolation Kit (catalogue no. 4478545, lot no. 1303009). RNA isolations were done in duplicate (n = 2) using 1.0 mL CSF, performed according to the manufacturer’s protocol. For the mirVana total RNA isolations, we used two aqueous extractions to optimise the yield of RNA [Citation15].
Total and EV RNA quantification and characterisation
RiboGreen analysis
We used the Quant-iT™ RiboGreen® RNA Assay Kit (Life Technologies, catalogue no. R11490) to determine the RNA yields from each 1.0 mL of CSF (n = 2 duplicates/kit). We utilised the low-range (0–50 pg/µL) protocol adopted for 200 µL samples in a 96-well format (Costar). The 96-well plates assays were read on a plate reader at each site. OHSU used a Molecular Devices SpectraMax M2 Plate Reader with SoftMax Pro 6 Analysis Software; TGen used a BioTek Cytation 3 Imaging Reader BioTek with Gen5 Software v. 2.06 BioTek; and UCSD used a Tecan Infinite 200 Plate Reader with Tecan i-control software v. 1.10.4.0.
Small RNA Bioanalyzer analysis
We used the Agilent Small RNA Assay (Agilent Technologies 2100 Bioanalyzer with 2100 Expert Software) to determine the yield and purity of RNA. Duplicate (n = 2) RNA yields from 1.0 mL of CSF were averaged.
RNA expression analysis
We analysed miRNA and mRNA expression using commercial RT-qPCR arrays, and small and long RNASeq. Given limited resources for these experiments, we focused expression assays on total RNA isolated using the mirVana kit, and on EV RNA isolated using the exoRNeasy protocol, as both protocols are based on an organic extraction. OHSU performed the Qiagen miRNA array experiments, UCSD performed the Qiagen mRNA array experiments, and TGen performed the next generation whole transcriptome and small RNASeq experiments. Each expression platform was used to analyse all six CSF pools. The RNA isolated from each replicate (n = 2) of 1.0 mL CSF from the mirVana kit (total RNA), or from the exoRNeasy kit (EV RNA), was combined for the subsequent RNA expression experiments.
miRNA expression (OHSU) (Supplemental Figure 1)
The miRNA expression from 1.0 mL of each CSF pool was analysed by RT-qPCR using the Qiagen Human miRNome miScript® miRNA PCR Arrays, V16.0 (catalogue no. MIHS-3216Z). This platform includes probes for 1066 abundantly expressed miRNAs in the human genome as in miRBase release 16 (www.miRBase.org). The miRNA PCR arrays were performed as per the manufacturer’s protocol, with amplification reactions completed using a QuantStudio 12 K Flex Real-Time PCR System (Life Technologies). Data were interpreted using a threshold cycle ≤31 detection cut-off value.
mRNA expression (UCSD) (Supplemental Figure 2)
The mRNA expression from 1.0 mL of each CSF pool was analysed by RT-qPCR using a custom Qiagen RT2 PCR array in 96-well format. This platform included 90 mRNA genes and three internal controls [human genomic DNA control (HGDC), reverse transcription control (RTC), and positive PCR control (PPC)]. The full list of mRNAs within the array is available upon request from UCSD. PCR amplification reactions were done using a Bio-Rad CFX96 Touch™ Real-Time PCR Detection System. Data were interpreted with a threshold cycle ≤35 detection cut-off value.
RNASeq (TGen) (Supplemental Figure 3)
RNASeq was used to analyse the miRNA and mRNA expression in each CSF pool. Small RNASeq was performed using 3.67 ng of RNA in the Illumina TruSeq small RNA sample library preparation kit (RS-200-0012), as previously reported [Citation7], with reagents used in a half-reaction. Samples were assigned one of 48 possible indices, and went through 16 PCR cycles. Indexed samples were run on a gel and purified away from the adaptor band. The samples were then pooled and placed on a single-read Illumina V3 flowcell (GD-401-3001). Long RNASeq was performed using 2 ng of RNA in a NuGen Ovation RNASeq FFPE system (7150) for cDNA synthesis and RNA amplification. The samples were quantified using the Qubit dsDNA HS Assay Kit (Q3285; ThermoFisher), then moved forward to a KAPA Hyper Library Preparation Kit (KK8502; KAPA Biosystems). Each sample was assigned one of eight possible indices after one cycle of PCR and final libraries were quantified using a KAPA SYBR FAST Universal qPCR Kit (KK4824; KAPA Biosystems). Pooled and paired libraries were placed on a Paired End Illumina V3 flowcell (FPE-401-3001; Illumina). A threshold value of ≥5 counts per RNA was used as the cut-off value for inclusion in the small (miRNA) and long (mRNA) RNASeq data analysis.
Results
Size distribution and concentration of EVs in pooled CSF samples
The NTA and VFC results are the average of two runs on each pooled sample at a single site. NTA revealed that the EVs in CSF pools had diameters ranging from <50 nm to >300 nm, with a mean diameter of 118 nm and a peak (mode) diameter of ~100 nm ()). Among all Control and diagnostic groups of CSF, there were no differences in the EV diameters. The VFC analysis revealed that the EV sizes in CSF showed unimodal nanoparticle size distributions with diameters ranging from <75 nm to >400 nm, with a mean diameter of 192 nm and a peak (mode) diameter of ~130 nm ()). There was no obvious difference in VFC particle size between the Control and the diagnostic groups.
NTA revealed that nanoparticle/EV concentration ranges in the CSF varied from 4.3 × 10⁶/μL (Control) to 4.2 × 10⁷/μL (LGG) (, grey bars). The neurodegenerative diseases (AD, PD) had lower concentrations of nanoparticles/EVs than did the CSF from brain tumours and SAH. VFC analysis revealed that the nanoparticle/EV concentration for the Control was 2.2 × 10⁶/μL, and for the diagnostic groups the concentrations ranged from 2.2 × 10⁶/μL to 14.0 × 10⁷/μL (, black bars). By VFC, this nanoparticle/EV overexpression for tumours and SAH was not apparent. Both NTA and VFC methods reported similar size distributions; but NTA, which detects all scattering particles, reported nanoparticle/EV concentrations higher than those reported by VFC [Citation16], which detects only membrane-bound particles.
Total and EV RNA yields and purity
We used RiboGreen assays, which can quantify a range of 1–200 ng RNA, to determine the RNA yield from n = 2 samples isolated by each of the four preparative kits (). Within each CSF pool, the total RNA kits provided higher quantities of RNA than the EV RNA kits, as expected. This is most apparent for the GBM samples, where total RNA (mirVana and miRCURY) was in the range of 1.5–3.2 ng/μL ((a) compared to 0.00–2.22 ng/μL ((b)) for EV RNA (exoRNeasy and Total Exosome). Also apparent were yield differences for CSF acquired from lumbar samples (Control, AD, PD) relative to the central samples (LGG, GBM, SAH). The CSF total RNA yield in the lumbar samples (Control, AD, PD) was 0.00–0.82 ng/μL, and 1.39–22.01 ng/μL in the central samples (LGG, GBM, SAH), a finding that reveals potential differences that may occur due to CSF collection site, or due to differences in disease/injury. Despite working from identical starting samples and isolation kits, we found large intersite variation in our RNA yield. While absolute yields were quite different from site to site, relative yields were similar.
Table 2. Quantification of total and extracellular vesicle (EV) RNA by the RiboGreen assay.
To determine whether the large variation in RNA yield was due to the use of different plate readers or to the RNA isolation technique, each site assayed a shared RNA reference standard isolated from plasma at TGen, and provided to OHSU and UCSD ((c)). The RNA yields were then normalised to the shared RNA reference standard (). We found that the coefficient of variation (CoV) across sites for each sample and isolation kit decreased in the normalised measures in all cases, suggesting that the variation in yield across sites was due in large part to the variation in plate readers. Therefore, we used the normalised units for further comparisons: yields were of the same order of magnitude for both total RNA preparative kits (Figure 4.1, 4.2) and for both EV RNA preparative kits (Figure 4.3, 4.4). Comparing the CoV by CSF sample for the total RNA kits (mirVana PARIS: 0.37 ± 0.08 variation; miRCURY: 0.57 ± 0.25 variation) confirmed that there was less variation in yield across institutes with the mirVana PARIS kit than with the miRCURY kit (p = 0.07 by t test). Comparing the CoV by CSF sample for the exosomal RNA kits (exoRNeasy: 0.72 ± 0.35 variation; Total Exosome: 0.76 ± 0.31) showed no difference in the yield variance across these two kits (p = 0.69 by t test).
The small RNA Bioanalyzer studies showed similar sizes of RNA across all CSF samples, regardless of the preparative kit used (). Consistent with the RiboGreen data, there were lower quantities of RNA present in Control, AD, and PD CSF, relative to the LGG, GBM, and SAH CSF. In the Bioanalyzer traces shown in , size in nucleotides (nt) is represented by retention time (s), and each sample includes a spike-in control at 35 s. The Bioanalyzer profiles for the lumbar samples isolated from 1.0 mL CSF illustrate that the quantity of small RNA in these samples is near or below the detection threshold for this technology. The higher quantities in the central samples were readily measured at all institutes, and show similar size distributions. It is unclear at this time whether or not the differences between the quantities of RNA in these samples are due to the site of sample acquisition (lumbar vs central) or to the disease condition (neurodegeneration vs glial tumours and acute brain injury). It is possible that the brain tumour and SAH CSF samples have higher concentrations of total and EV RNA due to the nature of these diseases, which will be addressed in future studies.
RNA expression studies
We analysed the miRNA and mRNA expression in total (mirVana) and EV (exoRNeasy) RNA isolated from all CSF samples by RT-qPCR and RNASeq (). The RNA expression studies included: a 1066 miRNA array, a custom 93 mRNA array, small RNASeq, and long RNASeq, as described in Materials and Methods. Each institute has uploaded their respective RT-qPCR and RNASeq data into the NIH Common Fund, Data Management Resource and Repository (DMRR) for the exRNA Atlas, available at http://exrna-atlas.org/exat/datasets.
Unique miRNA and mRNA expression in CSF for each diagnostic group
We examined the distribution of RNA in the total (mirVana) and EV (exoRNeasy) fraction for each diagnostic group. ) shows the results of the miRNA RT-qPCR arrays with 1066 miRNA probes, all total or EV RNA from 1.0 mL CSF per diagnostic groups. Relative to Control, all disease groups contain more miRNA species in the EV fraction (), black bars). In all groups, the largest fraction of miRNAs is detected in common between the total and the EV fractions (), grey bars). The number of miRNAs that were detected in only the total CSF fraction was larger in Control than any of the diagnostic groups (), white bars). ) shows the results of the miRNA small RNASeq assays run with 3.67 ng RNA isolated from 2.0 mL CSF, and nucleotide cDNA for input for each diagnostic group. In these assays, relative to Control, the LGG and GBM appear to have fewer miRNA species that are unique to the EV fraction (), black bars). In all groups, the largest fraction of miRNAs is detected in common between the total and EV fractions (), grey bars). However, the LGG CSF has the largest raw number of miRNAs, most of which are unique to the total fraction (), white bars). ) shows the results of the mRNA RT-qPCR custom array with 90 mRNA probes using all total or EV RNA from 1.0 mL CSF per diagnostic group. The LGG group appears to have less mRNA unique to EVs, relative to the other groups (), black bars). In LGG, GBM, and SAH, the largest fraction of mRNAs is detected in common between the total and EV fractions (), grey bars), yet all have mRNA unique to the total fraction (), white bars). ) shows the results of the mRNA long RNASeq assays run with 2.0 ng RNA isolated from 2.0 mL CSF, and nucleotide cDNA for input for each diagnostic group. In these assays, all groups appear to have fewer mRNA species in the EV fraction (), black bars), and the majority of mRNAs is detected in the total fraction (), white bars). Given the pooled nature of the CSF samples, we did not perform analysis of the data sets to determine those miRNAs or mRNAs detected by both RT-qPCR and RNASeq.
Figure 7. Distribution of RNA in total vs extracellular vesicle (EV) fraction for each diagnostic group. The bar charts show the distribution of total vs EV RNA detected by (a) microRNA (miRNA) reverse transcription–quantitative polymerase chain reaction (RT-qPCR) array, (b) small RNA sequencing (RNASeq), (c) messenger RNA (mRNA) RT-qPCR array, and (d) long RNASeq. In each bar chart, the black bar indicates the number of RNA detected only in the EV fraction, the grey bar indicates the number of RNA detected in common in the EV and the total fractions, and the white bar indicates the number of RNA detected only in the total fraction of the cerebrospinal fluid (CSF). AD, Alzheimer’s disease; PD, Parkinson’s disease; LGG, low-grade glioma; GBM, glioblastoma multiforme; SAH, subarachnoid haemorrhage.
Changes in the miRNA and mRNA population in the total RNA fraction in the disease groups, relative to Control
shows the distribution of RNAs from the mirVana isolation kit that is detected in total CSF for each neurological disorder, relative to the Control CSF. In these charts, the sum of the black plus the grey bars represents the RNA detected in Control CSF; thus, the sum of the Control RNAs is constant within each individual assay. For example, in ) there are 692 miRNAs detected in Control (black plus grey bars), and thus the white bars indicate those miRNAs unique to the disease. These data show that relatively few of the miRNAs detected are unique to the disease CSF (), white bars). In ) there are 76 miRNAs detected in Control (black plus grey bars) and, in contrast to the miRNA RT-qPCR data, a relatively large population of miRNAs is unique to each disease (), white bars). ) has 23 mRNAs detected in Control (black plus grey bars), and overall there is a relatively large population of mRNAs unique to each disease (), white bars). In ) there are 8981 mRNAs detected in Control (black plus grey bars), and between 1000 and 4000 mRNAs unique to the disease (), white bars). Given the pooled nature of the CSF samples, we did not correlate RT-qPCR and RNASeq data to cross-confirm unique transcripts, nor did we record the number of RNASeq hits per transcript.
Figure 8. Distribution of RNA detected in total cerebrospinal fluid (CSF) for each neurological disorder, relative to Controls. The distribution of RNA detected in total CSF by (a) microRNA(miRNA) reverse transcription–quantitative polymerase chain reaction (RT-qPCR) array, (b) small RNA sequencing (RNASeq), (c) messenger RNA (mRNA) RT-qPCR array, and (d) long RNASeq. In each bar chart, the black bar indicates the number of RNA uniquely detected in the extracellular vesicle (EV) fraction of the Control sample [not in the diagnostic (Dx) sample], the white bar indicates the number of RNA unique to the Dx group (not in Control), and the grey bar indicates the number of RNA detected in common in both the Control and Dx group sample. Within a measurement type, the total number of RNA detected in the Control group is constant (black plus grey bars), but the unique and common portions change according to the Dx group. AD, Alzheimer’s disease; PD, Parkinson’s disease; LGG, low-grade glioma; GBM, glioblastoma multiforme; SAH, subarachnoid haemorrhage.
![Figure 8. Distribution of RNA detected in total cerebrospinal fluid (CSF) for each neurological disorder, relative to Controls. The distribution of RNA detected in total CSF by (a) microRNA(miRNA) reverse transcription–quantitative polymerase chain reaction (RT-qPCR) array, (b) small RNA sequencing (RNASeq), (c) messenger RNA (mRNA) RT-qPCR array, and (d) long RNASeq. In each bar chart, the black bar indicates the number of RNA uniquely detected in the extracellular vesicle (EV) fraction of the Control sample [not in the diagnostic (Dx) sample], the white bar indicates the number of RNA unique to the Dx group (not in Control), and the grey bar indicates the number of RNA detected in common in both the Control and Dx group sample. Within a measurement type, the total number of RNA detected in the Control group is constant (black plus grey bars), but the unique and common portions change according to the Dx group. AD, Alzheimer’s disease; PD, Parkinson’s disease; LGG, low-grade glioma; GBM, glioblastoma multiforme; SAH, subarachnoid haemorrhage.](/cms/asset/b8430c97-0674-4a96-820e-9a8469bac646/zjev_a_1317577_f0008_b.gif)
Changes in the miRNA and mRNA population in the EV RNA fraction in the disease groups, relative to Control
shows the distribution of EV RNAs isolated using the exoRNeasy kit that are detected in each neurological disorder, relative to the Control CSF. In these charts, the sum of the black and the grey bars represents the RNA detected in Control CSF, and thus the sum of the Control RNAs is constant within each individual assay. For example, in ) there are 415 miRNAs detected in Control (black plus grey bars), and thus the white bars indicate those miRNAs unique to the disease. These data show that AD and PD are remarkably similar to each other, and have relatively few miRNAs unique to the disease CSF (), white bars). In contrast, the LGG, GBM, and SAH have 200–400 miRNA unique to the disease (), white bars). ) shows that there are 89 miRNAs detected in Control (black plus grey bars), with the SAH CSF containing the largest population of unique miRNAs (), white bars). ) has 15 mRNAs detected in Control (black plus grey bars), and overall there is a relatively large population of mRNAs unique to LGG, GBM, and SAH (), white bars). In ) there are 2245 mRNAs detected in Control (black plus grey bars) and, surprisingly, there are fewer mRNAs unique to the LGG CSF relative to the other diseases (), white bars). Given the pooled nature of the CSF samples, we did not correlate RT-qPCR and RNASeq data to cross-confirm unique transcripts, nor did we record the number of RNASeq hits per transcript.
Figure 9. Distribution of RNA detected in the cerebrospinal fluid (CSF) extracellular vesicle (EV) fraction for each neurological disorder, relative to Control. The bar plots show the distribution of RNA detected in the EV fraction by (a) microRNA (miRNA) reverse transcription–quantitative polymerase chain reaction (RT-qPCR) array, (b) small RNA sequencing (RNASeq), (c) messenger RNA (mRNA) RT-qPCR array, and (d) long RNASeq, relative to Control EV RNA. In each bar chart, the black bar indicates the number of RNA uniquely detected in the EV fraction of the Control sample [not in the diagnostic (Dx) sample], the white bar indicates the number of RNA unique to the Dx group (not in Control), and the grey bar indicates the number of RNA detected in common in both the Control and Dx group sample. Within a measurement type, the total number of RNA detected in the Control group is constant (black plus grey bars), but the unique and common portions change according to the Dx group. AD, Alzheimer’s disease; PD, Parkinson’s disease; LGG, low-grade glioma; GBM, glioblastoma multiforme; SAH, subarachnoid haemorrhage.
![Figure 9. Distribution of RNA detected in the cerebrospinal fluid (CSF) extracellular vesicle (EV) fraction for each neurological disorder, relative to Control. The bar plots show the distribution of RNA detected in the EV fraction by (a) microRNA (miRNA) reverse transcription–quantitative polymerase chain reaction (RT-qPCR) array, (b) small RNA sequencing (RNASeq), (c) messenger RNA (mRNA) RT-qPCR array, and (d) long RNASeq, relative to Control EV RNA. In each bar chart, the black bar indicates the number of RNA uniquely detected in the EV fraction of the Control sample [not in the diagnostic (Dx) sample], the white bar indicates the number of RNA unique to the Dx group (not in Control), and the grey bar indicates the number of RNA detected in common in both the Control and Dx group sample. Within a measurement type, the total number of RNA detected in the Control group is constant (black plus grey bars), but the unique and common portions change according to the Dx group. AD, Alzheimer’s disease; PD, Parkinson’s disease; LGG, low-grade glioma; GBM, glioblastoma multiforme; SAH, subarachnoid haemorrhage.](/cms/asset/5b397953-635f-4e39-bda7-5779c4f5e0cf/zjev_a_1317577_f0009_b.gif)
Discussion
Our EV and exRNA expression profile studies on pooled CSF from six diagnostic groups (Control and five neurological diseases) have led to the following general findings. (i) EVs from disease CSF are more numerous than those from Control CSF (), a difference most apparent for CSF from brain tumours, SAH, and PD. (ii) Irrespective of the commercial RNA isolation kit used, higher yields of total and EV RNA appear in the CSF of patients with brain tumours and SAH (, , ). (iii) Unique miRNA and mRNAs, not seen in Controls, are detected by RT-qPCR and RNASeq in the total () and EV fraction () of CSF. There are higher numbers of unique RNAs detected in patients with brain tumours and SAH (, ), relative to patients with neurodegenerative disease (AD, PD). These results may reflect reduced populations of neuronal and glial cells in neurodegeneration or increased cancer-related RNAs, or RNAs released in response to acute traumatic injury. Alternatively, disease-related pathophysiology may involve a fundamental alteration in EV-mediated signalling, or in transport of RNA across the blood–brain barrier. These hypotheses can be addressed by studies to correlate changes in EV signalling with alterations in brain morphometry or disease biomarkers (e.g. CSF Aβ-Tau, EGFrwt, EGFRvIII). (iv) The high levels of RNA in SAH CSF have stimulated interest in studies that can distinguish brain-derived EVs from blood-derived EVs and their respective RNAs, and provide insight into those EVs uniquely associated with SAH vasospasm. (v) We found that potential RNA biomarker candidates are indeed identified uniquely in the EV fraction, as distinct from the total (EV plus non-EV) fraction, of CSF. Thus, interrogating each separate fraction of CSF may enhance efforts to identify disease-relevant RNA candidate biomarkers.
CSF vesicle size and concentration
Several methods are in place to characterise the physical properties of EVs, and to quantify the number of particles present in a sample [Citation17]. We measured EVs using both NTA and VFC. NTA depends on the refractive index of particles ranging in size from ~30 to –1000 nm [Citation18], and does not distinguish between EVs and equal-sized nanoparticles [Citation19]. Although NTA has been shown to accurately count polystyrene beads and delivery nanoparticles, the technique has been found to be biased against small particle counts in the presence of larger particles, and may also count particle fragments and protein aggregates. VFC detects EVs whose lipid membranes are labelled with a fluorescent lipid probe (voltage-sensing dye di-8-ANEPPS), which allows the measurement of individual vesicles and their surface proteins. The vesicle fluorescence, proportionate to vesicle surface area, is the basis for calculations of EV number and size. Thus, VFC provides analysis of single EVs [Citation13] with EV-by-EV enumeration and sizing, and does distinguish between EVs and equal-sized nanoparticles. A major advantage of VFC is its capacity to speciate EVs by their surface proteins marked by fluorescent ligands, which we did not use here but are now using for studies on disease CSF.
The NTA and VFC provided similar estimates of CSF particle size distributions, with both methods reporting a single population of particles ranging from ~50 nm to 300 nm with a mode of ~100 nm, similar to distributions observed previously in CSF [Citation14] and in plasma [Citation13,Citation20]. However, the NTA and VFC provided different estimates of EV concentration, which is expected as NTA detects all particles that scatter light, which can include protein aggregates and other nanoparticulates in addition to EVs, while VFC detects only membrane-bound particles. The NTA nanoparticle concentration estimates are higher than VFC total EV concentrations (except for PD), consistent with VFC’s emphasis on detecting lipid membrane particles and lack of emphasis on disrupted or coalescent particles that are detected by NTA. These differences were most apparent for brain tumours (LGG, GBM) and SAH. In general, plasma EVs measured by NTA or VFC range from 1.0 to 10.0 × 10⁵ particles/μL, a full log higher than those in CSF. Studies are underway to identify EV species that are present in plasma but not in CSF, and to provide calibrators for VFC analytics. It is noteworthy that NTA and VFC offer the opportunity to interrogate EVs in CSF and other biofluids without extensive preparative steps.
There are limitations to our study. Pooled CSF samples are restrictive in the information they provide as combined samples smooth EV size and quantitative data and subsets of patients can no longer be identified. For example, hypothetically, the high EV concentrations for PD detected by VFC () may reflect a single patient with an inflammatory molecular variant of idiopathic PD. These issues will be addressed in CSF studies of individual subjects with neurological diseases, where CSF EV counts may distinguish patients with defective blood–brain barriers or those with early-stage neurodegenerative disease as distinct from late stages with increased neuronal loss. Furthermore, the CSF from AD and PD patients was not centrifuged before freezing and thus may contain EVs of cellular origin. This was not likely to be the case, however, as reflected by the lower levels of total RNA in these specimens, the reduced complexity of small RNAs by Bioanalyzer, and the EV/nanoparticle profiles revealed by NTA and VFC.
Replication of RNA yield and purity across sites
Each laboratory at OHSU, UCSD, and TGen used consistent methods, and identical lots of kits and reagents from each vendor, to isolate and analyse RNA across the three sites (). The RiboGreen assays show increased levels of RNAs in the LGG, GBM, and SAH samples, relative to the Control, AD, and PD CSF samples. The small RNA Bioanalyzer assays had virtually identical profiles between laboratories and within each diagnostic group. Our studies highlighted the necessity to share an identical RNA reference standard between each site for normalisation of interlaboratory results in RNA yields due to site-specific equipment, such as the RiboGreen plate readers. For example, RNA isolated from Control CSF using the mirVana kit ranged from 0.13 ng/μL to 0.75 ng/μL at the three sites (). However, RNA yields of the reference standard provided to each laboratory ranged from 0.23 ng/μL to 0.73 ng/μL in the three different plate readers (). Thus, the RNA standard was used to normalise RNA yields from each CSF sample, and reduce the CoV for the RNA yields. This normalisation was used to compare RNA yields within and between laboratories for all commercial RNA isolation kits and all diagnostic groups (). Clearly, there are variations in RNA yields between the CSF samples. At study design we were not aware of the profound differences in EV number and size reflecting the source (lumbar versus central) of CSF. At this time, however, it is not possible to distinguish whether this results from differences due to the neurological diseases, or from the CSF sample collection site: central CSF samples collected by craniotomy (LGG, GBM) or ventriculostomy (SAH) had ~10-fold higher levels of RNA relative to CSF samples collected by lumbar puncture (Control, AD, and PD), including concentration readings that were below the level of detection. Studies on CSF samples collected from both central and lumbar sites from the same patient should be able to address this issue directly. Our studies assumed that commercial RNA isolation kits for total and EV RNAs would provide major distinctions in RNA yields and expression. Total RNA includes free RNA, EV (exosomes, microvesicles) RNA, and RNAs in high-density lipoproteins [Citation21,Citation22] or bound outside vesicles to Argonaute2 (AGO2) protein [Citation23]. Yet admittedly, we have little manufacturer data regarding the science that underlies kit utilities for CSF EVs, and the kits may not optimise RNA yields from each of these different sources, or a priori isolate relevant RNAs in a biofluid. For example, when two aqueous phase extractions from a mirVana kit are performed [Citation24], there are common and unique miRNAs in each extraction (T.A. Lusardi et al., unpublished observation). This argues strongly for optimising biomarker yields by comparison of both total and EV isolation kits, and for the consideration of further extractions to isolate all exRNAs. Our data do not support the simple utility of one commercial RNA kit for CSF biomarker identification, nor do they provide a definitive comparison of the effects of CSF sample processing (centrifugation before freezing) or specific isolation kits, as they impact the validation of specific biomarkers [Citation25–Citation31]. Overall, these data indicate that there is very little RNA in CSF samples, and that great care and consideration of downstream assays should play a role in how the samples are isolated. Perhaps even increasing the volume, where samples are less limited, would provide a more robust signal.
RNA expression studies
Our RNA expression studies confirmed that RT-qPCR and RNASeq can identify disease-related “unique” miRNAs and mRNAs in total (mirVana) () and EV (exoRNeasy) () RNA that are not detected in the Control CSF. They also reveal the presence of RNA in samples with quantities below the level of detection by RiboGreen, as for the OHSU Control and AD EV RNAs ((b)). Of the 93 mRNAs analysed on the custom Qiagen array, between 25 and 66 potential candidate biomarkers were identified in either the total ()) or EV ()) fraction of CSF. Furthermore, of 1066 miRNA probes available on the Qiagen arrays, between 200 and 400 were unique to LGG, GBM, or SAH in the EV fraction, while fewer unique miRNAs for AD and PD were identified in the EV fraction ()).
We also found more miRNAs detected in the RT-qPCR arrays ()), relative to those in the small RNASeq assays ()). This finding probably results from the fact that sequencing space is also given to other small RNA fragments that are not miRNA. For example, in the sequencing space, we found that a large number of reads go to transfer RNA (tRNA) fragments rather than miRNA, thus changing the detection threshold for miRNA (data not shown). Meanwhile, the arrays are targeted specifically for miRNA. Another factor that may contribute to the difference in the number of miRNAs detected may result from the fact that all total RNA from 1.0 mL of CSF was used for the RT-qPCR assays, while the small RNASeq used 3.67 ng of RNA for each assay. Thus, RNASeq input was more dilute than that for the RT-qPCR.
We also note that, as expected, the expression assays detected RNA species in EV fractions, which are not detected in total fractions. Thus, our RNA extraction methods are likely to be biased to recover some RNAs at a level insufficient to be detected by RiboGreen or Bioanalyzer assays. This issue will be addressed in subsequent studies of unpooled samples, paying careful attention to correlates of RT-qPCR and RNASeq. RNASeq requires no a priori knowledge of sample contents and quantifies the number of diverse RNAs present in a sample; thus, abundant RNAs are likely to be represented at the expense of less abundant RNAs.
Interlaboratory tvariations in RNA recovery, and variations in equipment, etc., which obligated the use of reference RNA standards for normalisation, are likely to have influenced the identification of miRNAs and mRNAs present in the diagnostic groups. These replication issues will drive the development and distribution of EV reference standards with well-characterised miRNA and mRNA surface proteins and cargoes. These small variances across sites may be more pronounced for low-RNA samples such as CSF. The low-abundance RNA is at the low point of detection for each of the measurement assays, also contributing slightly to the variability. We chose to use pooled CSF (n = 1) for this protocol refinement study, and recognise the limitations of our conclusions using single pooled samples collected at single sites. Given that we analysed pooled CSF samples, we did not correlate the RT-qPCR and RNASeq data from these studies. Pooled CSF samples are restrictive in the information they provide as combined samples smooth the data and subsets of patients can no longer be identified. For example, individual GBM patient EV biomarkers might distinguish between the four molecular subtypes of this disease; a distinction lost in the data from these CSF pooled samples. However, these studies did show that the pooled AD and PD CSF samples have a loss of miRNAs ()), consistent with our finding that the signature of AD is decreased miRNA expression in CSF relative to Controls [Citation32]. Thus, the CSF pools were important in allowing us to have replicates that could be investigated across kits and sites. Yet additional experiments are needed to confirm unique miRNAs and mRNAs for individual samples from each neurological disease, and to compare RT-qPCR candidate miRNA and mRNA biomarkers to those identified by small and long RNASeq. However, for biomarker studies, any RNA marker (within a vesicle or a protein complex) is likely to be informative, regardless of its source.
Recommended approach for multisite biofluid studies and collaborative studies
We examined EVs and RNA in identical pools of banked CSF samples across three institutes. The pools of CSF for each diagnostic group were obtained from different sites and thus processed under different conditions. However, we used a consistent protocol and identical lots of commercial reagents and kits to perform the RNA isolation and analysis at each site. We then carried out site-specific assays to analyse RNA expression in each diagnostic group: miRNA RT-qPCR was performed at OHSU, mRNA RT-qPCR was performed at UCSD, and small and long RNASeq was performed at TGen. Based on our outcomes and experiences from these studies, we provide a recommended approach for consideration in collaborative, multi-site studies to evaluate CSF samples.
Stringent standard operating procedures (SOPs) to provide quality control of sample collection, processing, and storage of the CSF. We recognise the limitation of these studies based on variables within the CSF collection site (lumbar vs craniotomy or ventriculostomy), the extent of blood contamination in some CSF, and processing of the CSF samples before storage. Collaborative studies should consider the effect of CSF collection site on RNA yield: lumbar CSF clearly yields lower amounts of RNA than CSF obtained centrally (craniotomy or ventriculostomy). The central samples also contained higher amounts of blood in the CSF, which contributed to differences in CSF EV and RNA profiles between diagnostic groups. Thus, we recommend that all prospective studies include centrifugation of the CSF samples before storage to eliminate potential contamination by cellular debris that may also affect RNA yield and expression profiles. In addition, any information relevant to CSF content (fasting, morning vs afternoon collection, etc.) should be included in the clinical data. Factors that can be controlled in the CSF collection should also be established, such as those in place at AD centres that allow for comparison of samples between sites.
Standardised RNA isolation kits and preparative methods for intra–interlaboratory replicates. We recommend that identical commercial reagents and kits, including identical lot numbers, be used to perform the RNA isolation and analysis at each site. The four RNA isolation kits we used for total and EV RNA isolation showed no clear winner; however, an SOP for the protocols should be followed at each site to minimise variability in outcomes. In addition, for large numbers of clinical samples, all of the expression assays necessary for a study should be from the same lot number in order to minimise variations in outcomes due to changes in manufacturing.
We used the identical protocol for analysis of RNA yield and purity at each site (RiboGreen, Bioanalyzer). However, we found that the site-specific plate readers led to differences in RNA yield by the RiboGreen assay. Thus, we prepared and shared an identical RNA reference standard that was measured on each site-specific plate reader and then used to normalise the RNA yield, which lowered the CoV between sites. We also recommend identical nomenclature for naming of samples at each site, to allow faithful compilation and analysis of the multiple data sets generated by each site.
Identical downstream analytic platforms for consistency of expression studies. We used RT-qPCR and RNASeq to evaluate the consistency of outcomes between these platforms using the identical CSF samples. As we expected, each platform returned distinct expression profiles. For example, the miRNA RT-qPCR identified more miRNAs than did the small RNASeq. The targeted approach of the RT-qPCR allows more miRNAs to be captured and detected. While sequencing the small RNAs allows the assessment of more small RNA species, not all of them are miRNA, and abundant RNA fragments, such as tRNA, take up the sample space. Thus, the choice of RNA expression platform will be driven by the goals for the multisite collaborative studies. For RT-qPCR, we recommend a minimum of 1.0 mL CSF (Supplemental and ), and a minimum 1.0 mL CSF for long and short RNASeq (Supplemental ).
Stringent data collection and management for all information regarding the studies. This includes subjects’ age, gender, disease, and other deidentified clinical information, the catalogue kit names and numbers, lot numbers of all reagents, and dates for receipt of reagents to allow for tracking of outcomes and rapid identification of any changes in manufacturers’ products that influence the study outcomes. From a “process” standpoint, we found utility in pilot studies that inform power analyses and uncover protocol details that bias downstream expression studies and specific plans for study iterations. Thus, SOPs should be generated based on pilot studies (with shared reference standards included in the experiments), and used for all of the study protocols. Detailed notes should be recorded for each experiment, including the technical staff, spin cycles, rotors and g-force, ambient temperature, heparin and molecular profiling, and any deviations from the kit protocol.
Sharing of information in an open, common repository that can be accessed by other laboratories. For example, we have uploaded our respective RT-qPCR and RNASeq data into the NIH Common Fund, DMRR for the exRNA Atlas, available at http://exrna-atlas.org/exat/datasets.
We present complex studies on CSF pools from well-defined neurological diseases. By publishing these data we encourage collaborations including: (i) requests for normalised EV and RNA studies against which to calibrate disease-specific CSF biomarker studies; and (ii) requests from translational scientists with interests in specific diseases of the nervous system. For these, we are willing to identify CSF miRNAs and mRNAs detected by RT-qPCR from total and EV CSF fractions.
Supplementary_figures.zip
Download Zip (414.9 KB)Disclosure statement
No potential conflict of interest was reported by the authors.
supplemental data
The supplemental material for this article can be accessed here.
Additional information
Funding
Related Research Data
References
- Kaur C, Rathnasamy G, Ling EA. The choroid plexus in healthy and diseased brain. J Neuropathol Exp Neurol. 2016;75(3):1–18.
- Felgenhauer K. Protein size and cerebrospinal fluid composition. Klinische Wochenschrift. 1974;52(24):1158–1164.
- Deisenhammer F, Bartos A, Egg R, et al. Guidelines on routine cerebrospinal fluid analysis. Report from an EFNS task force. Eur J Neurol. 2006;13(9):913–922.
- Peskind ER, Riekse R, Quinn JF, et al. Safety and acceptability of the research lumbar puncture. Alzheimer Dis Assoc Disord. 2005;19(4):220–225.
- Coleman BM, Hill AF. Extracellular vesicles–their role in the packaging and spread of misfolded proteins associated with neurodegenerative diseases. Semin Dev Biol. 2015;40:89–96.
- Hirshman BR, Kras RT, Akers JC, et al. Extracellular vesicles in molecular diagnostics: an overview with a focus on CNS diseases. Adv Clin Chem. 2016;76:37–53.
- Colombo E, Borgiani B, Verderio C, et al. Microvesicles: novel biomarkers for neurological disorders. Front Physiol. 2012;3:63.
- Quinn JF, Patel T, Wong D, et al. Extracellular RNAs: development as biomarkers of human disease. J Extracell Vesicles. 2015;4:27495.
- Shi M, Bradner J, Hancock AM, et al. Cerebrospinal fluid biomarkers for Parkinson disease diagnosis and progression. Ann Neurol. 2011;69(3):570–580.
- Subramanian SL, Kitchen RR, Alexander R, et al. Integration of extracellular RNA profiling data using metadata, biomedical ontologies and linked data technologies. J Extracell Vesicles. 2015;4:27497.
- van der Pol E, Coumans FA, Grootemaat AE, et al. Particle size distribution of exosomes and microvesicles determined by transmission electron microscopy, flow cytometry, nanoparticle tracking analysis, and resistive pulse sensing. J Thromb Haemost. 2014;12(7):1182–1192.
- van der Pol E, Hoekstra AG, Sturk A, et al. Optical and non-optical methods for detection and characterization of microparticles and exosomes. J Thromb Haemost. 2010;8(12):2596–2607.
- Stoner SA, Duggan E, Condello D, et al. High sensitivity flow cytometry of membrane vesicles. Cytometry A. 2016;89(2):196–206.
- Akers JC, Ramakrishnan V, Nolan JP, et al. Comparative analysis of technologies for quantifying extracellular vesicles (EVs) in clinical cerebrospinal fluids (CSF). Plos One. 2016;11(2):e0149866.
- Burgos KL, Javaherian A, Bomprezzi R, et al. Identification of extracellular miRNA in human cerebrospinal fluid by next-generation sequencing. RNA. 2013;19(5):712–722.
- Erdbrugger U, Lannigan J. Analytical challenges of extracellular vesicle detection: a comparison of different techniques. Cytometry A. 2016;89(2):123–134.
- Rupert DL, Claudio V, Lasser C, et al. Methods for the physical characterization and quantification of extracellular vesicles in biological samples. Biochimica et Biophysica Acta. 2017;1861(1 Pt A):3164–3179.
- Filipe V, Hawe A, Jiskoot W. Critical evaluation of Nanoparticle Tracking Analysis (NTA) by NanoSight for the measurement of nanoparticles and protein aggregates. Pharm Res. 2010;27(5):796–810.
- Gardiner C, Ferreira YJ, Dragovic RA, et al. Extracellular vesicle sizing and enumeration by nanoparticle tracking analysis. J Extracell Vesicles. 2013;2(1): DOI:10.3402/jev.v2i0.19671.
- Mork M, Pedersen S, Botha J, et al. Preanalytical, analytical, and biological variation of blood plasma submicron particle levels measured with nanoparticle tracking analysis and tunable resistive pulse sensing. Scand J Clin Lab Invest. 2016;76(5):349–360.
- Tabet F, Vickers KC, Cuesta Torres LF, et al. HDL-transferred microRNA-223 regulates ICAM-1 expression in endothelial cells. Nat Commun. 2014;5:3292.
- Vickers KC, Palmisano BT, Shoucri BM, et al. MicroRNAs are transported in plasma and delivered to recipient cells by high-density lipoproteins. Nat Cell Biol. 2011;13(4):423–433.
- Arroyo JD, Chevillet JR, Kroh EM, et al. Argonaute2 complexes carry a population of circulating microRNAs independent of vesicles in human plasma. Proc Natl Acad Sci USA. 2011;108(12):5003–5008.
- Burgos K, Malenica I, Metpally R, et al. Profiles of extracellular miRNA in cerebrospinal fluid and serum from patients with Alzheimer’s and Parkinson’s diseases correlate with disease status and features of pathology. PLoS One. 2014;9(5):e94839.
- Sunkara V, Woo HK, Cho YK. Emerging techniques in the isolation and characterization of extracellular vesicles and their roles in cancer diagnostics and prognostics. Analyst. 2016;141(2):371–381.
- Szatanek R, Baran J, Siedlar M, et al. Isolation of extracellular vesicles: determining the correct approach (Review). Int J Mol Med. 2015;36(1):11–17.
- van der Meel R, Krawczyk-Durka M, van Solinge WW, et al. Toward routine detection of extracellular vesicles in clinical samples. Int J Lab Hematol. 2014;36(3):244–253.
- Van Giau V, An SS. Emergence of exosomal miRNAs as a diagnostic biomarker for Alzheimer’s disease. J Neurol Sci. 2016;360:141–152.
- Xu R, Greening DW, Zhu HJ, et al. Extracellular vesicle isolation and characterization: toward clinical application. J Clin Investig. 2016;126(4):1152–1162.
- Witwer KW, Buzas EI, Bemis LT, et al. Standardization of sample collection, isolation and analysis methods in extracellular vesicle research. J Extracell Vesicles. 2013;2(1): DOI:10.3402/jev.v2i0.20360.
- Janas AM, Sapon K, Janas T, et al. Exosomes and other extracellular vesicles in neural cells and neurodegenerative diseases. Biochimica et Biophysica Acta. 2016;1858(6):1139–1151.
- Lusardi TA, Phillips JI, Wiedrick JT, et al. MicroRNAs in human cerebrospinal fluid as biomarkers for Alzheimer’s disease. J Alzheimers Dis. 2017;55(3):1223–1233.