
ABSTRACT
Prokaryotes release membrane vesicles (MVs) with direct roles in disease pathogenesis. MVs are heterogeneous when isolated from bacterial cultures so Density Gradient Centrifugation (DGC) is valuable for separation of MV subgroups from contaminating material. Here we report the technical variability and natural biological heterogeneity seen between DGC preparations of MVs for Mycobacterium smegmatis and Escherichia coli and compare these DGC data with size exclusion chromatography (SEC) columns. Crude preparations of MVs, isolated from cultures by ultrafiltration and ultracentrifugation were separated by DGC with fractions manually collected as guided by visible bands. Yields of protein, RNA and endotoxin, protein banding and particle counts were analysed in these. DGC and SEC methods enabled separation of molecularly distinct MV populations from crude MVs. DGC banding profiles were unique for each of the two species of bacteria tested and further altered by changing culture conditions, for example with iron supplementation. SEC is time efficient, reproducible and cost effective method that may also allow partial LPS removal from Gram-negative bacterial MVs. In summary, both DGC and SEC are suitable for the separation of mixed populations of MVs and we advise trials of both, coupled with complete molecular and single vesicle characterisation prior to downstream experimentation.
Responsible Editor Aled Clayton UNITED KINGDOM
Introduction
Membrane vesicles (MVs) are released by Gram-positive and -negative bacteria, mycobacteria and Archaea [Citation1]. The MVs released by Gram-negative bacteria are frequently termed outer membrane vesicles (OMVs), although based on the known heterogeneity of bacterial vesicles and the multiple mechanisms of their production this may not be a fully appropriate name [Citation2–Citation4]. MVs and their cargos play a role in many biological processes, including biofilm formation [Citation5,Citation6] and the responses to environmental stress [Citation7]. In the case of tissue infection, pathogenic bacteria are thought to use MVs to deliver toxins [Citation8–Citation10], to act as immune decoys [Citation11,Citation12], and for bacteriophage and antibiotic defusal [Citation13].
The population of MVs released from bacteria is highly heterogeneous in size, structure and molecular content [Citation14], much like that seen for the extracellular vesicles found in human biofluid samples, which include exosomes, microparticles, and apoptotic bodies are present [Citation15–Citation17]. The release of bacterial MVs is predominantly by “blebbing” from their external cellular membranes as bacteria do not have the machinery to release an equivalent to the intracellular-derived eukaryotic exosomes. Analyses of the molecular content of bacterial MVs does however support the hypothesis that selective packaging mechanisms are at play. Reports to date on the functions and molecular contents of bacterial MVs have predominantly utilised a heterogeneous population in their studies. However, for the study of bacterial MVs in specific pathological settings, it will become increasingly important to standardise protocols for isolation of subpopulations of “pure” MVs in order to better understand their individual biology. To date, the common protocols and methods available have been well reviewed by Klimentová and Stulik [Citation18], but the methods themselves have not been experimentally compared in detail.
Density gradient centrifugation (DGC) is a standard method to purify MVs away from contaminating protein aggregates and cellular structures such as flagellae [Citation19]. However, in the literature the use of DGC with bacterial MVs is not standardised and ‘minimal experimental requirements’ have not been established. This is in contrast to those released by the International Society for Extracellular Vesicles (ISEV) in 2014 for definition of eukaryotic extracellular vesicles [Citation20] where molecular and single vesicle characterisation by microscopy or particle tracking analysis are recommended as minimal requirements to claim their presence in samples.
In the prokaryote literature it is as common for researchers to use “crude” MVs [Citation2,Citation21–Citation23], simply isolated by sequential ultrafiltration and ultracentrifugation, as it is for them to further clean these crude preparations by DGC [Citation9,Citation24,Citation25]. Contaminating artefacts including flagellae and protein aggregates are known to co-pellet with the MVs when using ultracentrifugation [Citation19]. Further purification is most often used in studies that directly characterise the molecular contents of MVs. DGC has been employed for example in the recent publications that reported the association of RNA with bacterial MVs [Citation26–Citation29]. We propose that since the bacterial MV field is maturing rapidly, there should also be a requirement for an MV purification step when researchers are studying their functions in in vitro or in vivo infection scenarios. After over a decade of use DGC is used as a common method for purification of MVs. Simple separation by size exclusion chromatography (SEC) is another method that has been successful [Citation30,Citation31]. SEC is undergoing resurgence in eukaryotic extracellular vesicle research [Citation32–Citation35], in part due to its ease and speed of use. The short protocol time for the SEC method compared to DGC has advantages for any unstable cargo isolations in MVs. However the utility of each method for different bacterial species has not been investigated.
In this study we reveal the heterogeneity of MV populations from different bacterial species and the impact of the growth conditions on this diversity. We first report on the relative utility of two different isolation methods and present technical recommendations for researchers studying bacterial MV biology. Specifically, we investigated the use of DGC for MV purification on members of two different bacterial families, Gram-negative bacteria represented by Escherichia coli and acid-fast bacteria represented by Mycobacterium smegmatis. We have studied the visible differences in DGC fractionation banding between species. We show the effect of technical variability on this banding and also investigate possible contributors to biological heterogeneity by examining changes in the molecular profile within individual fractions when growth conditions for E. coli strains are varied. For comparison, we have also evaluated a second isolation method by using commercially available SEC columns (qEV, Izon Science Ltd, New Zealand) for the separation of bacterial MVs.
Our findings suggest that both DGC and SEC are suitable methods for subfractionation of heterogeneous populations of MVs from various strains of bacteria. However, our findings highlight the complexity of these MV populations, both within and between species, and support a requirement for providing careful characterisation information in future published studies on prokaryotic MVs.
Methods
Bacterial strains and growth conditions
Stationary phase cultures of E. coli and the slower growing M. smegmatis used for crude MV preparations were standardised for starting inoculum, growth period and incubation condition to minimise between-culture variation.
Uropathogenic E. coli (UPEC) strain 536 (O6:K15:H31) [Citation36] and probiotic Nissle 1917 [Citation37] were grown to exponential phase in RPMI 1640 medium (Thermo Fisher Scientific) supplemented with 10 μM FeCl3 (RF) or without (R), at 37°C with shaking at 200 rpm, and then diluted 1:100 in RF or R medium (optical density at 600 nm, OD600 ~ 0.015) to be grown to stationary phase for ~16 h overnight in 1 L volumes.
M. smegmatis strain mc2 155 [Citation38] was transferred from a Middlebrook 7H11 agar plate (Fort Richard, Auckland, New Zealand) to a starter culture of Sauton’s media (0.5 g monobasic potassium phosphate, 0.5 g magnesium sulfate, 4.0 g l-asparagine, 0.05 g ferric ammonium citrate, 2.0 g citric acid, 47.6 mL glycerol, 0.1 mL of 1% w/v zinc sulfate solution; distilled water added to a total volume of 1 L; pH adjusted to 6.8–7.2 [Citation39];). The starter culture was then adjusted to OD600 ~ 0.05 into 1 L of Sauton’s and incubated for 6 days at 37°C with shaking at 200 rpm.
Crude MV preparation
Bacterial cells were removed from the culture broth by centrifuging twice at 7000g for 10 min at 4°C, after which any residual cells were removed from the supernatant by filtration using 0.22 μm PES filter (Merck Millipore). Supernatants were concentrated using 100 kDa Vivaflow 200 cassettes (Sartorius AG), which remove proteins and other molecules under 100 kDa. The MVs were pelleted from cleared supernatants by ultracentrifugation at 75,000g for 2.5 h at 4ᵒC. MVs were then resuspended in PBS (Sigma-Aldrich), filter sterilised using a 0.22 μm PES syringe filter and further concentrated using 100 kDa Vivaspin 500 columns (Sartorius AG). Resulting crude MV preparations were stored at −80ᵒC.
MV fractionation by DGC
Crude MV preparations were further purified by DGC. A six layer (2.0 mL each of 45, 40, 35, 30, 25 and 20%) OptiPrep density gradient (Sigma-Aldrich) was set up in 12 mL ultracentrifugation tube (UltraClear 5/8 × 3¾ in, Beckman Coulter). 500 µL of crude preparations containing known but variable amounts of protein were adjusted to the 45% medium before loading into the bottom of the tube and centrifuged at 100,000g for 18 h at 4ᵒC (rotor JS-24 and centrifuge Avanti J-30 I, Beckman Coulter). Resulting fractions were determined by visual inspection and removed sequentially from the top using a pipette and diluted in ~50 mL of PBS to remove OptiPrep medium. Fractions were then concentrated with 100 kDa Vivaspin 20 columns (Sartorius AG) to volumes of ~600–900 µL. Fractions were stored at −80ᵒC prior to molecular analysis. Each fraction underwent a minimum quality control to assess protein content and particle count as detailed below.
MV fractionation by qEV SEC
qEV columns (IZON, New Zealand) were used following the manufacturer’s instructions. Briefly, the column was washed with 10 mL of PBS prior to use. When ready, 500 µL of the crude MV sample with known protein content were loaded into the top-filter of the column. Thirteen or more ~0.5 mL fractions were eluted and collected manually in 1.5 mL tubes while 6 mL of PBS was added to the column. The qEV column was then washed with 20 mL of PBS and stored with 20% ethanol in water. Wash solutions were tested for protein contamination by BCA assay. Columns were thoroughly cleaned using 10 mL 0.5M NaOH followed by PBS until the eluate reached a pH of 2–14. Each qEV fraction was quality controlled for protein and particle count as for the DGC fractions.
Protein analysis
MV preparations were quantified for protein content using bicinchoninic acid (BCA) assay (Thermo Fisher Scientific) according to the manufacturer’s instructions, and protein profiles assessed after sonication of the vesicles using NuPAGE Bis-Tris 4–12% gradient gels (Thermo Fisher Scientific) and SYPRO Ruby staining (Thermo Fisher Scientific). Stained gels were imaged using a Gel DocTM EZ system (BioRad). We note that a trial sonication of the isolated vesicle preparations before BCA assay did not affect their detected quantities.
RNA isolation and analysis
MV preparations were resuspended in up to 1 mL of TRIzol LS (Thermo Fisher Scientific), and 200 μL of chloroform and 2 μL of 5 mg/mL glycogen (Thermo Fisher Scientific) added. Samples were vortexed for 15 s, incubated for 10 min at room temperature and centrifuged at 17,000g for 10 min at 4ᵒC. The upper aqueous phase was collected and mixed with 1.25 volume of 100% ethanol, and purified using a mirVana RNA isolation kit (Thermo Fisher Scientific), according to the manufacturer’s protocol for total RNA isolation. Yields were determined by Qubit 2.0 fluorometer using Qubit RNA HS assay kit (Thermo Fisher Scientific). The RNA concentrations of MVs isolated from each fraction were too low to allow further qualitative analysis.
Endotoxin analysis
Lipopolysaccharide (LPS) was quantified by EndoZyme® recombinant Factor C Endotoxin Detection Assay (Hyglos GmbH, Germany). The procedure was performed as per manufacturer’s instructions. Plates were read on a PerkinElmer EnSpire 2300 plate reader, and the results were expressed in endotoxin units (EU).
Particle count and size measurement by NTA
The particle concentrations in MV preparations were analysed by nanoparticle tracking analysis (NTA) using a Nanosight NS300 system (Malvern Instruments Ltd.). The data were analysed using NTA software version 3.0. The machine was calibrated and cleaned between samples with ultrapure water (MilliQ, Millipore) Each sample was diluted 100–10,000 times with PBS, administered at constant flow rate (50 AU) with an automated syringe pump at 25°C and recorded in sets of three videos of 30 s with 5 s delay between recordings. Camera level varied between 7 and 8 and detection threshold was 5. Each sample was measured in triplicate and data were combined for analysis.
Transmission electron microscopy
For negative staining, MV preparations were adsorbed onto Formvar-coated copper grids for 2 min. Excess sample was blotted off with filter paper. The grid was then transferred to a 20 µL drop of 2% (w/v) aqueous uranyl acetate for 2 min before blotting off the excess and air drying the grids. All grids were viewed in a Tecnai G2 Spirit TWIN (FEI, Hillsboro, OR, USA) transmission electron microscope (TEM) at 120 kV accelerating voltage. Images were captured using a Morada digital camera (SIS GmbH, Munster, Germany).
Results
Growth conditions influence MV populations in uropathogenic E. coli 536
The phenotype of bacterial cultures can be dependent upon key components of the culture conditions and these can reflect events that may occur during an infection. To investigate the role of MVs in infection, it is important to understand any significant variations in the profile of MVs purified from bacteria grown in different conditions. One example is the effect of iron restriction [Citation40], which has a dramatic effect upon broth cultures of UPEC 536 [Citation41].
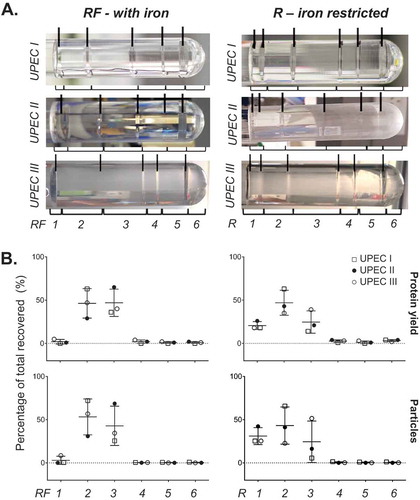
We first analysed the UPEC 536 MV fractions purified by OptiPrep DGC. Our starting samples were biologically replicated crude MV pellets isolated from bacteria cultures grown in iron restricted medium RPMI 1640 (R), concentrated sequentially through a 0.22 µM, then a 100 kDa filter followed by ultracentrifugation. Fractionation of three crude MV preparations by DGC, with known but varying protein loading, generated largely reproducible banding patterns () that were clearly altered when the bacteria were grown supplemented with iron (RF). Each visible band was individually collected along with the density layer immediately above it rather than using a procedure of taking equal volume aliquots that could have mixed band contents. This produced six broadly reproducible and defined fractions (see bracketed in ). The final highest density fraction, F6, lacked a band but contained any residual pellet. These fractions were then filter purified (100 kDa) to remove the OptiPrep prior to further characterisation. reveals the molecular content of each fraction, highlighting that the lower density bands at the top of the tube (fractions F1–F3) are enriched with protein and particles as counted by NTA. The recovered yields of protein in all the fractions, proportional to the amount loaded in the crude MV preparation, were 68.5–77.9% for RF and 70–81.5% for R. When grown in iron restricted conditions (R), fraction F1 actually contains two visible bands on the DGC that could not be separated during manual collection. If the particle-rich fractions F1–F3 () were pooled, the percentage of recovered protein in the pooled fraction relative to all fractions totalled was 92.3–99.3% for RF and 90.2–95.5% for R. This suggests that most of the recovered protein co-separates in these low density particle-rich fractions.
Figure 1. Fractionation of UPEC crude MVs by density gradient centrifugation. (a) UPEC I, II and III indicate three replicates prepared on different days. Density gradient fractionation of three replicate crude MV preparations from UPEC 536 grown with (RF) and without (R) iron supplementation. Density gradient banding in the tubes have individual fractions bracketed and are labelled from low to high density with visible bands marked with lines. (b) Protein amount and particle count are graphed as a percentage per fraction of all recovered. Error bars are mean ± standard deviation.
A more detailed molecular analysis of one of these three replicates (UPEC III; ) found that the less dense fractions F1-3 for RF culture condition contain not only most of the particles (99.5% of all recovered) and protein (92.3%), but also the most RNA (82.2%) and endotoxin (95.3%). Comparison of 1D PAGE gel banding patterns revealed few differences in individual protein bands between fractions. Taken together, these results show that there was little free protein in our MV preparations, which is probably removed through the initial 0.22 µm filtration, 100 kDa cut off concentration and ultracentrifugation steps.
Figure 2. Full molecular characterisation of density gradient fractions for one representative preparation of UPEC 536 MVs (UPEC III). One crude MV preparation from UPEC grown with (RF) and without (R) iron supplementation was further characterised. (a) Density gradient banding in the tubes have individual fractions bracketed and are labelled from low to high density with visible bands marked with lines. (b) Protein (µg/fraction), endotoxin (EU/fraction), RNA (ng/fraction), and particle counts (Millions/fraction) are graphed for each fraction. (c) PAGE profile of MV proteins with 10 µL of each fraction loaded and stained with SYPRO Ruby.
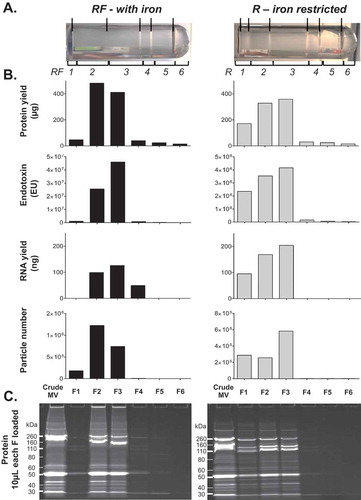
We have previously published visualisations of each fraction for RF in UPEC III ([Citation26]: S1 Fig. within the referenced paper) by TEM supports the presence of properly structured MVs in F2–F3. Interestingly in F4 we could clearly detect a population of ~30nm particles that would be too small for detection by NTA [Citation42,Citation43] and we hypothesise them to be lipid micelles that from our molecular analyses contain little endotoxin (). This F4 population also contains 13.5% of all recovered RNA but is relatively protein poor (2.7% of all recovered).
Different strains of E. coli (pathogenic and non-pathogenic) show similar DGC banding patterns
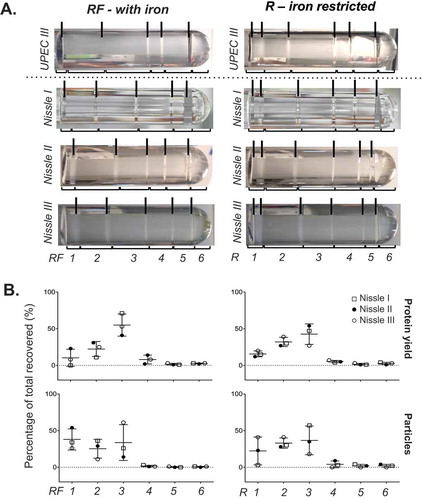
Different isolates of bacterial species can exhibit different levels of pathogenicity. To investigate whether two strains of the same bacterial species differ in the profile of MVs released, we chose to compare the uropathogenic strain UPEC 536 with the probiotic strain Nissle 1917; two E. coli strains that have well documented similarities and differences [Citation44]. We performed DGC on three crude MV preparations from Nissle 1917 again cultured in R and RF () and compared the banding patterns and content profile to that of UPEC 536. Both E. coli strains had the highest particle counts and protein yield in the three least dense fractions (F1–F3) in both RF (with iron) and R (limited iron) conditions. The greatest variation between three replicates in DGC banding was seen with Nissle 1917 in the presence of iron (RF). Like UPEC, Nissle 1917 responded to the absence of iron from the culture media (R), with reproducible changes to the DGC banding patterns observed. Our molecular analyses of the manually collected fractions of Nissle 1917 MVs confirmed high recovery of protein (82–95.5% of all fractions) and particle counts (85.6–99.7%) in the less dense fractions F1-3 when grown in R condition. DGC of crude MVs from Nissle 1917 grown in RF gave the highest more particle counts in F1 (25–54% of all fractions) than seen before in UPEC 536 (0.1–8%; ). This suggests that the supplementation of iron in E. coli cultures may cause release of unique vesicle populations in certain strains.
Figure 3. Fractionation of Nissle 1917 crude MVs by density gradient centrifugation. (a) Nissle I, II and III indicate three replicates prepared on different days. Density gradient fractionation of one crude MV preparation from UPEC 536 grown with (RF) and without (R) iron supplementation alongside three from Nissle 1917. Density gradient banding in the tubes have individual fractions bracketed and are labelled from low to high density with visible bands marked with lines. (b) Protein amount and particle count are graphed as a percentage per fraction of all recovered. Error bars are mean ± standard deviation.
Comparison of using size exclusion column with DGC
The purification of a crude MV preparation by DGC is time consuming requiring an overnight centrifugation and hours of hands on laboratory time. We therefore trialled use of a commercial SEC column (qEV) for this purpose, a process that has been validated for the purification of eukaryotic extracellular vesicles [Citation32,Citation33,Citation45], and has the advantage that it takes less than an hour to run. There are no recommended manufacturers’ protocols for loading amounts and volumes for using these columns with bacterial MVs. We therefore used three further preparations of crude MVs isolated from UPEC grown with iron supplementation (RF), of varying protein content. Thirteen fractions of 500 µL each were sequentially collected and characterised for protein, RNA, endotoxin and particle counts (). Fractionation of qEV I and II were performed on the same qEV column using two separate preparations of crude MV isolated from UPEC grown with iron supplementation to assess the possibility of re-use of the column. A 0.5M sodium hydroxide wash step was used to clean the column in between samples. Focusing on the protein yield and MV particle counts, the second run (qEV II), interestingly had a “tail” of protein eluting into the later fractions when compared to the first (qEV I). To test whether this “tail” was due to the washing steps, we performed a third fractionation using another new column (qEV III) loading more input quantity to the column. The same “tail” pattern was seen and we conclude this is due to the latter two samples having a greater initial loading of MVs than the first trial (681 µg and 1168 µg relative to 298 µg), rather than the tailing being an effect of reusing a washed column. Three further replicate crude MV preparations of UPEC RF (755–820 µg protein equivalent), UPEC R (670–855 µg), Nissle 1917 RF (427–553 µg) and Nissle 1917 R (441–547 µg) were separately loaded onto qEV columns and the per fraction recovery of protein and particles was found to be reproducible ().
Figure 4. Fractionation of UPEC RF crude MVs using qEV size separation columns. Three biological replicates of crude MVs isolated from UPEC 536 grown with iron supplementation (RF) were fractionated by SEC. qEV I and qEV III were performed using new qEV columns, whereas qEV II was separated on the washed qEV column after the fractionation of qEV I. Particle counts, protein, RNA and endotoxin in each fraction as a percentage of all recovered are graphed. Recovery of all fractions, relative to input and amount of molecules in the vesicle enriched fractions F8–F10 are tabulated to the side. Transmission electron microscopy of representative fractions F8–F10 are inset in the top right hand corner with two magnifications per fraction shown.
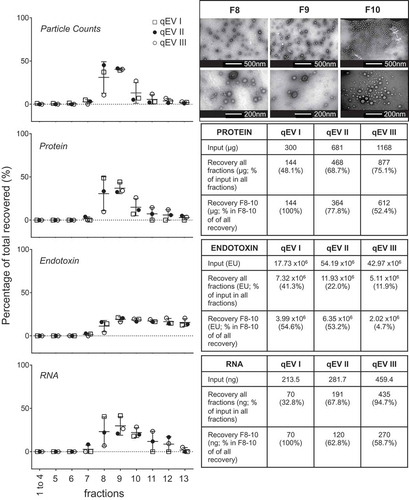
Figure 5. Fractionation of E. coli crude MVs is highly reproducible when equal protein loaded is used. Three biological replicates of crude MV preparations isolated from UPEC 536 (a, b) and Nissle 1917 (c, d) grown with (RF) and without (R) iron supplementation were fractionated by SEC. Protein amount and particle counts are graphed as a percentage per fraction of all recovered. Error bars are mean ± standard deviation.
The overall protein recovery rate, when almost equal amounts of protein were loaded for UPEC RF was similar by qEV, 63.4–79.7% compared to DGC at 68.5–77.9%. The overall protein recovery in all fractions from qEV improved with increasing crude MV input amount (, qEV I to qEV III). Focusing on the fractions that contained the largest particle counts, F1–F3 by DGC and F8–F10 by qEV, the protein recovery relative to the amounts loaded were 63.2–74.0% by DGC and 48.3–53.5% for qEV. The qEV isolated F8–F10 were validated as vesicle containing by TEM on a representative UPEC RF sample ().
LPS is an integral part of the outer membrane of Gram-negative bacteria (e.g. E. coli), which can be released into culture media by bacteria, and its endotoxin activity elicits well documented inflammatory/immune responses from mammalian cells [Citation46,Citation47]. It is important to consider this effect when interpreting the results from pathogenicity experiments with MVs and their components. Interestingly, the endotoxin in crude MV preparations appeared to be trapped in the qEV column and was slowly released into the later fractions in all three of our qEV UPEC RF trials (). The LPS content of the MV-containing fractions F8–F10 in qEV I to III was calculated as 4.7–22.5% of the total in all fractions in comparison with DGC fractions F1–F3 in UPEC, which was 31.7–39.7%. Therefore use of the qEV column, rather than DGC may improve removal of some of the contaminating free LPS from the crude MV samples.
Different bacteria release uniquely fractionated MVs
The MVs released by different bacterial species vary in protein, lipid and nucleic acid content [Citation1,Citation48]. The membrane envelope structure and mechanism of release may also differ between different species and their growth conditions resulting in MV populations of varied density or size. Such differences may influence fractionation of MVs by DGC and SEC. To investigate the fractionation of MVs from another bacterial species, we isolated MVs from the soil saprophyte M. smegmatis, a phylogenetically and physiologically distinct species to E. coli. We tested both DGC and SEC fractionation methods on duplicate preparations of crude MVs isolated from M. smegmatis (). Side-by-side comparisons found that the M. smegmatis vesicles exhibited a unique profile pattern in DGC fractions when compared to visible fractions from UPEC 536 and Nissle 1917 MVs, with the majority of particles present in the higher density fractions F4–F5 (46.6–66.3% of all recovery). 96.5–100% of protein and 74.8–79.7% of the isolated RNA were also found in those DGC fractions F4–F5 from M. smegmatis MVs. This supports the hypothesis that different bacterial species release unique populations of MVs that differ in density.
Figure 6. Density gradient and qEV fractionation of Mycobacterium smegmatis crude MVs. (a) Crude MV preparations from duplicate M. smegmatis cultures (MS I and MS II) were fractionated separately by either density gradient centrifugation (left) or by qEV size exclusion chromatography (right). A new qEV column was used for each size separation. (b) Protein, RNA yield, and particle counts are graphed as a percentage per fraction of all recovered. (c) PAGE profile of MV proteins with 10 µL of each fraction from MS I crude MV preparation loaded and stained with SYPRO Ruby.
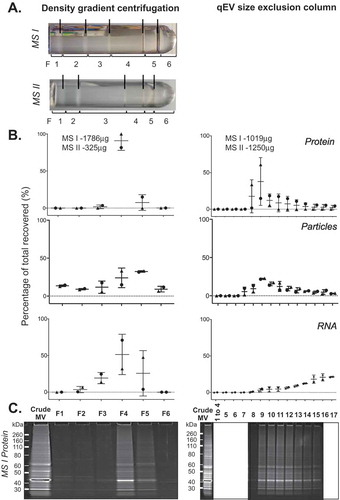
Finally, we trialled qEV size separation for the M. smegmatis MVs (). There was a continuing “tail” of protein yield and particle counts from fractions F8 onwards with the M. smegmatis MVs, similar to our observation with UPEC MVs. This may be in part due to large quantities (MS I = 1786 µg and MS II = 325 µg by protein content) of crude M. smegmatis MVs being loaded onto the qEV columns. The protein banding patterns of the MS I qEV fractions match those of the DGC F4–F5 roughly confirming that the same populations of MV are being isolated by two fractionation methods. However, by DGC the RNA was dominantly associated with protein and particle-rich fractions, whereas by qEV the RNA yields gradually increased with fraction number as protein and particle counts dropped. This suggests that the RNA is either associated with small vesicles or other molecules that elute in later fractions from the SEC, or alternatively is trapped in the qEV column causing slower elution.
Discussion
In this study we have highlighted the technical variability and inherent biological heterogeneity seen within and between bacterial species when crude MV preparations are fractionated by DGC. Since DGC separation is so time consuming, we also successfully trialled commercial SEC columns to purify MVs.
It was evident from our study that standardisation of MV purification techniques will be critical as this field advances. Guidelines for both the isolation and characterisation of extracellular vesicles and in particular exosomes from eukaryotes have previously been published in the Journal of Extracellular Vesicles [Citation20,Citation49]. These guidelines include recommendations for clear reporting of sample collection all the way through to careful multimodal characterisation of isolates. In contrast, there are no minimal standards as yet for the isolation of prokaryote MVs. Some researchers strongly recommended the use of DGC for the purification of MVs to remove common contaminants such as flagellae and protein aggregates [Citation19]. Therefore, we tested the practicality and reproducibility of using the DGC procedure for the enrichment of MVs.
It is of note that for bacterial MV DGC isolation, most published studies collect “equal volume” (1 or 2 mL) fractions sequentially from the top of the gradient after DGC [Citation14,Citation24,Citation50,Citation51]. Commonly, the MV-containing fraction is deemed to be the most protein-rich [Citation3,Citation14,Citation51,Citation52]. Our study however has found that the visible bands do not always settle in exactly the same place down the gradient. Due to this small variation we instead use the order of the visible banding pattern to determine the fractions for collection. This banding variation can be minimised by standardising the users and collection and handling protocols. Our downstream molecular analyses showed that in UPEC, the protein, LPS, RNA and MVs co-fractionate in the less dense top fractions.
Although the DGC banding patterns in UPEC vary with growth conditions (R and RF), an interesting biological finding itself, we have found that there is little difference in molecular patterns between two strains of E. coli, UPEC 536 and Nissle 1917. From this similarity we might suggest that a single fractionation protocol might be used to isolate the MV-rich populations for every strain within a species, however we would recommend in-house trials to confirm this for a species of interest.
The finding that the reproducibility of banding pattern between E. coli strains and biological replicates was improved in the iron depleted conditions (R) is of interest. The lack of iron in a culture system triggers a stress response in bacterial species, including Haemophilus influenza and Mycobacterium tuberculosis, which in turn causes the release of MVs [Citation25,Citation53]. Therefore in an infection environment, where the bacterium would encounter such stress, the released MVs may differ. Our study adds E. coli to the list of bacteria exhibiting differential MV production and molecular content in response to culture under iron restriction [Citation25,Citation53–Citation57]. This finding emphasises the need to carefully consider in vitro culture conditions when studying these pathogens and their MVs. We recommend that bacteria are cultured in conditions that best reflect their infection environments or milieu (e.g. RPMI ± iron), rather than in conditions of convenience (e.g. Luria broth).
In contrast, the DGC banding and molecular contents were very distinct for E. coli and M. smegmatis where in the latter the vast majority of the protein and MVs were found in the higher density fractions. Two other mycobacteria, M. abscessus and M. marinum, also have their own unique banding patterns after DGC (unpublished data). With further experimentation, this may suggest that an optimised fractionation protocol could be used for every strain within a species but may not be transferable between species or beyond.
As with E. coli, M. smegmatis RNA is associated with the crude MV preparation. Unlike E. coli however, after qEV size separation it appears that the M. smegmatis RNA does not co-fractionate with the majority of the protein or MVs. Even when considering the DGC data we find that mid density fraction F3, is low in protein and particle counts but also contains RNA. Therefore we propose that some of the secreted M. smegmatis RNA may associate with protein-poor, lower density, but low abundance particles. This parallels the finding of a specific population of RNA-rich globotriaosylceramide-lipid containing vesicles that are secreted by eukaryotic mesenchymal stem cells as part of a more diverse mixture of total vesicles [Citation58]. Our data from M. smegmatis further highlights the heterogeneity of prokaryotic MVs both between species and within an organism, and supports the need for their clear characterisation and careful fractionation.
Although we have shown that the MV fractionation by DGC is technically reproducible and able to clearly divide a heterogeneous sample, the method itself is time consuming. Therefore we also trialled size separation columns that are commercially available and previously shown to be effective for the purification of exosomes from challenging samples like blood plasma [Citation33]. Our analyses found that although the overall protein recovery rate was slightly lower by qEV than DGC, it was still able to purify MVs for UPEC. Aside from time saved, one further benefit for Gram-negative bacteria is the ability to partially deplete LPS from the purified MV fraction. Whether this is in free form or is a low abundance LPS-rich MV population we are unsure. LPS has been reported to be a useful marker of MV production [Citation59,Citation60]. However based on our SEC findings, with loss of LPS levels, it would not be a suitable choice as a marker for the rates of MV production when using this method of purification. We also note that it is possible to overload the qEV column with protein input, possibly leading to the shift in elution times that we have reported for the protein and particle containing fractions. For increased plasma volumes (>1 mL), and therefore protein inputs, this, as reported by the manufacturers of the qEV column, can lead to a shift in the elution times as reported by the manufacturers of the qEV column. The outcome of this will be that exosomes eluted in later fractions become contaminated with protein aggregates and less able to be cleanly separated. Therefore optimisation and equalisation of loading amount for bacterial MVs is recommended prior to SEC use.
From our findings we can conclude that the approaches advocated by the ISEV position papers released for the reporting of eukaryote extracellular vesicles are also highly applicable for research on prokaryotic MVs. We would support the importance of molecular and single vesicle characterisation to confirm the presence of vesicles in an isolate [Citation20]. In addition, moving toward distinct prokaryote-specific standardisation of upstream sample collection and MV isolation such as those currently defined in the published guidelines for eukaryotes [Citation49] is warranted. For example, we recommend comprehensive reporting of bacterial strains, culture growth conditions and biological replicates, which we have shown can substantially contribute to MV heterogeneity. Clear presentation of technical factors such as the processing and purification methodology, coupled with complete downstream molecular and single vesicle characterisation of the isolates should be considered as the minimal reporting requirements for prokaryotic vesicle isolation.
In summary, both DGC and qEV are able to fractionate a heterogeneous population of MVs. Both methods have their pros and cons for use due to the differences in the way that each works to separate MVs from contaminants and between MV populations. DGC may be the current gold standard for bacterial MV isolation and capable of separating unique populations of MVs, but qEV is less time consuming and as able to separate a generic mixed population of MVs. Although UPEC MVs were relatively homogenous for size, density and molecular contents, the M. smegmatis MVs are much more heterogeneous and more problematic for application of simple size exclusion isolation. Based on this, we believe that both DGC and qEV have their merits and would recommend trialling both as options for isolation of MVs from every prokaryotic species. The microbe MV field is rapidly evolving. In the future, with increased understanding of the molecular heterogeneity of bacterial MVs, supplementary protein markers could be applied to the isolation protocols to test for purity, in the same way as CD63 and Alix are commonly used for eukaryotic exosomes [Citation61,Citation62]. However, these protein markers are likely to be species specific rather than universal due to the lack of conservation. It is also likely that with clearer proteomic characterisation of pure MVs released from each bacterial species, immunoaffinity capture purification against specific proteins may be used to fractionate the individual populations of MVs. Until that time, standardised DGC and SEC protocols as well as improved transparency in method reporting will assist with building on the current understanding of prokaryotic MVs.
Acknowledgements
We would like to thank Hilary Holloway and Jacqui Ross at Biomedical Imaging Research Unit, The University of Auckland for their ongoing technical assistance with TEM.
Disclosure statement
No potential conflict of interest was reported by the authors.
Additional information
Funding
Related Research Data
References
- Deatherage BL, Cookson BT. Membrane vesicle release in bacteria, eukaryotes, and archaea: a conserved yet underappreciated aspect of microbial life. Infect Immun. 2012;80(6):1–14.
- Perez-Cruz C, Delgado L, Lopez-Iglesias C, et al. Outer-inner membrane vesicles naturally secreted by gram-negative pathogenic bacteria. Plos One. 2015;10(1):e0116896.
- Perez-Cruz C, Carrion O, Delgado L, et al. New type of outer membrane vesicle produced by the Gram-negative bacterium Shewanella vesiculosa M7T: implications for DNA content. Appl Environ Microbiol. 2013;79(6):1874–1881.
- Kulkarni HM, Jagannadham MV. Biogenesis and multifaceted roles of outer membrane vesicles from Gram-negative bacteria. Microbiology. 2014;160(Pt 10):2109–2121.
- Grande R, Di Marcantonio MC, Robuffo I, et al. Helicobacter pylori ATCC 43629/NCTC 11639 outer membrane vesicles (OMVs) from biofilm and planktonic phase associated with extracellular DNA (eDNA). Front Microbiol. 2015;6:1369.
- Yonezawa H, Osaki T, Kurata S, et al. Outer membrane vesicles of Helicobacter pylori TK1402 are involved in biofilm formation. BMC Microbiol. 2009;9:197.
- Macdonald IA, Kuehn MJ. Stress-induced outer membrane vesicle production by Pseudomonas aeruginosa. J Bacteriol. 2013;195(13):2971–2981.
- Kunsmann L, Ruter C, Bauwens A, et al. Virulence from vesicles: novel mechanisms of host cell injury by Escherichia coli O104: h4outbreak strain. Sci Rep. 2015;5:13252.
- Elluri S, Enow C, Vdovikova S, et al. Outer membrane vesicles mediate transport of biologically active Vibrio cholerae cytolysin (VCC) from V. cholerae strains. Plos One. 2014;9(9):e106731.
- Bielaszewska M, Ruter C, Kunsmann L, et al. Enterohemorrhagic Escherichia coli hemolysin employs outer membrane vesicles to target mitochondria and cause endothelial and epithelial apoptosis. Plos Pathog. 2013;9(12):e1003797.
- Waller T, Kesper L, Hirschfeld J, et al. Porphyromonas gingivalis outer membrane vesicles induce selective tumor necrosis factor tolerance in a toll-like receptor 4- and mTOR-dependent manner. Infect Immun. 2016;84(4):1194–1204.
- Deknuydt F, Nordstrom T, Riesbeck K. Diversion of the host humoral response: a novel virulence mechanism of Haemophilus influenzae mediated via outer membrane vesicles. J Leukoc Biol. 2014;95(6):983–991.
- Manning AJ, Kuehn MJ. Contribution of bacterial outer membrane vesicles to innate bacterial defense. BMC Microbiol. 2011;11:258.
- McCaig WD, Koller A, Thanassi DG. Production of outer membrane vesicles and outer membrane tubes by Francisella novicida. J Bacteriol. 2013;195(6):1120–1132.
- Yuana Y, Koning RI, Kuil ME, et al. Cryo-electron microscopy of extracellular vesicles in fresh plasma. J Extracell Vesicles. 2013;2.
- Hogan MC, Johnson KL, Zenka RM, et al. Subfractionation, characterization, and in-depth proteomic analysis of glomerular membrane vesicles in human urine. Kidney Int. 2014;85(5):1225–1237.
- Kowal J, Arras G, Colombo M, et al. Proteomic comparison defines novel markers to characterize heterogeneous populations of extracellular vesicle subtypes. Proc Natl Acad Sci U S A. 2016;113(8):E968–E977.
- Klimentova J, Stulik J. Methods of isolation and purification of outer membrane vesicles from gram-negative bacteria. Microbiol Res. 2015;170:1–9.
- Kulp A, Kuehn MJ. Biological functions and biogenesis of secreted bacterial outer membrane vesicles. Annu Rev Microbiol. 2010;64:163–184.
- Lotvall J, Hill AF, Hochberg F, et al. Minimal experimental requirements for definition of extracellular vesicles and their functions: a position statement from the International society for extracellular vesicles. J Extracell Vesicles. 2014;3:26913.
- Sidhu VK, Vorholter FJ, Niehaus K, et al. Analysis of outer membrane vesicle associated proteins isolated from the plant pathogenic bacterium Xanthomonas campestris pv. campestris. BMC Microbiol. 2008;8:87.
- Avila-Calderon ED, Lopez-Merino A, Jain N, et al. Characterization of outer membrane vesicles from Brucella melitensis and protection induced in mice. Clin Dev Immunol. 2012;2012:352493.
- Berleman JE, Allen S, Danielewicz MA, et al. The lethal cargo of Myxococcus xanthus outer membrane vesicles. Front Microbiol. 2014;5:474.
- Horstman AL, Kuehn MJ. Enterotoxigenic Escherichia coli secretes active heat-labile enterotoxin via outer membrane vesicles. J Biol Chem. 2000;275(17):12489–12496.
- Roier S, Zingl FG, Cakar F, et al. A novel mechanism for the biogenesis of outer membrane vesicles in Gram-negative bacteria. Nat Commun. 2016;7:10515.
- Blenkiron C, Simonov D, Muthukaruppan A, et al. Uropathogenic escherichia coli releases extracellular vesicles that are associated with RNA. Plos One. 2016;11(8):e0160440.
- Biller SJ, Schubotz F, Roggensack SE, et al. Bacterial vesicles in marine ecosystems. Science. 2014;343(6167):183–186.
- Sjostrom AE, Sandblad L, Uhlin BE, et al. Membrane vesicle-mediated release of bacterial RNA. Sci Rep. 2015;5:15329.
- Ghosal A, Upadhyaya BB, Fritz JV, et al. The extracellular RNA complement of Escherichia coli. Microbiologyopen. 2015;4:252–266.
- Post DM, Zhang D, Eastvold JS, et al. Biochemical and functional characterization of membrane blebs purified from Neisseria meningitidis serogroup B. J Biol Chem. 2005;280(46):38383–38394.
- Kataoka M, Yamaoka A, Kawasaki K, et al. Extraordinary denaturant tolerance of keratinolytic protease complex assemblies produced by Meiothermus ruber H328. Appl Microbiol Biotechnol. 2014;98(7):2973–2980.
- Boing AN, Van Der Pol E, Grootemaat AE, et al. Single-step isolation of extracellular vesicles by size-exclusion chromatography. J Extracell Vesicles. 2014;3.
- Lobb RJ, Becker M, Wen SW, et al. Optimized exosome isolation protocol for cell culture supernatant and human plasma. J Extracell Vesicles. 2015;4:27031.
- De Menezes-Neto A, Sáez MJF, Lozano-Ramos I, et al. Size-exclusion chromatography as a stand-alone methodology identifies novel markers in mass spectrometry analyses of plasma-derived vesicles from healthy individuals. J Extracell Vesicles. 2015;4:27378.
- Lozano-Ramos I, Bancu I, Oliveira-Tercero A, et al. Size-exclusion chromatography-based enrichment of extracellular vesicles from urine samples. J Extracell Vesicles. 2015;4:27369.
- Knapp S, Hacker J, Jarchau T, et al. Large, unstable inserts in the chromosome affect virulence properties of uropathogenic Escherichia coli O6 strain 536. J Bacteriol. 1986;168(1):22–30.
- Nissle A. Die antagonistische behandlung chronischer darmstörungen mit colibakterien. Med Klin (Munich). 1918;2:29–33.
- Snapper SB, Melton RE, Mustafa S, et al. Isolation and characterization of efficient plasmid transformation mutants of Mycobacterium smegmatis. Mol Microbiol. 1990;4(11):1911–1919.
- Allen BW. Mycobacteria. General culture methodology and safety considerations. Methods Mol Biol. 1998;101:15–30.
- Dauros-Singorenko P, Swift S. The transition from iron starvation to iron sufficiency as an important step in the progression of infection. Sci Prog. 2014;97(Pt 4):371–382.
- Rowe MC, Withers HL, Uropathogenic SS. Escherichia coli forms biofilm aggregates under iron restriction that disperse upon the supply of iron. FEMS Microbiol Lett. 2010;307(1):102–109.
- Van Der Pol E, Coumans FA, Grootemaat AE, et al. Particle size distribution of exosomes and microvesicles determined by transmission electron microscopy, flow cytometry, nanoparticle tracking analysis, and resistive pulse sensing. J Thromb Haemost. 2014;12(7):1182–1192.
- Filipe V, Hawe A, Jiskoot W. Critical evaluation of nanoparticle tracking analysis (NTA) by NanoSight for the measurement of nanoparticles and protein aggregates. Pharm Res. 2010;27(5):796–810.
- Grozdanov L, Raasch C, Schulze J, et al. Analysis of the genome structure of the nonpathogenic probiotic Escherichia coli strain Nissle 1917. J Bacteriol. 2004;186(16):5432–5441.
- Baranyai T, Herczeg K, Onodi Z, et al. Isolation of exosomes from blood plasma: qualitative and quantitative comparison of ultracentrifugation and size exclusion chromatography methods. Plos One. 2015;10(12):e0145686.
- Raetz CR, Whitfield C. Lipopolysaccharide endotoxins. Annu Rev Biochem. 2002;71:635–700.
- Molinaro A, Holst O, Di Lorenzo F, et al. Chemistry of lipid A: at the heart of innate immunity. Chemistry. 2015;21(2):500–519.
- Schwechheimer C, Kuehn MJ. Outer-membrane vesicles from Gram-negative bacteria: biogenesis and functions. Nat Rev Microbiol. 2015;13(10):605–619.
- Witwer KW, Buzas EI, Bemis LT, et al. Standardization of sample collection, isolation and analysis methods in extracellular vesicle research. J Extracell Vesicles. 2013;2.
- Roy K, Hamilton DJ, Munson GP, et al. Outer membrane vesicles induce immune responses to virulence proteins and protect against colonization by enterotoxigenic Escherichia coli. Clin Vaccine Immunol. 2011;18(11):1803–1808.
- Bauman SJ, Kuehn MJ. Purification of outer membrane vesicles from Pseudomonas aeruginosa and their activation of an IL-8 response. Microbes Infect. 2006;8(9–10):2400–2408.
- Ellis TN, Leiman SA, Kuehn MJ. Naturally produced outer membrane vesicles from Pseudomonas aeruginosa elicit a potent innate immune response via combined sensing of both lipopolysaccharide and protein components. Infect Immun. 2010;78(9):3822–3831.
- Prados-Rosales R, Weinrick BC, Pique DG, et al. Role for Mycobacterium tuberculosis membrane vesicles in iron acquisition. J Bacteriol. 2014;196(6):1250–1256.
- Keenan JI, Allardyce RA. Iron influences the expression of Helicobacter pylori outer membrane vesicle-associated virulence factors. Eur J Gastroenterol Hepatol. 2000;12(12):1267–1273.
- Lappann M, Otto A, Becher D, et al. Comparative proteome analysis of spontaneous outer membrane vesicles and purified outer membranes of Neisseria meningitidis. J Bacteriol. 2013;195(19):4425–4435.
- Olczak T, Wojtowicz H, Ciuraszkiewicz J, et al. Species specificity, surface exposure, protein expression, immunogenicity, and participation in biofilm formation of Porphyromonas gingivalis HmuY. BMC Microbiol. 2010;10:134.
- Gorringe A, Halliwell D, Matheson M, et al. The development of a meningococcal disease vaccine based on Neisseria lactamica outer membrane vesicles. Vaccine. 2005;23(17–18):2210–2213.
- Lai RC, Tan SS, Yeo RW, et al. MSC secretes at least 3 EV types each with a unique permutation of membrane lipid, protein and RNA. J Extracell Vesicles. 2016;5:29828.
- Kulp AJ, Sun B, Ai T, et al. Genome-wide assessment of outer membrane vesicle production in escherichia coli. Plos One. 2015;10(9):e0139200.
- Duperthuy M, Sjostrom AE, Sabharwal D, et al. Role of the Vibrio cholerae matrix protein Bap1 in cross-resistance to antimicrobial peptides. Plos Pathog. 2013;9(10):e1003620.
- Bobrie A, Colombo M, Krumeich S, et al. Diverse subpopulations of vesicles secreted by different intracellular mechanisms are present in exosome preparations obtained by differential ultracentrifugation. J Extracell Vesicles. 2012;1.
- Clark DJ, Fondrie WE, Liao Z, et al. Redefining the breast cancer exosome proteome by tandem mass tag quantitative proteomics and multivariate cluster analysis. Anal Chem. 2015;87(20):10462–10469.