
ABSTRACT
To evaluate whether tumour-derived microvesicles (T-MV), originating from the plasma membrane, represent suitable cancer biomarkers, we isolated MV from peripheral blood samples of cancer patients with locally advanced and/or metastatic solid tumours (n = 330, including 79 head & neck cancers, 74 lung cancers, 41 breast cancers, 28 colorectal cancers and 108 with other cancer forms) and controls (n = 103). Whole MV preparations were characterised using flow cytometry. While MV carrying the tumour-associated proteins MUC1, EGFR and EpCAM were found to be enhanced in a tumour-subtype-specific way in patients’ blood, expression of the matrix metalloproteinase inducer EMMPRIN was increased independent of tumour type. Higher levels of EMMPRIN+-MV correlated significantly with poor overall survival, whereas the other markers were prognostic only in specific tumour subgroups. By combining all four tumour-associated antigens, cancer patients were separated from healthy controls with an AUC of up to 0.85. Ex vivo, whole MV preparations from cancer patients, in contrast to those of controls, induced a tumour-supporting phenotype in macrophages and increased tumour cell invasion, which was dependent on the highly glycosylated isoform of EMMPRIN. In conclusion, the detection of T-MV in whole blood, even in minor amounts, is feasible with standard techniques, proves functionally relevant and correlates with clinical outcome.
Responsible Editor Paul Harrison, University of Birmingham, UK
Introduction
Extracellular vesicles (EV) are increasingly recognised as important mediators in cellular communication. The two main populations of EV shed by living cells are exosomes (Exo, diameter 30–100 nm) formed by inward budding of endosomal membranes and released upon the fusion of multivesicular bodies with the plasma membrane, and microvesicles (MV, diameter 100–1000 nm) that bud off directly from the cell membrane [Citation1].
Over the last few years it has become apparent that EV play important roles in various human diseases including cancer. Recent studies have demonstrated that cancer cells can stimulate themselves with their own EV leading to increased tumour invasion, migration or proliferation [Citation2–Citation4]. In vitro studies have revealed that cancer-derived EV interact with the surrounding microenvironment, including immune cells, in which they can induce a tumour-supporting phenotype [Citation5–Citation7]. In vivo, the injection of tumour-cell-derived EV (T-EV) in mouse models of skin and pancreatic cancer leads to an accumulation of the vesicles in lymph nodes, lung tissue as well as in the bone marrow, in which they support the creation of pre-metastatic niches [Citation8–Citation10].
T-EV harbour a plethora of proteins that are often enriched in comparison with their cell of origin. Among them are many tumour-associated proteins such as epithelial cell adhesion molecule (EpCAM) which has allowed detection of tumour-derived Exo in blood of ovarian cancer patients [Citation11]. Also epithelial growth factor receptor (EGFR) has been found on exosomes from brain tumour cells [Citation12] and was shown to induce a pro-angiogenic phenotype when transferred on T-EV to endothelial cells [Citation13]. Other tumour-associated proteins found on T-EV include CD47 [Citation14], Mucin 1 (MUC1/CA 15–3) [Citation2,Citation15] or extracellular matrix metalloproteinase inducer (EMMPRIN/CD147), which promotes tumour invasion when expressed in its highly-glycosylated isoform on tumour-derived MV (T-MV) [Citation2]. Taken together, these tumour-associated antigens provide a whole panel of potential biomarkers. This is particularly promising for the identification of tumour cell signatures in peripheral blood, in contrast to the evaluation of individual secreted proteins. EV have already been isolated from various human body fluids including saliva, breast milk, ascites, cerebrospinal fluid (CSF), and peripheral blood (overview in [Citation16]). Recently, the smaller Exo were identified as novel biomarkers in early-stage pancreatic and breast cancer in patients’ blood [Citation17,Citation18]. Moreover, the analysis of Exo from blood allows real-time monitoring of glioblastoma therapy [Citation19]. However, the isolation and analysis of Exo is time consuming and requires special equipment. In contrast, due to their larger size, MV can easily be isolated from peripheral blood and characterised by flow cytometry, a technique routinely used for diagnostic purposes in most clinical centres.
Thus, the initial aim of this study was to define suitable markers that would allow the detection and comparative analysis of the various MV populations present in the peripheral blood of cancer patients and controls using an approach based on flow cytometry. This was performed with samples from our vesicle biobank containing blood taken from cancer patients suffering from metastatic disease originating from a number of different types of solid tumour, as well as from controls. These results were subsequently correlated with clinical parameters and subjected to functional analysis ex vivo. Our second aim here was to further define the role of T-MV present in cancer patients’ blood in tumour progression in vivo and to evaluate whether T-MV are suitable as biomarkers.
Materials and methods
Patients
All human samples were collected after obtaining informed consent as approved by the local ethics committee (approval no. 3/2/14). Peripheral blood samples were drawn either from cancer patients with various types of solid tumour (n = 330), healthy individuals (n = 62) or non-healthy patients (n = 41) ( and ). The healthy controls were mostly blood donors, whereas the non-healthy control group comprised patients with benign diseases, e.g. heart and kidney disease, diabetes or infections, as well as patients who were in long-lasting remission after treatment for haematological neoplasms. A few patients with indolent lymphomas under watch and wait strategy were also included in the non-healthy controls. Details of all groups are presented in and .
Table 1. Characterisation of the cohort.
Table 2. Diagnoses for the non-healthy controls.
The samples were obtained prior to treatment in order to minimise contamination with apoptotic vesicles. At the point in time of blood collection, cancer patients were staged as follows: Union for International Cancer Control (UICC) I, 18 patients; UICC II, 25 patients; UICC III, 35 patients; UICC IV, 126 patients (no UICC data available for 125 patients). The overall survival (OS) had a time to 50% at risk of 7.38 months (95% confidence interval (CI) 6.69–8.3). Follow-up examinations were performed at the discretion of individual physicians and the data were obtained either from the local clinical cancer registry or the physician responsible for the patient. OS was defined as the duration from the time at which blood samples were taken and cancer-related death.
Cells
Human MCF-7, MDA-MB-231 and SK-BR-3 breast cancer, A549 lung cancer as well as SW480 colorectal cancer cells (obtained from ATCC) were cultured in RPMI-1640 medium supplemented with 10% foetal calf serum (FCS). Platelets and red blood cells were obtained from concentrates kindly provided by the Department of Transfusion Medicine at the University Medical Centre Göttingen. Human macrophages were obtained from monocytes that had been isolated from Buffy coats and were differentiated with macrophage colony-stimulating factor (M-CSF) as described previously [Citation20].
Antibodies
To characterise MV flow cytometrically, the following antibodies were used: CD45 (J33, #A07782), CD235a (11E4B-7–6, #A07792, both Beckman Coulter), CD62P (AK4, #304905), CD47 (CC2C6, #323109), MUC1 (16A, #355604) EGFR (AY13, #352904), EMMPRIN (HIM6, #306207), CD62E (HAE-1f, #336008), EpCAM (9C4, #324208, all from Biolegend). To analyse CD63 expression, vesicles were incubated with the unlabelled CD63 antibody (H5C6, #556019, BD) or mouse IgG (#sc-2025, Santa Cruz Biotechnology) and signals visualised using a FITC-labelled secondary antibody (#sc-2010, Santa Cruz Biotechnology). Protein expression by Western Blotting was assessed using primary antibodies against EMMPRIN (H200, #sc-13976), MUC1 (VU4H5, #sc-7313), Tsg101 (C-2, #sc-7964), Hsp90 (F-8, #sc-13119, all from Santa Cruz Biotechnology), HDAC1 (#2062), EGFR, (D38B1, #4267, both from Cell Signaling), CD9 (MEM-61, #21270091, Immunotools), CD81 (5A6, #349501, Biolegend), Wnt5a (442625, #MAB645, R&D systems), syntenin (EPR8102, #ab133267, Abcam), GM130 (35/GM130, #610823, BD Transduction Laboratories) or Tubulin (DM1A, #05–829, Millipore). HRP-labelled secondary antibodies were purchased from Santa Cruz Biotechnology (#sc-2004, #sc-2005, #sc-2006).
Isolation of MV and Exo
MV from cell culture supernatants were isolated as described previously [Citation5]. Briefly, cancer cells or human macrophages were cultured for 48 h in RPMI-1640 supplemented with 10% or 1%, respectively, vesicle-depleted FCS (ultracentrifuged 16 h at 110,000g and filtered through a 0.2 µm filter). Supernatants were collected and spun down at 750g for 5 min followed by 1500g for 15 min to remove residual cells and debris. MV were pelleted at 14,000g, 4°C for 35 min, washed once with PBS, and stored at −20°C in PBS. MV derived from red blood cells and platelets were isolated from outdated (<2 days) erythrocyte or platelet concentrates, respectively, according to the described protocol. The concentration of MV was measured with a Lowry Dc protein assay (Bio-Rad).
In order to isolate EV from cancer patients and controls, 5–15 ml peripheral blood were collected in tubes containing EDTA (1.6 mg/ml blood, Sarstedt). To obtain plasma samples, the blood was centrifuged for 15 min at 1200g and passed through a valve filter (Seraplas, Sarstedt). Plasma was centrifuged for 15 min at 1500g and stored at −20°C. For the isolation of MV, samples were thawed slowly at room temperature and MV pelleted using ultracentrifugation as described above. In order to isolate Exo, the supernatant of the MV centrifugation step was filtered through a 0.2 µm filter and ultracentrifuged at 110,000g, 4°C for 2 h. EV were washed once in PBS, re-suspended in 50–500 µl PBS and stored at −20°C in a liquid biobank. In order to prevent any degradation of EV, plasma was processed within 30 min of blood withdrawal.
Western blotting
Up to 30 µg of MV were subjected to SDS-PAGE and blotted onto nitrocellulose. Membranes were blocked for 1 h at room temperature (RT) in 5% milk powder in TBST (137mM NaCl, 20mM Tris pH 7.6, 0.1% (v/v) Tween-20) and incubated with specific primary antibodies overnight at 4°C. After three washing steps in TBST for 5 min each, membranes were incubated with suitable secondary antibodies for 1 h at RT, washed three times in TBST for 5 min each and signals detected with ECL Prime (GE Healthcare) on a LAS-4000 imager (Fujifilm). Ponceau staining was used as loading control. Mean signal intensities were measured with ImageJ version 1.48.
Flow cytometry
MV (5 µg) were blocked in 20 µl PBS + 1% vesicle-depleted FCS for 30 min and incubated for 20 min at RT with fluorescently-labelled antibodies and corresponding isotype controls. Fluorescence was recorded on the FACS Canto II (BD) flow cytometer and data analysed with FACS Diva (version 6.1.3, BD) and FlowJo (Treestar) software.
Electron microscopy
EV were pelleted as described above and fixed in 0.1M sodium phosphate + 2% paraformaldehyde. After application to carbon-coated EM grids (400 mesh, Plano GmbH), they were post-fixed in 1% glutaraldehyde and washed with dH2O. Grids were incubated for 30 s in 1% uranyl acetate for negative contrasting. Images were taken using a CM 120 Bio Twin transmission electron microscope (Philips) and iTEM software (Olympus).
Nanoparticle tracking analysis (NTA)
EV size distribution and concentration were analysed from a 500 µl sample with the Nanosight NS300 (Malvern), which was equipped with a 488 nm laser and a sCMOS camera. Samples were measured diluted in PBS to obtain a concentration of 20–60 particles per frame. For each sample, three videos of 60 sec were recorded at an automatically controlled temperature of 25°C and a syringe pump flow rate of 50. Videos were analysed with NTA 2.3 software build 013 and used to calculate mean values of particle concentration and size for each sample.
Quantitative real-time PCR (qRT-PCR)
In order to analyse the effect of patient-derived MV on immune cells in the tumour microenvironment, 1 × 10⁶ human macrophages were stimulated with 50 µg/ml MV for 24 h. RNA was isolated using the High Pure RNA isolation kit (Roche), transcribed into cDNA with the iScript cDNA synthesis kit (Bio-Rad) and subsequently subjected to real-time PCR with SYBR green detection on the 7900 HT system (Applied Biosystems). Gene expression was normalised to the housekeeping genes HPRT1 and GNB2L1. Primer sequences are published in [Citation5] and for WNT5A in [Citation21].
Cell invasion assay and EMMPRIN blocking peptides
Tumour cell invasion was analysed using a modified Boyden chamber assay [Citation22]. Briefly, 1 × 10⁵ MCF-7 or SK-BR-3 cells were seeded in triplicates onto an ECM-coated polycarbonate membrane (pore diameter: 10 µm, Pieper Filter) in the upper wells of the chamber and grown for 96 h with/without MV stimulation (1 µg/ml). Subsequently, the number of invasive cells in the lower wells was counted and related to the unstimulated control. For studies with EMMPRIN blocking peptides, tumour cells were pre-incubated with the peptides for 2 h prior to the addition of MV. Sequences and synthesis of the peptides are published in detail in [Citation2].
Statistical analysis
All experiments were carried out in at least three biologically independent replicates. Statistical analyses were performed using the statistical computing software suite R version 3.2.2 (www.r-project.org). Population data are described as median with 95% confidence intervals (CI). Significance was calculated with a two-sided t test or Wilcoxon rank sum test, as appropriate. In the case of a non-Gaussian distribution, an estimate for the pseudomedian and the non-parametric confidence interval were calculated [Citation23]. Correlations were assessed via Kendall correlation test for ordinal associations. In survival analysis, events were defined as cancer-related death, all other events were considered as censored. Survival data were visualised using Kaplan–Meier plots and significance was calculated using the log-rank test for univariate analyses, stratifying the tumour antigens by a cut-off determined for an optimal separation of patients into high and low expression groups. Hazard ratio, log-rank p-value and number of patients in each group are given. Univariate analyses were performed with the R ‘survival’ package (version 2.39–5) using log-rank p-values when beta coefficients were infinite, or Wald test p-values in all other cases [Citation24]. Continuous values were used when no categories were listed. To evaluate the prognostic potential of the tumour antigens, the receiver operating characteristic (ROC) curve was generated with the R package ‘ModelGood’ (version 1.0.9) based on generalised linear models. The corresponding area under the curve (AUC) values for both the total patient cohort and indicated cancer subclasses were calculated. Optimal cut points of ROC curves were determined via the Youden index with corresponding sensitivity and specificity as stated.
Results
Isolation of total EV from peripheral blood
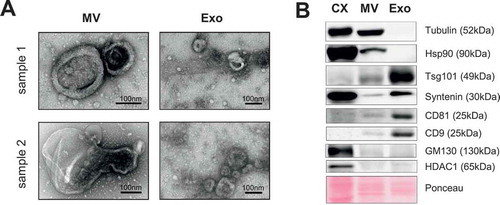
In order to establish a protocol to standardise the collection of MV from human peripheral blood samples, the isolated MV and Exo were analysed under an electron microscope, which revealed two morphologically distinct vesicle populations ()). While MV consisted of a heterogeneous cohort of vesicles with a diameter >100 nm, Exo were more homogenous and displayed a typical cup-shaped morphology with a diameter of <100 nm. These observations are in accordance with the current definition of the different vesicle populations [Citation1,Citation2]. The difference in size distribution was confirmed by nanoparticle tracking analysis (Supplementary Figure 1(a)). Moreover, standard markers of MV and Exo were expressed in the expected differential pattern in the two populations, while both were negative for intracellular proteins associated with compartments other than the plasma membrane or endosomes [Citation25] such as GM130 as marker for the Golgi [Citation26] or HDAC as marker for the nuclear compartment [Citation27] ()). Next, we tested the influence of pre-analytical variables, such as added anticoagulant as well as storage conditions, on MV quantity and composition. Comparative analysis of MV preparations out of either EDTA or lithium heparinate plasma from the same patient yielded better results with EDTA. Lithium heparinate seemed to promote the aggregation of platelet-derived MV and resulted in reduced MV protein yields as well as a decrease in total and especially platelet MV counts (Supplementary Figure 1(b–e)). While MV preparations from fresh plasma samples tended to contain slightly more platelet-derived MV, we detected no influence of short term (2 weeks) or long term (6 months) storage of plasma at −20°C on MV quantity and distribution (Supplementary Figure 1(f–i)).
Figure 1. Isolation of MV from peripheral blood. (a) Isolated MV and Exo from two donor samples were visualised by electron microscopy (TEM) revealing two morphologically different vesicle populations. (b) Representative western blot of at least three independent samples for common vesicle markers. CX = whole cell lysate from HeLa cells.
MV populations in the blood of cancer patients and controls
MV were prepared from EDTA blood samples from cancer patients with locally advanced and/or metastatic disease resulting from various types of solid tumours (n = 330; ), healthy individuals (n = 62; ) and non-healthy patients (n = 41; ). To investigate and compare MV subpopulations in the blood of cancer and healthy individuals, we next aimed to find suitable markers for MV shed by the different cell populations present in blood. Although MV are thought to reflect the protein composition of their cell of origin, protein export to these vesicles seems to undergo specific sorting procedures and thus not all cellular proteins are indeed expressed on MV [Citation28]. While CD62E has already been established as a suitable marker for endothelial-cell-derived MV [Citation29], markers for the other MV populations remain under discussion. We therefore characterised MV derived from the main blood cell populations. Flow cytometry revealed that CD235a, CD62P and CD45, as markers for red blood cells, platelets and leukocytes, are highly and specifically expressed on the respective MV populations and enable their discrimination in complex MV mixtures (–)).
Figure 2. Comparison of blood-cell-derived MV in cancer and control patients. (a–c) Flow cytometry analysis of specific markers for MV isolated from red blood cells, platelets and leukocytes (macrophages) (CD235a, CD62P, CD45: grey filled; respective isotype control: black line) (n = 3). (d) MV concentrations per ml plasma were determined by quantification of MV protein yield. (e) Flow cytometry: Comparison of the percentage of CD235a-, CD62P-, CD45- and CD62E-positive MV in blood from either cancer patients or healthy and non-healthy controls (*p = 0.037, **p = 0.023, two-sided t test). Boxplots depict the median (line), the 25–75 percentiles (box) and the 10–90 percentiles (whiskers). (f) Summary of the analysis of blood-cell-derived MV by flow cytometry. Significance was calculated with a two-sided t test or Wilcoxon rank sum test, as appropriate. *Indicates median calculation with [Citation23].
![Figure 2. Comparison of blood-cell-derived MV in cancer and control patients. (a–c) Flow cytometry analysis of specific markers for MV isolated from red blood cells, platelets and leukocytes (macrophages) (CD235a, CD62P, CD45: grey filled; respective isotype control: black line) (n = 3). (d) MV concentrations per ml plasma were determined by quantification of MV protein yield. (e) Flow cytometry: Comparison of the percentage of CD235a-, CD62P-, CD45- and CD62E-positive MV in blood from either cancer patients or healthy and non-healthy controls (*p = 0.037, **p = 0.023, two-sided t test). Boxplots depict the median (line), the 25–75 percentiles (box) and the 10–90 percentiles (whiskers). (f) Summary of the analysis of blood-cell-derived MV by flow cytometry. Significance was calculated with a two-sided t test or Wilcoxon rank sum test, as appropriate. *Indicates median calculation with [Citation23].](/cms/asset/bd60a0c8-f844-4fa2-8140-8aff6b5493bc/zjev_a_1340745_f0002_oc.jpg)
Since several studies have described an elevated number of vesicles in the blood of tumour patients compared to healthy controls [Citation11,Citation30,Citation31], we first measured the overall MV concentrations via quantification of MV protein yield in our large study group. However, we did not observe any significant increase in the total amount of MV in cancer patients’ blood (healthy: median 59.09; 95% CI 49.83–70.85, cancer: median 54.01; 95% CI 49.89–58.51 µg MV/ml plasma) (). Using our established markers, we then analysed the composition of blood cell-derived MV in cancer patients and controls (,)). In correspondence with previous reports [Citation32,Citation33], we detected the largest portion of blood-borne MV to be derived from platelets. The number of platelet-derived, CD62P+ MV was slightly, but significantly increased in cancer versus non-healthy control patients which might at least partially be due to slightly lower platelet and leukocyte counts in the latter (Supplementary Table 1). The same trend was observed for leukocyte-derived CD45+ MV. In contrast, we did not detect changes in the numbers of CD235a+ or CD62E+ MV. Furthermore, there were no significant abnormalities in blood cell counts of the cancer patients which could have influenced the results (Supplementary Table 1).
Identification of T-MV in the blood of cancer patients
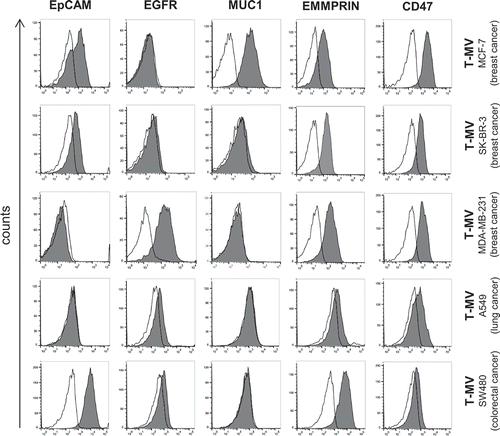
Next, we asked whether it is possible to detect T-MV within the mixture of blood-derived MV without any further selection or purification procedures which are time-consuming, may lead to loss of vesicles, and are therefore not suitable for routine diagnostics. First, we screened T-MV from five different tumour-cell lines (MCF-7, SK-BR-3, MDA-MB-231, A549, SW480) by flow cytometry for the expression of the proteins EpCAM, EGFR, MUC1, EMMPRIN/CD147, and CD47 (, Supplementary Figure 2(a)). These proteins are often overexpressed in tumours and are often used as so-called tumour markers [Citation2,Citation34–Citation36]. Among them, only CD47 and EMMPRIN were expressed ubiquitously on T-MV from all the analysed cell lines. In contrast, the other proteins were expressed in a way specific to tumour subtype, indicating their potential benefit in the detection of specific cancer types, such as MUC1 for breast cancer. T-MV did not express the Exo marker CD63, thus ruling out significant contaminations with this vesicle population (Supplementary Figure 2(b)).
Figure 3. Flow cytometry analysis of in vitro T-MV reveals EMMPRIN and CD47 as general markers of T-MV. MV were isolated from five cancer cell lines and characterised for the expression of known markers (grey filled) by flow cytometry (n ≥ 3). The respective isotype control is depicted as a black line.
We next analysed these markers in the samples from our vesicle biobank. Flow cytometry revealed that EMMPRIN+ as well as EpCAM+ MV were significantly elevated in the blood of cancer patients versus healthy and non-healthy controls (), ). Among the different cancer subgroups, EpCAM+ MV were increased especially in head & neck and breast cancer, but less in lung and colorectal cancer patients. EGFR+ MV were only elevated in comparison to non-healthy control patients, although there was also a trend towards an increase in comparison with the healthy controls. Higher levels of EGFR+ MV were observed in particular in colorectal cancer patients. Interestingly, the percentage of MUC1+ MV was elevated in non-healthy patients resulting in a significant difference only between healthy individuals and cancer patients. The increase in EGFR+ and MUC1+ MV present in cancer patients’ blood was also confirmed by western blotting (,)). CD47 proved unsuitable as a discriminator since it was expressed equally (>90% positive MV) in all the samples investigated and did not demonstrate any significant difference between cancer and control patients (Supplementary Figure 2(c)).
Table 3. Analysis of tumour MV in cancer patients.
Figure 4. A panel of MV-associated proteins identifies T-MV in cancer patients’ blood. (a) The percentage of EpCAM-, EMMPRIN-, MUC1- and EGFR-positive MV in whole blood was measured by flow cytometry. The four last boxes illustrate the results for the four largest cancer subgroups within the cohort. Exact values are given in . P-values were calculated with a Wilcoxon rank sum test. (b, c) Western blot analysis of EGFR and MUC1 expression in cancer- and control-patient-derived MV. Ponceau staining is depicted as loading control. (d, e) Flow cytometry: double staining of cancer- and control-patient-derived MV for EMMPRIN/MUC1 and EMMPRIN/EGFR. Gates were set based on the respective isotype control. Boxes mark the 25–75 percentiles (line at median) and whiskers the 10–90 percentile. *p = 6.852e-06, **p = 2.015e-06 (Wilcoxon rank sum test).
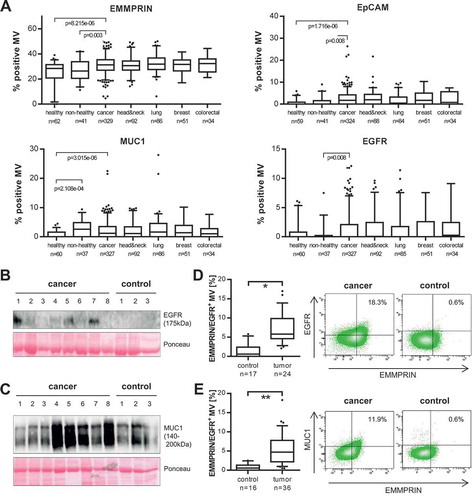
While EpCAM+, EGFR+ and MUC1+ MV were barely detectable in control samples, EMMPRIN+ MV were present in all the samples investigated. This is because of its presence also on benign MV derived from platelets or leukocytes (Supplementary Figure 2(d)). In contrast, none of the other proteins was present on MV derived from blood cells (Supplementary Figure 2(e)), thus underlining their specificity for T-MV. In order to confirm that the increase in the MV-associated tumour antigens in cancer patients’ blood does indeed reflect the presence of MV shed by tumour cells, we performed double staining with EMMPRIN and either EGFR or MUC1 as a second marker. Consistently, the EGFR+ and MUC1+ MV also stained positive for EMMPRIN. This population of either EGFR+/EMMPRIN+ or MUC1+/EMMPRIN+ MV was significantly elevated in cancer patients and almost undetectable in controls (), thereby again underlining the tumour specificity of these markers.
Higher glycosylated EMMPRIN is detected predominantly on cancer patients´ MV
Previously, we identified the presence of three different EMMPRIN glycoforms on MV of which only the very highly-glycosylated variant (HG-EMMPRIN, 50–65 kDa) with N-glycosylation at the residues N160 and N268 is expressed on pro-invasive MV mediating tumour cell invasion [Citation2]. Consistently, this glycoform was detectable only on whole-blood-derived MV from cancer patients, whereas the intermediately glycosylated form (IG-EMMPRIN, 45–50 kDa) which is not pro-invasive [Citation2] was present in all samples ()). This further supports our hypothesis that the observed increase in EMMPRIN+ MV in cancer patients is indeed due to the presence of T-MV and not to a reactive increase in MV derived from benign cells such as platelets or leukocytes.
Figure 5. Highly-glycosylated EMMPRIN is enriched on cancer-patient-derived MV and mediates tumour invasion. (a) Western blot analysis of EMMPRIN glycoforms on MV derived from cancer or control patients. Ponceau staining is depicted as loading control. In the last control sample (first lane on the right), in vitro T-MV derived from MCF-7 cells were added to demonstrate the increase of HG-EMMPRIN in the presence of tumour-derived MV. HG-EMP = highly-glycosylated EMMPRIN, IG-EMP = intermediately-glycosylated EMMPRIN. Western blot images depict one representative of five independent experiments. Histograms represent mean signal intensities ± SD of HG- and IG-EMP in the MV analysed by western blot. *p = 0.035 with Wilcoxon rank sum test. (b) Boyden chamber assays of MCF-7 and SK-BR-3 cells stimulated for 96 h with 1 µg/ml MV derived from cancer or control patients (n = 14 for MCF-7, n = 4 for SK-BR-3, mean±SD, *p = 3.288e-17, **p = 7.833e-10 with two-sided t test). Invasion was calculated compared to unstimulated cells (ctl). (c) Invasiveness of MCF-7 cells either unstimulated (ctl) or in the presence of 1µg/ml MV derived from cancer patients with a high (>35%) or low (<35%) percentage of EMMPRIN+ MV in blood (n = 14, mean±SD, *p = 8.652e-17, **p = 4.379e-23, ***p = 0.031 with two-sided t test). (d) Boyden chambers: MCF-7 cells were pre-incubated for 2 h with or without (=ctl) specific blocking peptides directed towards N160 (P-N160) and N268 (P-N268) or random control peptides (P-N160rd and P-N268rd) and then stimulated with 1 µg/ml cancer-patient-derived MV (n = 10, mean±SD, *p = 7.722e-05, **p = 1.075e-03 with two-sided t test).
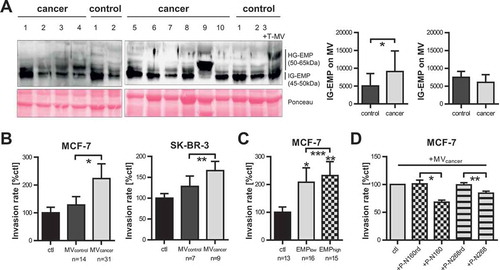
Cancer-patient-derived MV enhance tumour cell invasion ex vivo dependent on EMMPRIN glycosylation
Since in vitro T-MV enhance the invasiveness of tumour cells, we tested whether the whole mixture of cancer patient-derived MV exerts a similar effect ex vivo. Indeed, MV from cancer patients strongly enhanced the invasion of MCF-7 and SK-BR-3 breast cancer cells, whereas MV from control patients had no such effect ()). Moreover, MV from cancer patients with a very high number of EMMPRIN+ MV (>35%) enhanced tumour cell invasion more strongly than MV from patients with a lesser EMMPRIN content (). Tumour cell invasion induced by cancer-patient-derived MV was efficiently antagonised by specific blocking peptides directed against the two glycosylation sites N160 and N268 [Citation37], whereas random control peptides had no such effect (). Taken together, this underlines the assumption that T-MV in cancer patients’ blood are able to promote disease progression by increasing the invasiveness of cancer cells through HG-EMMPRIN.
Cancer-patient-derived MV influence macrophages towards a tumour-supporting phenotype
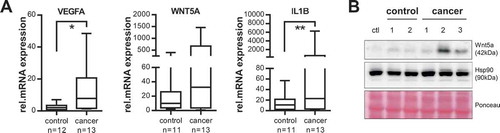
Considering that T-MV have been shown to influence surrounding immune cells [Citation5–Citation7], we aimed to investigate whether patient-derived MV can also foster the creation of a favourable tumour microenvironment essential to progression and metastasis formation. We thus stimulated human macrophages ex vivo with MV from cancer patients and controls and analysed their influence on the expression of several activation and polarisation genes ()). MV from cancer patients induced high expression of vascular endothelial growth factor (VEGF), a factor promoting angiogenesis [Citation38], as well as WNT5A and interleukin 1 beta (IL1B), which are known to drive macrophages into a tumour-supporting phenotype [Citation39–Citation41]. Since the upregulation of WNT5A mRNA did not quite reach significance (p = 0.0796) due to the high range of values, the WNT5A induction was additionally confirmed on the protein level ()). These findings suggest that T-MV in cancer patients’ blood have a strong effect on benign stroma cells and can support the creation of a favourable microenvironment.
Figure 6. Cancer-patient-derived MV induce a tumour-supporting phenotype in human macrophages. (a) Human macrophages were stimulated with MV isolated from cancer or control patients (50 µg/ml) for 24 h and gene expression of VEGFA, WNT5A and IL1B was measured by qRT-PCR (n = 4, *p = 0.004, **p = 0.041 with two-sided t test). Expression changes were calculated relative to unstimulated macrophages. Box plots illustrate the 25–75 percentiles (boxes), the 10–90 percentiles (whiskers) and the median (line). (b) Representative western blot of four independent experiments: Wnt5a expression in unstimulated macrophages (ctl) and after incubation with MV (50 µg/ml, 24 h) from cancer and control patients. Hsp90 and Ponceau staining are shown as loading controls.
T-MV in cancer patients’ blood are prognostic for clinical outcome
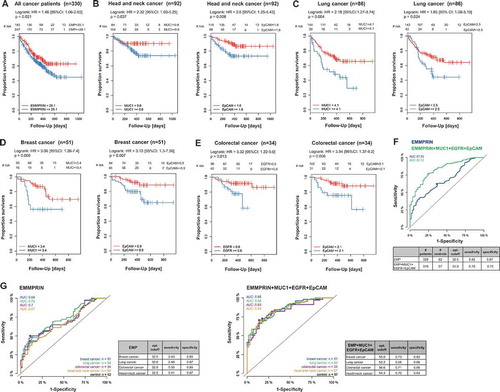
Based on these findings, our next step was to determine whether the presence of T-MV is associated with clinical outcome. We thus investigated into whether the amount of MUC1+, EGFR+, EpCAM+ or EMMPRIN+ MV was correlated with OS in the total study cohort. Interestingly, in spite of the diversity of cancer subtypes, a large number of EMMPRIN+ MV (>29.1% positive MV) significantly correlated with shorter OS (hazard ratio (HR) 1.46, 95% CI 1.06–2.03, p = 0.021) ()). This was supported by univariate analyses (Supplementary Table 2). The number of EMMPRIN+ MV in blood was especially increased in advanced tumour stages (Kendall’s tau coefficient: 0.1516, p = 0.005) (Supplementary Figure 3). Accordingly, univariate analyses confirmed that the number of EMMPRIN+ MV in blood is independent of age or gender but influenced by the tumour stage (Supplementary Table 3). As regards the other antigens, none of them proved prognostic in the total study cohort. However, as the in vitro screening of T-MV () and the analysis of patient samples ()) had already suggested, EpCAM, EGFR and MUC were not expressed on all cancer cells, but only on specific cancer subtypes. Taking this into consideration, we focused on the four largest cancer subclasses in our cohort, i.e. head and neck, lung, breast and colorectal cancer. There, we were able to demonstrate that an elevated number of MUC1+ MV is associated with an unfavourable prognosis in head and neck (HR 2.32, 95% CI 1.03–5.25, p = 0.037), lung (HR 2.18, 95% CI 1.27–3.74, p = 0.004), as well as breast (HR 3.06, 95% CI 1.26–7.4, p = 0.009) cancer (–)). MUC1 had no prognostic value in colorectal cancer, since it is rarely present on MV from these patients. Instead, colorectal cancer patients often displayed an elevated number of EGFR+ MV ()) which significantly correlated with shorter survival (HR 3.32, 95% CI 1.22–9.0, p = 0.013) ()). The presence of EpCAM+ MV was prognostic in all four cancer subclasses (–)). The discriminative power of these MV-associated tumour antigens was assessed using receiver operating characteristics (ROC) curves. None of the antigens alone was able to separate reliably cancer patients from healthy individuals in the total study cohort as well as in the four largest cancer subgroups, predominantly owing to a rather low sensitivity. The combination of all four markers, however, markedly enhanced sensitivity and discriminated between these cohorts with a high AUC of 0.83–0.85 (,)). The specificity for the mentioned markers either alone or in combination was rather high and mostly >0.8. Taken together, this demonstrates that through the definition of suitable antigens, MV can be employed as valuable prognostic biomarkers in cancer.
Figure 7. MV as prognostic biomarkers in cancer. (a) Kaplan–Meier survival curves of all cancer patients (n = 330) according to the number of EMMPRIN+ MV in blood. (b–e) Kaplan-Meier curves for patient survival in the indicated cancer subclasses in regard to the percentage of MUC1+, EpCAM+, or EGFR+ MV in blood. (f) ROC curves were used to determine the discriminative power of MV-associated EMMPRIN alone (blue) or in combination with EpCAM, EGFR, and MUC1 (green) in the total study cohort. (g) ROC curves for the four largest cancer subgroups stratified for EMMPRIN alone or in combination with MUC1, EpCAM and EGFR.
Discussion
This study provides the first detailed analysis of MV subpopulations in cancer patients’ blood with particular emphasis on the characterisation of T-MV within the whole MV mixture. These T-MV can be identified by using a simple flow cytometric approach through the combination of different antigens without any further sorting procedures. Although T-MV represent only a minor percentage of the whole MV population, their presence is associated with poor patient outcomes. The finding that these blood-borne MV strongly promote tumour cell invasion and influence the phenotype of immune cells ex vivo further highlights their function in cancer progression.
We focused on the analysis of MV in blood since they are larger than Exo and can thus be isolated much faster from a small amount of blood with routine table-top centrifuges and subsequently be analysed by flow cytometry. Although several groups are working on the establishment of alternative MV and Exo isolation methods using specific capture assays or micro-nuclear magnetic resonance (µNMR) chips [Citation19,Citation42,Citation43], these methods are expensive, require specialised equipment, and are thus not yet suitable for use in routine clinical diagnostics. Standard flow cytometry only allows the analysis of vesicles with a diameter >200–300 nm, meaning that some smaller MV might evade detection. Nevertheless our results confirm that this method is still sufficient to identify and characterise T-MV in whole blood. While some studies have described the presence of large oncosomes (diameter 1–10 µm) carrying tumour antigens in the circulation of mice with metastatic disease and patients with prostate cancer [Citation44,Citation45], we never found any vesicles larger than 800 nm in our MV preparations. Therefore, we believe that MV and large oncosomes are two different vesicle populations, although they might share overlapping functions or show similar protein expression patterns, considering that they both bud off directly from the plasma membrane.
We identified EMMPRIN/CD147 as a marker generally expressed on T-MV. Consistently, far more EMMPRIN+ MV were present in the blood of cancer versus healthy as well as non-healthy controls, proving prognostic in spite of the heterogeneity of our study cohort. Although EMMPRIN is also expressed on platelet- or leukocyte-derived MV, we did not detect any significant increase in these MV populations in cancer patients’ blood compared to healthy individuals. This supports our hypothesis that the increase in EMMPRIN+ MV numbers is indeed due to the presence of T-MV. This hypothesis was further corroborated by double staining with EMMPRIN and other tumour antigens. Of note, we found highly-glycosylated EMMPRIN only on cancer-patient-derived MV and not on controls. Previously, we identified this glycoform as one of the proteins responsible for the pro-invasive function of T-MV [Citation2]. Using specific blocking peptides, this was also confirmed for cancer patients’ MV.
The numbers of MUC1+, EGFR+ or EpCAM+ MV were also elevated in cancer patients’ blood. However, their prognostic value with respect to OS was restricted to specific cancer subtypes. This is not surprising, considering the subtype-specific expression pattern of these antigens. Although we were able to demonstrate that the number of EMMPRIN+ MV was positively correlated with poor survival in general, analysis of EMMPRIN or of other individual markers alone was not sufficiently sensitive to reliably separate cancer patients with different tumour entities from healthy individuals. However, as shown by ROC analysis, sensitivity was markedly increased and an accurate discrimination was achieved by combining all four antigens. Similar observations were made in another study, which demonstrated that only the combination of EGFR, EGFRvIII, Podoplanin (PDPN) and mutated isocitrate dehydrogenase 1 (IDH1) was able to distinguish glioblastoma-derived EV from host-derived EV efficiently [Citation19]. T-MV often harbour several tumour-specific antigens, which are easily and simultaneously accessible via multicolour flow cytometry. This provides us with the opportunity to identify tumour-specific or even patient-specific signatures, which may prove to be of higher sensitivity and specificity than measurement of the classic serum tumour markers.
The present study involved mostly patients with late-stage tumours and/or metastatic disease, since we assumed that the expected larger number of T-MV in advanced stages would facilitate the establishment of our methods as well as the identification of marker profiles. Based on these results, it will now be interesting to evaluate whether the tumour antigens identified also facilitate early disease detection as well as which combinations of markers are beneficial in the detection of specific cancer subtypes.
Although several studies in mice have already suggested that T-Exo can strongly promote disease progression by educating cells derived from bone marrow towards a pro-metastatic phenotype [Citation8] and preparing lymph nodes for metastasis formation [Citation9,Citation10], data on similar effects in human cancer patients are still scarce. In our study we now provide the first hints that not only T-Exo, but also T-MV are important in tumour progression. On the one hand, we observed that MV from cancer patients promoted tumour cell invasion ex vivo; on the other hand they initiated a tumour-supporting phenotype in human macrophages by inducing the expression of WNT5A, IL1B and VEGFA. These effects were not observed for MV derived from controls. Upregulation of VEGFA and WNT5A is known to increase endothelial cell proliferation, migration and activity [Citation46,Citation47], thereby suggesting some potential angiogenesis-promoting effect of T-MV. Furthermore, WNT5A can upregulate C-C motif chemokine ligand 2 (CCL2) expression in myeloid cells which would enable the recruitment of more macrophages [Citation48] that are known to mediate pre-metastatic site formation [Citation49]. In vitro studies of IL1B have revealed protumoural effects by revealing that colorectal cancer cells can induce the release of IL1B from surrounding macrophages, which then acts back on the tumour cells and activates canonical WNT signalling in support of tumour growth [Citation39]. Taken together, these results suggest that MV promote tumour invasion as well as the creation of a favourable tumour niche in vivo, which favours disease progression and metastasis formation. Therefore, it is not surprising that all the patients in our study with large numbers of MV carrying tumour antigens (EMMPRIN, MUC1, EGFR or EpCAM) had a significantly shorter OS.
In conclusion, we show that with the use of a combination of different antigens, T-MV can be reliably detected within the mixture of MV in cancer patients’ blood by flow cytometry without any further purification process. Since the presence of these MV is associated with clinical outcome, they seem promising as novel prognostic biomarkers in cancer, especially upon characterisation with multiple markers. Our study also provides new insight into the pro-invasive MV function via their influence on the tumour microenvironment, which suggests a role as potential targets in novel anti-cancer therapies.
Supplement_data.pdf
Download PDF (387.5 KB)Acknowledgments
We would like to thank Meike Schaffrinski for her excellent technical assistance, Leonie Witte for her contribution to the analysis of CD47, as well as Daniela Egert, Henrietta Vida, Kia Homayounfar, Lena-Christin Conradi, Leila Siam, Hendrik A. Wolff, Martin Canis and all of the employees on the Interdisciplinary Short Term Oncology ward (all from the University Medical Centre Göttingen) for their assistance in the acquisition of blood samples.
Disclosure statement
No potential conflict of interest was reported by the authors.
Supplemental data
Supplemental data for this article can be accessed here.
Additional information
Funding
Notes on contributors
Claudia Binder
K.M., A.B. and C.B. conceived and designed experiments, analysed data and wrote the manuscript. K.M., D.W., L.R. and M.S. performed experiments. F.K., B.S., A.B. and T.P. organised the acquisition of patient samples. B.H. collected patient data, A.W. performed statistical analyses and M.B. conceived and managed the vesicle biobank. U.R. designed and synthesised the EMMPRIN blocking peptides. C.B. supervised the study.
Related Research Data
References
- Raposo G, Stoorvogel W. Extracellular vesicles: exosomes, microvesicles, and friends. J Cell Biol. 2013;200(4):1–16.
- Menck K, Scharf C, Bleckmann A, et al. Tumor-derived microvesicles mediate human breast cancer invasion through differentially glycosylated EMMPRIN. J Mol Cell Biol. 2015;7(2):143–153.
- Koga K, Matsumoto K, Akiyoshi T, et al. Purification, characterization and biological significance of tumor-derived exosomes. Anticancer Res. 2005;25(6A):3703–3707.
- O’Brien K, Rani S, Corcoran C, et al. Exosomes from triple-negative breast cancer cells can transfer phenotypic traits representing their cells of origin to secondary cells. Eur J Cancer Oxf Engl 1990. 2013;49(8):1845–1859.
- Menck K, Klemm F, Gross JC, et al. Induction and transport of Wnt 5a during macrophage-induced malignant invasion is mediated by two types of extracellular vesicles. Oncotarget. 2013;4(11):2057–2066.
- Valenti R, Huber V, Filipazzi P, et al. Human tumor-released microvesicles promote the differentiation of myeloid cells with transforming growth factor-β–mediated suppressive activity on T lymphocytes. Cancer Res. 2006;66(18):9290–9298.
- Baj-Krzyworzeka M, Szatanek R, Weglarczyk K, et al. Tumour-derived microvesicles modulate biological activity of human monocytes. Immunol Lett. 2007;113(2):76–82.
- Peinado H, Alečković M, Lavotshkin S, et al. Melanoma exosomes educate bone marrow progenitor cells toward a pro-metastatic phenotype through MET. Nat Med. 2012;18(6):883–891.
- Jung T, Castellana D, Klingbeil P, et al. CD44v6 Dependence of premetastatic niche preparation by exosomes. Neoplasia N Y N. 2009;11(10):1093–1105.
- Hood JL, San RS, Wickline SA. Exosomes released by melanoma cells prepare sentinel lymph nodes for tumor metastasis. Cancer Res. 2011;71(11):3792–3801.
- Taylor DD, Gercel-Taylor C. MicroRNA signatures of tumor-derived exosomes as diagnostic biomarkers of ovarian cancer. Gynecol Oncol. 2008;110(1):13–21.
- Al-Nedawi K, Meehan B, Micallef J, et al. Intercellular transfer of the oncogenic receptor EGFRvIII by microvesicles derived from tumour cells. Nat Cell Biol. 2008;10(5):619–624.
- Al-Nedawi K, Meehan B, Kerbel RS, et al. Endothelial expression of autocrine VEGF upon the uptake of tumor-derived microvesicles containing oncogenic EGFR. Proc Natl Acad Sci. 2009;106(10):3794–3799.
- Kibria G, Ramos EK, Lee KE, et al. A rapid, automated surface protein profiling of single circulating exosomes in human blood. Sci Rep. 2016;6:36502.
- Staubach S, Razawi H, Hanisch F-G. Proteomics of MUC1-containing lipid rafts from plasma membranes and exosomes of human breast carcinoma cells MCF-7. Proteomics. 2009;9(10):2820–2835.
- Yáñez-Mó M, Siljander PR-M, Andreu Z, et al. Biological properties of extracellular vesicles and their physiological functions. J Extracell Vesicles. 2015;4(0).
- Melo SA, Luecke LB, Kahlert C, et al. Glypican-1 identifies cancer exosomes and detects early pancreatic cancer. Nature. 2015 ;523(7559):177–182.
- Moon P-G, Lee J-E, Cho Y-E, et al. Identification of developmental endothelial locus-1 on circulating extracellular vesicles as a novel biomarker for early breast cancer detection. Clin Cancer Res. 2016;22(7):1757–1766.
- Shao H, Chung J, Balaj L, et al. Protein typing of circulating microvesicles allows real-time monitoring of glioblastoma therapy. Nat Med. 2012;18(12):1835–1840.
- Menck K, Behme D, Pantke M, et al. Isolation of human monocytes by double gradient centrifugation and their differentiation to macrophages in teflon-coated cell culture bags. J Vis Exp. 2014;9:91.
- Weeraratna AT, Jiang Y, Hostetter G, et al. Wnt5a signaling directly affects cell motility and invasion of metastatic melanoma. Cancer Cell. 2002;1(3):279–288.
- Hagemann T, Robinson SC, Schulz M, et al. Enhanced invasiveness of breast cancer cell lines upon co-cultivation with macrophages is due to TNF-α dependent up-regulation of matrix metalloproteases. Carcinogenesis. 2004;25(8):1543–1549.
- Toutenburg H, Hollander M,DA. Wolfe: nonparametric statistical methods. John Wiley & Sons, New York-Sydney-Tokyo-Mexico City 1973. 503 S., $9.50. Biom Z. 1975 Jan 1;17(8):526–526.
- Therneau TM, Grambsch PM. Modeling survival data: extending the Cox model. New York: Springer; 2000. ISBN 0-387-98784–3.
- Lötvall J, Hill AF, Hochberg F, et al. Minimal experimental requirements for definition of extracellular vesicles and their functions: a position statement from the International Society for Extracellular Vesicles. J Extracell Vesicles. 2014;3:26913. doi:10.3402/jev.v3.26913 .
- Nakamura N, Rabouille C, Watson R, et al. Characterization of a cis-Golgi matrix protein, GM130. J Cell Biol. 1995;131(6):1715–1726.
- de Ruijter AJM, van Gennip AH, Caron HN, et al. Histone deacetylases (HDACs): characterization of the classical HDAC family. Biochem J. 2003;370(Pt 3):737–749.
- Muralidharan-Chari V, Clancy J, Plou C, et al. ARF6-regulated shedding of tumor cell-derived plasma membrane microvesicles. Curr Biol. 2009;19(22):1875–1885.
- Dignat-George F, Boulanger CM. The many faces of endothelial microparticles. Arterioscler Thromb Vasc Biol. 2011;31(1):27–33.
- Bergmann C, Strauss L, Wieckowski E, et al. Tumor-derived microvesicles in sera of patients with head and neck cancer and their role in tumor progression. Head Neck. 2009;31(3):371–380.
- Baran J, Baj-Krzyworzeka M, Weglarczyk K, et al. Circulating tumour-derived microvesicles in plasma of gastric cancer patients. Cancer Immunol Immunother CII. 2010;59(6):841–850.
- Gustafson CM, Shepherd AJ, Miller VM, et al. Age- and sex-specific differences in blood-borne microvesicles from apparently healthy humans. Biol Sex Differ. 2015 May 11;6:10. doi:http://dx.doi.org/10.1186/s13293-015-0028-8
- Berckmans RJ, Nieuwland R, Böing AN, et al. Cell-derived microparticles circulate in healthy humans and support low grade thrombin generation. Thromb Haemost. 2001;85(4):639–646.
- An T, Qin S, Xu Y, et al. Exosomes serve as tumour markers for personalized diagnostics owing to their important role in cancer metastasis. J Extracell Vesicles. 2015;4(1):27522.
- Willingham SB, Volkmer J-P, Gentles AJ, et al. The CD47-signal regulatory protein alpha (SIRPa) interaction is a therapeutic target for human solid tumors. Proc Natl Acad Sci. 2012;109(17):6662–6667.
- Taylor-Papadimitriou J, Burchell JM, Plunkett T, et al. MUC1 and the immunobiology of cancer. J Mammary Gland Biol Neoplasia. 2002;7(2):209–221.
- Sato T, Ota T, Watanabe M, et al. Identification of an active site of EMMPRIN for the augmentation of matrix metalloproteinase-1 and −3 expression in a co-culture of human uterine cervical carcinoma cells and fibroblasts. Gynecol Oncol. 2009;114(2):337–342.
- Qian B-Z, Pollard JW. Macrophage diversity enhances tumor progression and metastasis. Cell. 2010;141(1):39–51.
- Kaler P, Augenlicht L, Klampfer L. Macrophage-derived IL-1β stimulates Wnt signaling and growth of colon cancer cells; a crosstalk interrupted by vitamin D3. Oncogene. 2009;28(44):3892–3902.
- Pukrop T, Klemm F, Hagemann T, et al. Wnt 5a signaling is critical for macrophage-induced invasion of breast cancer cell lines. Proc Natl Acad Sci U S A. 2006;103(14):5454–5459.
- Smith K, Bui TD, Poulsom R, et al. Up-regulation of macrophage wnt gene expression in adenoma-carcinoma progression of human colorectal cancer. Br J Cancer. 1999;81(3):496–502.
- Yoshioka Y, Kosaka N, Konishi Y, et al. Ultra-sensitive liquid biopsy of circulating extracellular vesicles using ExoScreen. Nat Commun. 2014;5:3591.
- Zhao Z, Yang Y, Zeng Y, et al. A microfluidic ExoSearch chip for multiplexed exosome detection towards blood-based ovarian cancer diagnosis. Lab Chip. 2016;16(3):489–496.
- Di Vizio D, Morello M, Dudley AC, et al. Large oncosomes in human prostate cancer tissues and in the circulation of mice with metastatic disease. Am J Pathol. 2012;181(5):1573–1584.
- Minciacchi VR, You S, Spinelli C, et al. Large oncosomes contain distinct protein cargo and represent a separate functional class of tumor-derived extracellular vesicles. Oncotarget. 2015;6(13):11327–11341.
- Carmeliet P. VEGF as a key mediator of angiogenesis in cancer. Oncology. 2005;69(Suppl 3):4–10.
- Masckauchán TNH, Agalliu D, Vorontchikhina M, et al. Wnt5a signaling induces proliferation and survival of endothelial cells in vitro and expression of MMP-1 and Tie-2. Mol Biol Cell. 2006;17(12):5163–5172.
- Zhao C, Bu X, Wang W, et al. GEC-derived SFRP5 inhibits Wnt5a-induced macrophage chemotaxis and activation. Plos One. 2014;9(1):e85058.
- Noy R, Pollard JW. Tumor-associated macrophages: from mechanisms to therapy. Immunity. 2014;41(1):49–61.