
ABSTRACT
Extracellular vesicles (EVs) are membrane particles secreted from cells into all body fluids. Several EV populations exist differing in size and cellular origin. Using differential centrifugation EVs pelleting at 14,000 g (“microvesicles” (MV)) and 100,000 g (“exosomes”) are distinguishable by protein markers. Neutral sphingomyelinase (nSMase) inhibition has been shown to inhibit exosome release from cells and has since been used to study their functional implications. How nSMases (also known as SMPD2 and SMPD3) affect the basal secretion of MVs is unclear. Here we investigated how SMPD2/3 impact both EV populations. SMPD2/3 inhibition by GW4869 or RNAi decreases secretion of exosomes, but also increases secretion of MVs from the plasma membrane. Both populations differ significantly in metabolite composition and Wnt proteins are specifically loaded onto MVs under these conditions. Taken together, our data reveal a novel regulatory function of SMPD2/3 in vesicle budding from the plasma membrane and clearly suggest that – despite the different vesicle biogenesis – the routes of vesicular export are adaptable.
Introduction
Extracellular vesicles (EV) are a heterogeneous population of bilayered lipid membrane particles secreted from cells into all body fluids [Citation1]. They have signalling function leading to long-term changes in cellular behaviour and play important roles in several human diseases including cancer. During tumour progression increased EV secretion and specific loading of tumour promoting factors (proteins, mRNA and miRNA) in tumour-derived EVs have been reported, which primes even remote sites for metastasis formation [Citation2,Citation3]. Two different types of EVs have been described based on different biogenesis pathways [Citation1]: Exosomes (Exo), 50–150 nm small EVs originating from multivesicular bodies (MVBs) and [Citation2] Microvesicles (MV), 100–500 nm EVs that stem from the plasma membrane [Citation4]. Ceramide is a bioactive sphingolipid involved in many biological functions such as proliferation, apoptosis, differentiation and inflammation [Citation5]. In contrast to de novo synthesis of ceramide in the ER, different sphingomyelinases (SMases) hydrolyse the most abundant membrane lipid sphingomyelin (SM) into phosphorylcholine and ceramide and possess acid, alkaline or neutral pH optima. SMPD3 is the most studied neutral SMase (nSMase) and is a membrane-associated enzyme of 71 kDa that is activated by anionic phospholipids such as phosphatidylserine (PS) and phosphatidic acid (PA). SMPD2 was reported to possess both in vitro and in vivo nSMase activity and is localised to the Golgi and ER [Citation6]. NSMases are inhibited by GW4869 [Citation7], used in many studies in cell culture and in vivo studies. Treatment of cells with GW4869 was able to block induction of apoptosis in cancer cells [Citation7,Citation8] and to demonstrate involvement of SMPD3 in chemotaxis of neutrophils [Citation9,Citation10]. In addition, inhibition of nSMases was shown to reduce the secretion of Exos by blocking the ceramide-dependent budding of intraluminal vesicles (ILV) into the lumen of MVBs [Citation11].
Here, we report that inhibiting nSMases by GW4869 or RNAi alters the metabolite composition of cells and their EVs and, while blocking Exo release, stimulates the budding of MVs at the plasma membrane.
Results
GW4869 inhibition of nSMases differentially affects EV populations
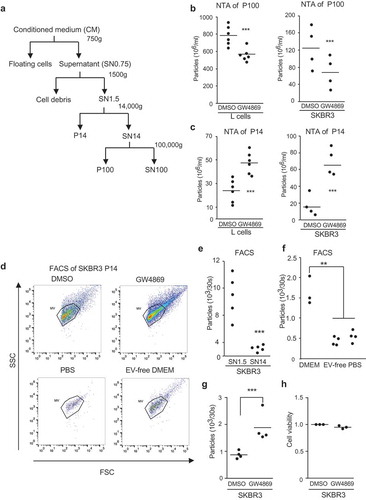
GW4869 is a specific inhibitor for nSMases (also known as SMPD2 and 3) and has been shown to inhibit Exo release from cells [Citation11]. Therefore, we wanted to test whether this is also true for the biogenesis of MVs pelleting at 14,000 g (P14) in contrast to Exos, usually pelleting at 100,000 g (P100) ()). Since sedimentation coefficient or size does not necessarily separate EVs according to their subcellular origin, we use the terms P14 and P100 to refer to EVs, which pellet at 14,000 g and 100,000 g, respectively. In accordance with previous studies [Citation12–Citation14], nanoparticle tracking analysis (NTA) of P100 confirmed a significant decrease in EV concentrations in several different cell lines (SKBR3, mouse L-cells) upon 16 hours of treatment with GW4869 incubation ()). Surprisingly, we observed a significant increase in the number of EVs in P14 ()). To confirm these findings, we analysed the P14 by flow cytometry ()). The size limit of flow cytometry and pelleting efficiency of the 14,000 g centrifugation was tested by comparing the number of particles in the cell culture supernatant before (SN1.5) and after (SN14) 14,000 g centrifugation ()). We detected only residual EVs in SN14 (less than 4 × 10³ particles/30 s measurements) compared to SN1.5 ()), background levels of particles in PBS and EV-free DMEM were ~0.5 x10³ particles (, lower panels,f)). In accordance with NTA measurements, GW4869 treatment of human SKBR3 breast cancer cells significantly increased secretion of larger EVs (, upper panels,g)) without affecting cell viability ()); the same results were observed in murine L-cells (Supplementary Figure 1 a,b). This demonstrates that GW4869 differentially affects the number of EVs sedimenting in P14 and P100.
Figure 1. GW4869 inhibition of SMPDs differentially affects EV populations (a) Scheme of EV purification from cell culture supernatant (SN) and respective pellets (P) further studied. (b) NTA measured concentrations of P100-EVs and (c) of P14-EVs. Cells were treated for 16 hours with DMSO or 5 µM GW4869 in EV-free DMEM. Each data point is based on samples analyzed in triplicates from mouse L-cells (left chart) and SKBR3 (right chart). (d) SKBR3-EVs in P14 from DMSO or 5 µM GW4869 cells (upper panels) were measured for 30 seconds by flow cytometry. Purified P14-EVs from SKBR3 cells were used to set the SSC and FSC gates. PBS and EV-free DMEM served as controls (lower panels) (e) Quantification of EVs from SN1.5 compared to SN14 and (f) normal, EV-free DMEM and PBS analyzed for 30 seconds by flow cytometry. (g) Quantification from (d) of EVs normalized to DMSO and (h) cell viability of cells from d. Significance level: *** < 0.001, ** <0.01, * < 0.05. All experiments were performed at least in biological triplicates.
Size distribution of EVs in P14 and P100
Next, we asked how inhibition of SMPD2 and SMPD3 affects EV size distribution in both fractions. First, we assessed size distribution of purified EVs in P14 and P100 from untreated cells by electron microscopy. Contrast-stained preparations revealed typical cup-shaped vesicles in both pellets ranging between 50 and 250 nm (–), Supplementary Figure 1c,d). P100-EVs were more uniformly sized with a main size of 50–100 nm, while P14-EVs were between 50 and 150 nm. Thus, EV in P14 and P100 have an overlap in similar sized vesicles between 100 and 150 nm ()). NTA measurements confirmed the observed size distribution in SKBR3 (,)), L-cells (Supplementary Figure 2a–d) and MDA-MB-231 cells (Supplementary Figure 2e,f). Using NTA we analysed whether GW4869 treatment influences EV secretion in a size-specific way. In P14 of SKBR3 cells, GW4869 especially increased the numbers of larger EVs between 100 and 200 nm ()), while in P100 it decreased the numbers of smaller EVs with a diameter less than 100 nm ()). There was some variation in GW4869-induced size shift between different cell lines tested (Supplementary Figure 2), which might depend on the membrane composition of these cells and whether EVs of a size between 100 and 200 nm sediment in P14 or P100. As suggested previously [Citation15], this overlap in EV populations and variation between different cell lines has to be taken as a caveat to every EV analysis.
Figure 2. Size distribution and proteins markers of EVs in P14 and P100: Electron microscopy of uranyl-acetate contrast-stained preparations from SKBR3 cells (a) P14 (Scale bar = 250 nm) and (b) P100 (Scale bar = 100 nm). (c) Size distribution of EVs from (a) and (b) in P14 (n = 133) and P100 (n = 180). (d) Size distribution of EVs in P14 and (e) P100 from DMSO and GW4869-treated SKBR3 cells as determined by NTA measurements from three independent experiments. Significance level: *** < 0.001, ** <0.01, * < 0.05. (f) Representative Western Blot of cell extract from SKBR3 cells (CX) and P14 and P100, samples representing equal amounts of proteins were loaded. (n = 3) (g) Heat map of multiplex protein DigiWest analysis of SKBR3 P14 and P100 in biological duplicates. (See Material and Methods).
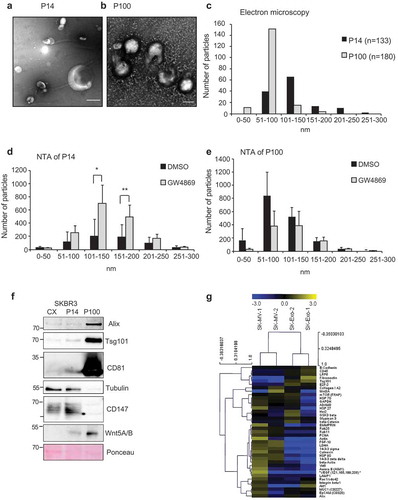
To determine whether in spite of the overlapping size distribution, these preparations contain detectably different EV populations, we compared the protein expression profile of P14 and P100 by Western blotting ()). Specific markers for Exo such as Alix, TSG101 and CD81 were found enriched in the P100, while tubulin was mainly detected in P14, similar to the previously described MV marker CD147 [Citation16]. Both fractions were positive for Wnt5A () and [Citation17, Citation18]). In addition, Digiwest [Citation19] multiplex Western blotting confirmed a clear separation for several protein markers in both fractions, such as CD147 and GAPDH for MV, and Tsg101, Alix for Exos. Other markers were shared or were more variable between both fractions such as Glypican 3 ()). These findings demonstrate that while the size of EVs in P14 and P100 overlap to a certain degree, due to sedimentation of some 100–200 nm EVs in both fractions, their protein composition differs according to their origin and separates well enough for some markers.
SMPD2 and 3 regulate the release of P14-EVs
GW4869 inhibits nSMases (SMPD2 and 3) that localise to different cellular compartments (Golgi, plasma membrane (PM), endosomes [Citation6]). In order to exclude that our observations are caused by non-specific effects of GW4869, we tested whether RNAi knockdown of SMPD2 and SMPD3 reproduces the observed effects on EV secretion. NTA of P14 and P100 from the supernatant of SMPD2, SMPD3 or double knockdown cells revealed a significant decrease in particle counts in P100, while in contrast the number of P14-EVs was increased (,)). In particular, in siRNA-treated cells the size range of larger EVs (>100 nm) in P14 and smaller EVs (<100 nm) in P100 were affected (,)), similar to the results observed with GW4869 (,)). In confirmation, flow cytometry analysis of double knockdown of SMPD2 and SMPD3 leads to a significant increase of P14-EVs (Supplementary Figure 3a). SiRNA were specific for particular SMPDs (Supplementary Figure 3b) and did not affect viability compared to control siRNA treated cells (Supplementary Figure 3c). In line with the results for the inhibition of nSMases, overexpression of SMPD2 or SMPD3 induced the opposite effect and decreased release of P14-EVs as measured by flow cytometry (,)). Taken together, these results recapitulate the effect of GW4869 and demonstrate that nSMases regulate the release of larger P14-EVs.
Figure 3. SMPD2 and 3 regulate the release of P14-EVs. Cells treated for 48 hours with siRNA were replated at equal concentrations in EV-free DMEM and EVs purified 24 hours later. Sets of two different siRNAs were used per gene (#1, #2) or combinations thereof for SMPD2&3 (#1, #2, see Material and Methods) (a) Relative concentration of P14-EVs by NTA quantification (n = 3) and (b) representative size distribution of P14-EVs from three biological replicates. (c) Relative concentration of P100-EVs determined by NTA quantification (n = 3) and (d) representative size distribution of P100-EVs from three biological replicates. Significance level: *** < 0.001, ** <0.01, * < 0.05. (e) P14-EVs from SMPD2/3 or control transfected Hek293 cells were measured for 30 seconds by flow cytometry and EVs normalized to control. n = 4 (f) Representative Western Blot of cell extract from SMPD2/3 or control transfected Hek293 cells.

Increased P14-EV originate from the plasma membrane
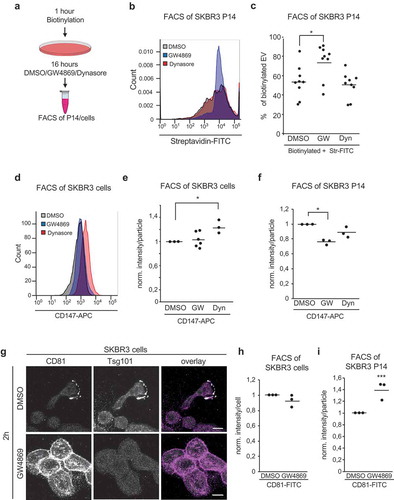
To obtain a more mechanistic insight into the role of SMPD2/3 activity in the biogenesis of different EV types, we hypothesised that either SMPD2/3 inhibition leads to an increase in Exo size resulting in their sedimentation at 14,000 g, or alteration of membrane composition by accumulation of SM induces increased budding of EVs from the plasma membrane. Surface-biotinylated SKBR3 cells were incubated with GW4869 or DMSO for 16 hours, then cells and P14-EVs were stained with Streptavidin-FITC and analysed by flow cytometry ()). This assay distinguishes biotinylated EVs, stemming from the plasma membrane, and unlabelled EVs from intracellular compartments. Overall biotinylated EV concentration increased two-fold in GW4869-P14, while the ratio of biotinylated to unbiotinylated increased from 0.5 to 0.75 in GW4869-P14 (,), Supplementary Figure 4a). Biotin labelling on the cell surface was comparable in DMSO and GW4869-treated samples (Supplementary Figure 4b). To test whether EV secretion from the plasma membrane is an unspecific reaction to GW4869 due to surface accumulation of EV membrane proteins, we used Dynasore to block endocytosis and thereby increase surface localisation of membrane proteins. This had no effect on secretion of biotinylated EVs in P14 ()). In order to understand how the processing of EVs from the PM is affected by GW4869, we analysed the EV membrane proteins, CD147 and CD9, for their surface level on cells by flow cytometry. DMSO and GW4869 treated cells showed comparable surface staining of these markers after 16 hours, in contrast to Dynasore, which increased CD147 and CD9 surface levels due to impaired endocytosis (,), Supplementary Figure 4c,d). Surprisingly, on P14-EVs GW4869 reduced the surface staining of CD147 ()), suggesting that an equal amount of CD147 is shed from the surface of DMSO and GW4869 cells, yet distributed on more EVs in the GW4869 condition compared to DMSO or Dynasore. In addition, exosomal marker CD81 was strongly increased on the surface of SKBR3 after two hours of GW4869 treatment ()). To investigate whether this increased surface level is mechanistically involved in the increased plasma membrane EV shedding, we knocked down CD81 by siRNA and analysed the number of P14-EV upon GW4869 treatment (Supplementary Figure 5a,b). Loss of CD81 did not block GW4869-induced EV release, thereby suggesting that it is not causing these effects. However, after 16 hours of GW4869 treatment the surface levels of CD81 were normalised to control levels and CD81 levels on P14-EV increased (,i)). Taken together, these results show that GW4869 increases budding of EVs from the plasma membrane, and specifically increases loading onto these EVs of some MV proteins.
Figure 4. Increase of EV originates from the plasma membrane. (a) Scheme of biotinylation flow cytometry assay. After biotinylation, cells were treated with DMSO, 5 µM GW4869, 80 µM Dynasore for 16 hours before FACS measurement of stained P14-EVs or cells. (b) Representative fluorescence blot of Streptavidin-FITC labeled P14 measured for 30 seconds. (c) Quantification of biotinylated P14-EVs from DMSO, 5 µM GW4869, 80 µM Dynasore treated cells. Unbiotinylated EVs were used as negative controls, as well as Ig-FITC labeled antibodies. n = 4 (d) Flow cytometry: Cell surface staining of CD147-APC, IgG-APC was used as control staining. (e) Quantification of cell surface staining of CD147-APC n = 3 (f) Quantification of P14 surface staining with CD147-APC n = 3 (g) CD81 and Tsg101 immunofluorescence labeling of SKBR3 cells treated with DMSO or GW4869 for 2 hours. (h) Quantification of cell surface staining and (i) P14-EV surface staining with CD81-FITC from DMSO and 5 µM GW4869 treated cells (16h) n = 3. Significance level: *** < 0.001, ** <0.01, * < 0.05.
Inhibition of ceramide formation alters export routes of Wnt proteins and metabolite composition of EVs
We next wanted to investigate in more detail how GW4869 alters the composition of EVs in P14 and P100. General morphology of EVs in P14 seems unaffected by GW4869 as observed by electron microscopy ()). Interestingly, the overall protein content of EVs normalised to the cell number remained the same ()), implying that the increased number of EVs in GW4869 samples carry less protein per EV. GW4869 treatment specifically altered the secretion routes of Wnt proteins, as Wnt5A and Wnt3A were increased in the P14 from GW4869-treated SKBR3 and L-cells, respectively (,), Supplementary Figure 5c,d). Equal numbers of EVs of P14 and P100 were analysed by Western blotting ()). The distribution of proteins in P14 and P100 is differentially influenced by GW4869: the exosomal marker Tsg101 on EV remained the same upon GW4869 exposure, while Alix, syntenin and CD81 levels were reduced in P100-EVs (,)). Digiwest [Citation19] multiplex Western blotting showed more protein variability between DMSO and GW4869 P14 ()). From these results we concluded that SMPD 2/3 inhibition specifically increases the secretion of certain proteins on P14-EVs and that these EVs have lower protein content per EV compared to DMSO P14-EVs. Next we analysed the effect of GW4869 on the composition of lipids and other metabolites of cells and EV. Mass spectrometric analysis was carried out on SKBR3 cells as well as the respective purified P14 and P100 fractions. The various runs were analysed regarding the m/z, retention time as well as the intensities and the isotopic patterns of the peaks.
Figure 5. Inhibition of ceramide formation alters cargo and metabolite composition of EV. (a) Electron microscopy of uranyl-acetate contrast-stained P14 preparations from DMSO- or GW4869-treated SKBR3 cells. Scale bar = 250 nm. (b) Total protein concentration of P14 and P100 samples. (n = 3) (c) densitometric quantification of Wnt5A from Supplementary Fig.5d. n = 3 (d) Western Blot analysis of equal amounts of P14 and P100 EV preparations and (e) densitometric quantification of Hsc70, CD81, CD147, Tsg101, Alix and syntenin n > 3. (f) Heat map of multiplex protein DigiWest analysis of SKBR3 P14 from DMSO or GW4869 treated cells in biological duplicates. (g-k) MS analysis of the abundance of ceramides of sphingomyelins in DMSO/GW4869-treated SKBR3 cells and P14-EV: (g) Unsaturated ceramides identified via their specific fragment ion 262.25 m/z, (h) saturated ceramides (fragment ion 264,26 m/z), (i) sphingomyelins (fragment ion 184,07), (j) Standardized normalized abundance of sphingomyelin in DMSO and GW4869 P14-EV (k) Principal component analysis of the whole dataset of metabolites from SKBR3 P14-and P100-EVs showing one representative of three identical experiments. The tightly clustered colored spots represent the four technical replicates of each EV subgroup: blue = P14 DMSO, purple = P14 + GW4869, orange = P100 DMSO, green = P100 + GW4869). Grey numbers indicate the metabolites. The metabolite marked in red as an example corresponds to the sphingomyelin with retention time 9.87 and m/z 765.5473. Significance level: *** < 0.001, ** <0.01, * < 0.05.
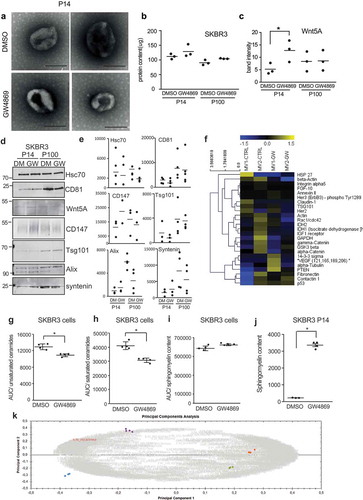
Since inhibition of nSMases by GW4869 antagonises the generation of ceramides from sphingomyelins, we were first interested in whether GW4869 would specifically alter the levels of these metabolites into the expected direction. This was analysed in SKBR3 cell lysates. Unsaturated as well as saturated ceramides were identified based on their characteristic fragment ions (m/z 262.25 and 264.26, respectively). There was a significant decrease in the amount of these ceramides upon GW4869 treatment (,h)). This was accompanied by a slight increase of sphingomyelins (fragment ion m/z 184.07) in the cells, still more pronounced and statistically significant in the corresponding P14 vesicles (,j)). In P100 there were no significant differences. Comparable results were achieved in L-cells (Supplementary Figure 5e,f). As a next step, we investigated the metabolite composition in SKBR3 P14 and P100. Principal component analysis (PCA) was performed on the whole dataset generated with the amide column to visualise the underlying data structure. The four investigated populations, P14 as well as P100, each ± GW4869, clustered separately. This indicated a clear difference both between DMSO and corresponding GW4869-treated EVs, as well as between P14 and P100 ()). In contrast, the respective four technical replicates within the four vesicle groups clustered tightly together, underlining the consistency of the runs.
Thus, both preparations contained EVs with a distinct metabolite profile and confirmed our previous findings that they represent two different EV populations, yet it indicates that treatment of cells with GW4869 differentially affects the protein and metabolite composition of these two EV populations.
Discussion
Lipid metabolism has been implicated in the dynamics of EV secretion [Citation11,Citation20,Citation21] although it is not fully clear how tightly lipids and EV subpopulations are interconnected. In this study we set out to determine the effects of nSMases on generation of larger EVs, such as MVs. We show that SMPD2 and SMPD3 differentially control the secretion of EVs. Using pharmacological and RNAi inhibition we found an increase in P14/MV compared to a reduction in P100/Exo secretion, while overexpression of SMPD2 or SMPD3 reduced plasma membrane P14-EV shedding.
Since differential centrifugation separates particles only according to their sedimentation coefficient, which can be altered for EVs by the lipid or protein composition, we categorised our samples according to the centrifugal force that was applied to purify them rather than calling them MVs and Exos. Several studies have recently defined more specific subpopulations of EVs by differential centrifugation, buoyant density and surface protein markers [Citation22,Citation23]. Interestingly, separation of medium and small EVs of similar buoyant density was possible by a previous differential centrifugation at 10,000 g and 100,000 g, while protein marker analysis revealed that only a portion of small EV pelleting at 100,000 g is endosomes derived [Citation22].
Based on our characterisation of size and protein content of both fractions under normal conditions we assumed that the majority of MVs and Exos are found in P14 and P100, respectively. Our experiments confirmed previously established knowledge about the ceramide-dependent Exo release [Citation11,Citation24] as shown by a drastic reduction in P100 upon small molecule inhibition of SMPD2/3. Surprisingly, GW4869 significantly increased the number of particles, which pelleted at 14,000 g, pinpointing to opposing effects of nSMase inhibition at different subcellular membranes and on different EV subpopulations. Accurate measurements of the heterogenous and polydispersed P14 samples by NTA are challenging [Citation25] and although NTA suggested that the P14 population affected by GW treatment has a size of around 100–200 nm, and therefore is close to the size of P100, we were able to confirm the effect of GW4869 by flow cytometry. Since flow cytometers can only measure particles with a size >200–300 nm, this indicates that also the secretion of larger EVs is affected.
Overexpression of SMPD2/3 and knockdown with siRNAs confirmed that nSmases regulate P14-EV release, showing that our results are not affected by small molecule-associated artefacts. A possible alternative explanation would be that lack of ceramide might render Exos heavier or larger causing them to pellet at lower centrifugal forces. This was refuted by biotinylation-based FACS measurements of P14 samples, which show that the increase of particles in P14 originated from the PM and thus are not related to MVB-derived Exos. Importantly, Exos vastly outnumber MVs, therefore a two-fold decrease in Exos and a two-fold increase in MVs result in a decreased number of total EVs, which further counteracts the idea of Exos becoming heavier and pelleting early.
Importantly, our results confirm that P14 and P100 EVs are distinct in their metabolite composition and that inhibition of SMPD2/3 results in the expected lipid changes. Namely, the levels of ceramides decrease in the presence of GW4869, whereas SM levels are increased in cells as well as MVs. This raises the question whether lack of SM hydrolysis at the plasma membrane is directly involved in the increased release of MVs or indirectly by triggering binding of other lipid-modifying enzymes and what mechanistically explains the different effects of GW4869 on PM and MVBs. Spontaneous curvature of the membrane depends on its major components [Citation26] and coupling of inner and outer lipid leaflets hinders membrane curvature and vesicle formation [Citation27]. Simulation of lipid leaflet coupling in asymmetric bilayers revealed that SM-induced coupling was stronger in the absence of cholesterol [Citation28]. It is conceivable that the different effects of SMPD2/3 inhibition observed at MVB compared to the plasma membrane depend on the different cholesterol concentrations in these membranes [Citation29]. Possibly, excess of SM in the cytoplasmic membrane leaflet might stimulate membrane curvature and vesicle formation at higher cholesterol levels at the plasma membrane, while it might be blocked at MVB membranes with lower cholesterol levels. Interestingly, electron microscopy of MCF-7 cells treated with 10 µM GW4869 did not show any obvious changes in plasma membrane morphology [Citation7], suggesting that increased EV shedding is not caused by loss of integrity or profound structural changes of the plasma membrane. However, detailed studies of membrane dynamics and lipid kinetics would be required to elucidate the underlying mechanism of increased EV release upon nSMase inhibition.
In a previous study it was shown that stimulation of the ionotropic ATP receptor P2X7 (P2X7R) activates aSMase and enhances MV shedding from the plasma membrane [Citation30]. Although our data seem contradictory since aSMase and nSMases catalyse the same reaction, that study focuses on the acute effects of ATP stimulation on short-term MV release (20 min after P2X7R activation) in glial cells, while our observations were made under basal conditions in non-stimulated epithelial cells after several hours of GW4869 treatment. Since we observed an increase in cellular, and especially P14 sphingomyelin levels with an accordingly significant decrease in ceramide levels, we have thus no evidence for a compensatory activation of the aSMase during GW4869 treatment in our epithelial cells, while the MV shedding described by Bianco et al. did not respond to GW4869 because it is specific for nSMases. While catalysing the same reaction of SM to ceramide, aSMase activity is present at the outer leaflet of the plasma membrane while nSMases are present at the cytoplasmic leaflet. Thus, the hydrolysis of SM to ceramide could lead to more or less EV released depending on the leaflet that is curved by SM to ceramide conversion. This fits with our observation that overexpression of nSMases leads to less and RNAi knockdown to more EVs secreted from the plasma membrane (,)).
These findings demonstrate hitherto unidentified effects of SMPD2/3 inhibition in human and mouse cells and are of high importance, especially since the use of GW4869 is a common practice in the field of EV research. Although selective inhibition of these enzymes is applied to block Exo release, our results show that cells respond by significantly increasing their MV release from the plasma membrane. However, only sorting of specific proteins onto plasma membrane-derived EVs is affected. This raises the question how nSMases mechanistically regulate EV budding and favour secretion of Wnts on P14-EVs. A previous study demonstrated that knockdown of Drosophila’s only ceramide synthase, and thereby a decrease in ceramide levels, impairs endocytic trafficking of Wingless [Citation31]. One possibility is that this defect might increase levels of Wnt at the plasma membrane where Wnts are found to be associated with lipid rafts [Citation32], specialised regions where viral and also MV budding can occur [Citation33,Citation34]. Sphingomyelin is known to cluster in lipid rafts and our results suggest that sphingomyelinases might be able to regulate EV budding from these rafts which could favour segregation of raft-associated proteins, such as Wnts, onto shedded EV. Several studies have shown that tetraspanins are important for the biogenesis and cargo selection of EVs [Citation35] and we also observed an obvious increase of CD81 on the cell surface after two hours of treatment with GW4869. Although CD81 has been suggested to regulate outward curvature of the cell membrane [Citation36], knockout of CD81 did not affect the size or number of Exos released in primary lymphoblast cultures [Citation37] and we also did not detect an effect of CD81 knockdown on the GW4869-induced EV budding; however, CD81 is a protein affected by GW4869 treatment and its release on EV is increased upon SMPD2/3 inhibition similar to Wnts (,i)).
In summary, we describe a novel connection between ceramide generation and EV biogenesis, where inhibition of Exo release by deactivating SMPD2/3 causes an enhanced secretion of MVs. Although these vesicles are the two most heavily studied subpopulations of EVs, their ceramide-driven interplay has not been reported before. Recent studies revealed that EV populations are heterogeneous and that more refined purification schemes are necessary to unravel their differences in size and sedimentation properties [Citation38]. This is underlined by our data indicating that the plasma membrane-derived P14 and P100 represent distinct populations regarding their protein and metabolite composition. Despite these differences, specific proteins, such as Wnts and CD81, are present on both vesicle types and their secretion onto P14-EV is favoured by inhibition of SMPD2/3. More experiments need to be conducted to elucidate whether this cargo shift is a general phenomenon and how the release of MVs and Exo is interconnected. Deregulated SMPD2/3 activity could thus shift the secretion of cargo from Exos to larger vesicles or vice versa.
Methods
Purification of MVs and Exos
MVs and Exos were isolated from fresh cell culture supernatant by differential centrifugation [Citation39] ()). In brief, after two steps at 750 and 1500 g to pellet cells and debris, the supernatant (SN) was centrifuged at 14,000 g for 35 min and the pellet (P14) washed in PBS. SN14 was centrifuged at 100,000 g for two hours and the pellet (P100) washed in PBS. EV concentration in SN1.5 or P14 and P100 were in general normalized to cell number. For example, the supernatant of 1 × 10⁶ cells was used for EV purification and concentration of P14 and P100 (resuspended in 100 μl PBS and stored short-term at −20°C) as measured by NTA or flow cytometry.
Cell culture
MDA-MB-231, SKBR3 and mouse L-(parental, Wnt3A or Wnt5A) cells were maintained in DMEM (Gibco) supplemented with 10% foetal calf serum (FCS, Biochrom) at 37°C in a humidified atmosphere with 5% CO2. Human cells were treated with DMSO or 5µM GW4869 (Sigma) for 16–24 hours in EV-free DMEM. Ev-free DMEM was obtained by ultracentrifugation of FCS diluted to 40% in DMEM at 4°C overnight at 100,000 g. The supernatant was then further diluted to 5% FCS with DMEM.
siRNA treatment and plasmid transfection
Human cells were transiently transfected with Screenfect siRNA (Incella) according to the manufacturer’s instructions. Cells were treated for 48 hours with siRNA, and then replated at equal concentrations in EV-free DMEM and EVs purified 24 hours later. Dharmacon siRNA SMARTpools were used for SMPD2 (6610) and SMPD3 (.55512), CD81 (975) and GL3 (D-001400-01-20). Combinations of siRNA used in the double knockdown experiments were:
#1: SMPD2#1+ SMPD3#1 or SMPD2#1+ SMPD3#2
#2: SMPD2#1+ SMPD3#2 or SMPD2#2+ SMPD3#2
Human Hek293 cells were transiently transfected with 1 µg SMPD2-myc and/or SMPD3-flag (C-Terminal myc- and flag destination plasmids (DKFZ – Genomics and Proteomics Core Facility)) and Screenfect A (Incella) according to the manufacturer’s instructions.
Quantitative real-time PCR with reverse transcription
Total RNA was extracted using an RNeasy extraction kit (Qiagen) according to the manufacturer’s instructions. Reverse transcription and quantitative PCR were carried out with 25 ng complementary DNA and LightCycler 480 Probes Master as described (Roche). Relative mRNA expression was calculated as a fold change versus control. Human primers were used against SMPD1, SMDP2, SMPD3, SMPD4 and GAPDH (human Universal Probe Library). Human quantitative PCR primers with probe number from Universal Probe Library.
Sequence information:
Antibodies
Goat anti-Alix (1:1000, St.Cruz), rabbit anti-CD147 (1:1000, #sc-13976, St.Cruz), mouse anti-GAPDH (1:2000, CB1001, Millipore) mouse anti-hsc70 (1:1000, St.Cruz), rabbit anti-SMPD2 (1:1000, HPA018125, Sigma Prestige), rabbit anti-SMPD3 (1:1000, #sc-67305, St.Cruz), rabbit anti-Tsg101 (1:1000, Sigma Prestige or 1:1000, #sc-7964, St. Cruz for Western blots), rabbit anti-syntenin (1:2000, Abcam #133267), mouse anti-Tubulin (1:5000, #05–829, Millipore), rat anti-Wnt5A (1:2000, #MAB645, R&D), mouse anti-CD81 and CD81-FITC (WB: 1:1000, FACS: 1:500 Biolegends), mouse anti-CD9-APC, mouse anti-CD147-APC, Streptavidin-FITC, mouse IgG-FITC, IgG-APC (all 1: 500, Immunotools), secondary rat, rabbit and mouse HRP (1:5000, #sc-2004, #sc-2005, #sc-2006, St.Cruz).
Flow cytometry
Cells were cultivated in EV-free DMEM and inhibitors overnight, then supernatant was harvested and EVs purified by differential centrifugation, SN1.5 or P14 were stained with appropriate antibodies and measured at the FACS BD Canto II for 30 seconds at FSC 291 V and SSC 413 V, FITC 524 V and APC 616 V. Cells were trypsinized and stained with appropriate antibodies and measured at the FACS BD Canto II for 10,000 events at FSC 220 V and SSC 407 V, FITC 341 V and APC 450 V.
Nanosight measurements
Nanoparticle tracking (NTA) experiments were performed using a Nanosight LM10 (Malvern) instrument. P14 and P100 samples were diluted between 8- and 100-fold in PBS to obtain the optimal measurement concentrations of 5–15*108 particles/ml. We used consistent settings with 30 seconds of measurement time at medium polydispersity and reproducibility under a level of illumination of 15 (LM10 software) and measured 400 µl three consecutive rounds of 30 seconds. For P100 and P14 particles up to 500 nm and 1000 nm were used in calculations, respectively, and the rest of the registered particles (<1% in all cases) were taken out. EV concentration was calculated by using and size bin analysis performed by using 10 bins of 50 nm each until 90% of all EVs were covered. P14 of the same samples were also measured via FACS using antibodies against CD147 and CD9.
Western blotting
Cells were scraped in RIPA lysis buffer (150 mM NaCl, 0.1% SDS, 0.5% sodium deoxycholate, 1% Triton X-100, 50nM Tris, pH 7.2) plus Roche complete protease inhibitor. After centrifugation at 16,000x g for 10 minutes at 4°C, samples were mixed with SDS-6x sample buffer and loaded on SDS-PAGE gel, transferred to nitrocellulose membranes, and immunoblotted with primary antibodies followed by HRP-conjugated secondary antibodies and detected with ECLPrime (GE Healthcare Life sciences) on the LAS-4000 imaging system (Fujifilm). Densitometric quantification was performed with the ImageJ software version 1.48. Ponceau staining or GAPDH was used as loading control.
Digiwest analysis
For high content Western analysis, the DigiWest procedure was performed as described in [Citation19]. In brief, extracellular vesicle protein extracts (13.8 μg per sample) were separated using 4–12% Bis-Tris gels (Life TechnologiesTM) according to the manufacturer’s instructions and blotted onto PVDF membranes (Millipore) under standard conditions. Proteins immobilised on the blotting membrane were biotinylated (NHS-PEG12-Biotin, Thermo Scientific) and individual sample lanes were cut into 96 strips each (height 0.5 mm each, strip width 7.5 mm). Form each individual strip, protein was eluted in a 96 well and subsequently transferred to a specific colour-coded Neutravidin-coated Luminex bead set (20,000 beads/well) assigning one particular colour to specific membrane strip during overnight incubation. In total 384 different colours were used (4x96 strips). After incubation, the Luminex beads were pooled, washed and transferred into storage buffer. For antibody incubation, an aliquot of the bead pool was transferred into an assay plate and 30 μl of diluted Western blot antibody in assay buffer was added per well; 77 antibody incubations on four samples were performed over night at 4°C. For read-out, beads were washed twice with PBST before species-specific PE-labelled secondary antibody (Jackson) were added in 30 μl of assay buffer for one hour. After washing in PBST signal was generated in a FlexMAP 3D instrument (Luminex).
Data analysis. Data generated by the Luminex instrument were analysed using a dedicated analysis tool that visualises the fluorescent signals as bar graphs and identifies antibody specific peaks. Each graph is composed of the 96 values derived from the 96 molecular weight fractions obtained after antibody incubation. The software tool identifies specific peaks and a molecular weight is assigned to each of the 96 fractions. After background correction, specific signal intensities are calculated as the integral of the identified peak.
Electron microscopy
Purified EVs were left to settle on carbon-coated grids. After staining with 3% uranyl acetate, grids were air-dried and visualised at 30,000x using a transmission electron microscope (Zeiss EM900). Representative images from three biological replicates of P14 and P100 from DMSO or GW4869 treated SKBR3 cells were obtained. Particle size was determined compared to a size marker in Fiji.
Mass spectrometry
The UPLC-MS analysis was performed on an Acquity UPLC® I-Class (Waters, MA, USA) coupled to a Xevo G2S (Waters, MA USA) equipped with an electrospray ionisation (ESI) ion source. The chromatographic separation of the samples was performed on an Acquity UPLC® BEH Amide 1.7 µm 2.1 x 100 mm Column (Waters). The compositions of the mobile phase A and B were 20 mM ammonium formate, 0.1% formic acid, 5% acetonitrile (A) and acetonitrile (B); 2 µl of the sample was injected. Phase B was initially at 95%, then linearly decreased to 35% over 50 minutes and maintained at 35% for five minutes with the flow rate 0.1 ml/min. The column was equilibrated for five minutes and the column temperature was set to 35 °C. All compounds were analysed in a positive ion polarity mode with capillary voltage of 3.0 kV and source temperature of 120 °C. The mass range was set from m/z 50 to 1200. For each setting, 3–4 technical and 3 biological replicates were performed. Alignment of the spectra and peak picking were processed using the Progenesis QI software (Non-linear Dynamics, UK) and the remaining ions were used for further data processing. To visualise the structure of the dataset principal component analysis (PCA) was performed.
Immunofluorescence/confocal microscopy
Cells were fixed with 4% paraformaldehyde in PBS for 10 minutes, permeabilized with 0.1% Triton X-100 in PBS for five minutes, blocked 30 minutes with 5% BSA in PBS before incubation with primary antibodies, followed by Alexa Fluor-conjugated 488, 568 and 647 secondary antibodies (Invitrogen) and DAPI. Samples were analysed with a Zeiss LSM780 and images processes with Fiji.
Statistical analysis
All experiments were carried out at least in biological triplicates. Statistical significance was calculated by Student’s t -test.
Acknowledgments
The help of the Electron microscopy Core Facility, Department of Pathology, and Cellnetworks Cluster of Excellence, Heidelberg University, is gratefully acknowledged. We would like to thank Mona Honemann-Capito for expert technical help. K.M. was supported by a DFG research fellowship (ME 4573/1-1), J.G. by a Cellnetworks postdoctoral fellowship and work in the Gross lab by a DFG research grant (GR4820/2-1).
Disclosure statement
G.E. is an employee of NMI TT Pharmaservices, which provides commercial DigiWest services. The remaining authors declare no potential conflict of interest.
Related Research Data
References
- Yanez-Mo M, Siljander PR, Andreu Z, et al. Biological properties of extracellular vesicles and their physiological functions. J Extracell Vesicles. 2015;4:1.
- Zomer A, Maynard C, Verweij FJ, et al. In Vivo imaging reveals extracellular vesicle-mediated phenocopying of metastatic behavior. Cell. 2015;161(5):1046–14.
- Hoshino A, Costa-Silva B, Shen TL, et al. Tumour exosome integrins determine organotropic metastasis. Nature. 2015;527(7578):329–335.
- Colombo M, Raposo G, Théry C. Biogenesis, secretion, and intercellular interactions of exosomes and other extracellular vesicles. Annu Rev Cell Dev Biol. 2014;30:255–289.
- Canals D, Perry DM, Jenkins RW, et al. Drug targeting of sphingolipid metabolism: sphingomyelinases and ceramidases. Br J Pharmacol. 2011;163(4):694–712.
- Milhas D, Clarke CJ, Idkowiak-Baldys J, et al. Anterograde and retrograde transport of neutral sphingomyelinase-2 between the Golgi and the plasma membrane. Biochim Biophys Acta. 2010;1801(12):1361–1374.
- Luberto C, Hassler DF, Signorelli P, et al. Inhibition of tumor necrosis factor-induced cell death in MCF7 by a novel inhibitor of neutral sphingomyelinase. J Biol Chem. 2002;277(43):41128–41139.
- Peng C-H, Huang C-N, Hsu S-P, et al. Penta-acetyl geniposide induce apoptosis in C6 glioma cells by modulating the activation of neutral sphingomyelinase-induced p75 nerve growth factor receptor and protein kinase Cdelta pathway. Mol Pharmacol. 2006;70(3):997–1004.
- Cogolludo A, Moreno L, Frazziano G, et al. Activation of neutral sphingomyelinase is involved in acute hypoxic pulmonary vasoconstriction. Cardiovasc Res. 2009;82(2):296–302.
- Sitrin RG, Sassanella TM, Petty HR. An obligate role for membrane-associated neutral sphingomyelinase activity in orienting chemotactic migration of human neutrophils. Am J Respir Cell Mol Biol. 2011;44(2):205–212.
- Trajkovic K, Hsu C, Chiantia S, et al. Ceramide triggers budding of exosome vesicles into multivesicular endosomes. Science. 2008;319(5867):1244–1247.
- Chairoungdua A, Smith DL, Pochard P, et al. Exosome release of beta-catenin: a novel mechanism that antagonizes Wnt signaling. J Cell Biol. 2010;190(6):1079–1091.
- Ohshima K, Kanto K, Hatakeyama K, et al. Exosome-mediated extracellular release of polyadenylate-binding protein 1 in human metastatic duodenal cancer cells. Proteomics. 2014;14(20):2297–2306.
- Essandoh K, Yang L, Wang X, et al. Blockade of exosome generation with GW4869 dampens the sepsis-induced inflammation and cardiac dysfunction. Biochim Biophys Acta. 2015;1852(11):2362–2371.
- Jeppesen DK, Hvam ML, Primdahl-Bengtson B, et al. Comparative analysis of discrete exosome fractions obtained by differential centrifugation. J Extracell Vesicles. 2014;3:25011.
- Menck K, Scharf C, Bleckmann A, et al. Tumor-derived microvesicles mediate human breast cancer invasion through differentially glycosylated EMMPRIN. J Mol Cell Biol. 2015;7(2):143–153.
- Menck K, Klemm F, Gross JC, et al. Induction and transport of Wnt 5a during macrophage-induced malignant invasion is mediated by two types of extracellular vesicles. Oncotarget. 2013;4(11):2057–2066.
- Gross JC, Chaudhary V, Bartscherer K, Boutros M. Active wnt proteins are secreted on exosomes. Nat Cell Biol. 2012;14(10):1036–1045. doi:10.1038/ncb2574.
- Treindl F, Ruprecht B, Beiter Y, et al. A bead-based western for high-throughput cellular signal transduction analyses. Nat Commun. 2016;7:12852.
- Subra C, Laulagnier K, Perret B, et al. Exosome lipidomics unravels lipid sorting at the level of multivesicular bodies. Biochimie. 2007;89(2):205–212.
- Wolf JM, Espadas J, Luque-Garcia J, et al. Lipid biosynthetic genes affect Candida albicans extracellular vesicle morphology, cargo, and immunostimulatory properties. Eukaryot Cell. 2015;14(8):745–754.
- Kowal J, Arras G, Colombo M, et al. Proteomic comparison defines novel markers to characterize heterogeneous populations of extracellular vesicle subtypes. Proc Natl Acad Sci U S A. 2016;113(8):E968–77.
- Gabrielli M, Battista N, Riganti L, et al. Active endocannabinoids are secreted on extracellular membrane vesicles. EMBO Rep. 2015;16(2):213–220.
- Guo BB, Bellingham SA, Hill AF. The neutral sphingomyelinase pathway regulates packaging of the prion protein into exosomes. J Biol Chem. 2015;290(6):3455–3467.
- Gardiner C, Ferreira YJ, Dragovic RA, et al. Extracellular vesicle sizing and enumeration by nanoparticle tracking analysis. J Extracell Vesicles. 2013;2: 19671.
- Shlomovitz R, Schick M. Model of a raft in both leaves of an asymmetric lipid bilayer. Biophys J. 2013;105(6):1406–1413.
- Tanasescu R, Lanz MA, Mueller D, et al. Vesicle origami and the influence of cholesterol on lipid packing. Langmuir. 2016;32(19):4896–4903.
- Róg T, Orłowski A, Llorente A, et al. Interdigitation of long-chain sphingomyelin induces coupling of membrane leaflets in a cholesterol dependent manner. Biochim Biophys Acta. 2016;1858(2):281–288.
- van Meer G, Voelker DR, Feigenson GW. Membrane lipids: where they are and how they behave. Nat Rev Mol Cell Bio. 2008;9(2):112–124.
- Bianco F, Perrotta C, Novellino L, et al. Acid sphingomyelinase activity triggers microparticle release from glial cells. EMBO J. 2009;28(8):1043–1054.
- Pepperl J, Reim G, Lüthi U, et al. Sphingolipid depletion impairs endocytic traffic and inhibits Wingless signaling. Mech Dev. 2013;130(9–10):493–505.
- Zhai L, Chaturvedi D, Cumberledge S. Drosophila wnt-1 undergoes a hydrophobic modification and is targeted to lipid rafts, a process that requires porcupine. J Biol Chem. 2004;279(32):33220–33227.
- Chazal N, Gerlier D. Virus entry, assembly, budding, and membrane rafts. Microbiol Mol Biol Rev. 2003;67(2): 226–237, table of contents.
- Del Conde I, Shrimpton CN, Thiagarajan P, et al. Tissue-factor-bearing microvesicles arise from lipid rafts and fuse with activated platelets to initiate coagulation. Blood. 2005;106(5):1604–1611.
- Andreu Z, Yanez-Mo M. Tetraspanins in extracellular vesicle formation and function. Front Immunol. 2014;5:442.
- Bari R, Guo Q, Xia B, et al. Tetraspanins regulate the protrusive activities of cell membrane. Biochem Biophys Res Commun. 2011;415(4):619–626.
- Perez-Hernandez D, Gutierrez-Vazquez C, Jorge I, et al. The intracellular interactome of tetraspanin-enriched microdomains reveals their function as sorting machineries toward exosomes. J Biol Chem. 2013;288(17):11649–11661.
- Willms E, Johansson HJ, Mager I, et al. Cells release subpopulations of exosomes with distinct molecular and biological properties. Sci Rep. 2016;6:22519.
- Glaeser K, Boutros M, Gross JC. Biochemical methods to analyze Wnt protein secretion. Methods Mol Biol. 2016;1481:17–28.