
ABSTRACT
Cancer cells release extracellular vesicles (EVs) that contain functional biomolecules such as RNA and proteins. EVs are transferred to recipient cancer cells and can promote tumour progression and therapy resistance. Through RNAi screening, we identified a novel EV uptake mechanism involving a triple interaction between the chemokine receptor CCR8 on the cells, glycans exposed on EVs and the soluble ligand CCL18. This ligand acts as bridging molecule, connecting EVs to cancer cells. We show that glioblastoma EVs promote cell proliferation and resistance to the alkylating agent temozolomide (TMZ). Using in vitro and in vivo stem-like glioblastoma models, we demonstrate that EV-induced phenotypes are neutralised by a small molecule CCR8 inhibitor, R243. Interference with chemokine receptors may offer therapeutic opportunities against EV-mediated cross-talk in glioblastoma.
Introduction
Extracellular vesicles (EVs), including exosomes and shed microvesicles, are membranous vesicles released by most, if not all, cell types. EVs contain active molecules such as proteins, lipids and nucleic acids, that can exert biological functions once taken up by recipient cells. EV-mediated communication is considered to be of particular importance in tumour progression and therapy resistance. For several cancer types, it was demonstrated that migratory and metastatic potential can be phenocopied from one cell to another by EVs [Citation1–Citation6], and that tumour growth is enhanced by EVs in many cancer types, including glioblastoma (GBM) [Citation7–Citation10]. EVs are involved in many aspects of the communication between tumours and their microenvironment, such as cell migration and homing, EV-mediated propagation of GBM heterogeneity and MGMT promotor methylation status-dependent TMZ resistance [Citation11–Citation14]. Tumour EVs also exert a protective effect against several chemotherapeutic agents by delivering a variety of resistance-inducing molecules such as P-glycoprotein (P-gp), TrpC5 and non-coding RNAs [Citation15–Citation19].
Despite a possible therapeutic potential of blocking EV uptake in cancer, this approach is not extensively exploited owing to the scarce knowledge of EV uptake mechanisms. EV uptake is considered to depend on the EV donor and recipient cell type, their physiological state, and the presence or absence of interfering molecules in the extracellular microenvironment [Citation20–Citation22]. Although direct fusion of EVs and plasma membranes has been reported for melanoma cells [Citation23], multiple studies point to interactions involving endocytic pathways. EV uptake is inhibited at 4°C, indicating an active, energy-dependent process [Citation24–Citation26]. Proteinase K treatment of either recipient cells or EVs strongly reduces EV uptake in several cell types, implying a role of membrane proteins in the internalisation process [Citation26–Citation28]. Co-localisation studies and assays employing pathway-specific inhibitors revealed involvement of both clathrin-dependent and clathrin-independent endocytosis, including caveolin-mediated endocytosis, macropinocytosis and phagocytosis [Citation22]. These observations seem compatible with receptor-mediated EV uptake mechanisms, similar as for many enveloped viruses [Citation29,Citation30]. To date only few specific cellular receptors for EVs have been proposed. In an early study, Tim1 and Tim2 receptors were proposed to bind phosphatidylserine exposed on EV membranes of pre-B cells overexpressing these receptors [Citation31]. Integrins have also been shown to act as EV receptors by binding lysophosphatidic acid from the EV surface [Citation32]. Furthermore, heparan sulphate proteoglycans (HSPGs) on the plasma membrane were reported to function as EV receptors, in a mechanism in which fibronectin acts as a bridging molecule that interacts with both cellular and exosomal HSPGs [Citation33,Citation34].
GBM is the most common primary malignant tumour of the central nervous system in adults and known to release large amounts of EVs [Citation10,Citation35,Citation36]. Affected patients have an extremely poor prognosis with a median survival of only 15 months following treatment [Citation37]. Standard of care currently consists of tumour resection combined with radiotherapy and concomitant and adjuvant chemotherapy with the alkylating agent temozolomide (TMZ). Although tumours may initially respond to this regimen, recurrences are inevitable and occur even while patients are still receiving adjuvant TMZ [Citation38]. Here, we show that GBM EVs are inducers of cell proliferation and are capable of triggering TMZ resistance in recipient GBM cells. Using RNAi screening, we identified the chemokine (C-C motif) receptor 8 (CCR8) as a receptor for EVs. CCR8 is known to be expressed by T-helper 2 lymphocytes, natural killer cells, and monocytes. In the central nervous system (CNS), CCR8 expression is associated with phagocytic macrophages and activated microglial cells [Citation39]. We demonstrate that CCR8 is also expressed on tumour cells and this CCR8 allows binding and entry of EVs via interaction of EV-bound glycans with the chemokine (C-C motif) ligand 18 (CCL18).
Materials and methods
Animal models
Animal experiments were performed in accordance with the European Community Council Directive 2010/63/EU. The experimental protocol was validated and approved by the local committee on animal experimentation of the VU University medical centre or The Netherlands Cancer Institute. Athymic Nude-Fox1nu mice were purchased from Harlan/Envigo (Horst, The Netherlands). They were kept under filter top conditions and received food and water ad libitum.
Antibodies and chemicals
MC148 was purchased from B-Bridge international and was dissolved in PBS. R243 was custom synthesised by MercaChem (Nijmegen, The Netherlands) and was dissolved in dimethyl-sulphoxide (DMSO). Temozolomide (dissolved in DMSO), 4′,6-diamidino-2-phenylindole (DAPI), Dynasore, heparin, heparinase III, Dynasore and PKH67 were obtained from Sigma. BrdU was from Life Technologies, and recombinant CCL18 and human Epidermal Growth Factor (hEGF) were from R&D. Basic-Fibroblast Growth Factor (b-FGF) was purchased from PeproTech. The antibodies used in this work were obtained from the following manufacturers: mouse anti-CD63 (Clone NKI/C3) from Fisher Scientific. Mouse anti-Alix and mouse anti-β-Actin were purchased from Santa Cruz. Mouse anti-Cre and gold-conjugated rabbit anti-goat were from Sigma. Rabbit anti-BrdU from Rockland. Rabbit anti-CCR8 and rabbit anti-GFP from Abcam. Goat anti-CCL18 from Origene. Rabbit anti phospho-ERK (Phospho-p44/42 MAPK (Erk1/2) (Thr202/Tyr204)) from Cell Signaling. HRP-conjugated goat anti-mouse, HRP-conjugated goat anti-rabbit and HRP-conjugated rabbit anti-goat used as secondary antibodies in Western blots were from Dako. IRDYE 800CW mouse anti-rabbit and IRDYE® 680RD goat anti-mouse also employed for Western blot were from Li-Cor. Alexa Fluor 405 and goat anti-rabbit Alexa Fluor 594 from Life Technologies. Protein A-gold (purchased from Cell Microscopy Core, University Medical Center Utrecht), goat-anti-biotin-Gold (Aureon). Phage display antibodies (kindly provided by Van Kuppevelt, Nijmegen) to detect three types of glycosaminoglycans: VSV-tagged anti-heparan sulphate (HS4E4), VSV-tagged anti-chondroitin sulphate (1O3H10) and VSV-tagged anti-dermatan sulphate (GD3A12).
Cell culture, EV isolation and PKH67 staining
HEK-293T, U87 and U251 cells were cultured in DMEM (Sigma) supplemented with 10% FBS and 0.5 mg/mL Penicillin/Streptomycin (both from Gibco). GBM8 cells were cultured in Neurobasal-A medium supplemented with GlutaMax, B27, N2 (all from Gibco), 2 µg/mL heparin, 20 ng/mL hEGF and 20 ng/mL basic-FGF. All cells were maintained at 37°C/5% carbon dioxide.
For EV isolation, exponentially growing cells were cultured in EV-depleted medium, for 48 h in T175 culture flasks. GBM8 medium does not contain any source of exogenous EVs and is therefore considered as EV-free medium. Supernatant, containing secreted EVs, was collected and subjected to differential centrifugation as described previously [Citation40]. Briefly, conditioned medium was cleared of cells, cellular debris and larger vesicles by spinning at 500 g for 10 min, 2000 g for 15 min and 10,000 g for 30 min, each step twice. Finally, EVs were pelleted by centrifugation in a Beckman Coulter L-90K ultracentrifuge at 70,000 g for 1 h, washed with 1x cold PBS and pelleted again at 70,000 g for 1 h. The resulting pellet was resuspended in PBS, and EV concentration was estimated by determining total protein content of the samples by BCA Assay (Bio-Rad). When indicated, EV isolates were stained with the lipid dye PKH67 following manufacturer’s instructions and washed extensively with PBS before re-pelleting at 70,000 g for 1 h.
EV uptake analysis
For EV uptake experiments, subconfluent cell cultures were incubated with 10 ng/µL of PKH67-labelled EVs (if not stated otherwise). When indicated, cells or EVs were treated with recombinant CCL18, anti-CCL18 neutralising antibody, heparin, MC148 or R243 for 1 h before EV addition. After overnight incubation with labelled EVs, cells were washed with PBS before fluorescence analysis. PKH67+ cells were either directly quantified in a Leica DM6000 microscope or analysed by flow cytometry. As GBM8 medium contains heparin, GBM8 uptake experiments were conducted in heparin-reduced medium (0.2 µg/mL).
Western blot analysis
For Western blot analysis on p-ERK, cells 5 × 10⁵ cells were seeded in 24-well plates and isolated EVs (or PBS in the control wells) were added at a final concentration of 100 ng/µL at the moment of seeding and once more 18 h later. At 12 h after second EV addition, the cells were harvested, washed with PBS and lysed in RIPA buffer (150 mM NaCl, 50 mM Tris-HCl (pH 8.0), 1% NP-40, 0.5% deoxycholate, 0.1% SDS) supplemented with Protease Inhibitor Cocktail (Roche Applied Sciences). For Alix, CD63, CCL18 or CD9 analysis, 40 µg of EVs were lysed in RIPA buffer supplemented with protease inhibitor cocktail. After lysis, cell or EV samples, or supernatant of the last centrifugation step (negative control) were loaded in SDS-PAGE gels using NuPAGE® Novex 4–12% Bis-Tris 1.0 mm gel (Life Technologies) and the NuPAGE® system from Life Technologies and were transferred onto 0.45 µm pore-Immobilon-P PVDF Membrane (Millipore). After blotting, membranes were blocked for 30 min in 5% milk (Campina) for CD9, CCL18, Alix and CD63 analyses and in Rockland Blocking Buffer (Rockland) for phospho-ERK and β-Actin and incubated overnight with primary antibodies (diluted in blocking buffer) at 4°C. After three washes with Tris-Buffered Saline + 0.1% Tween (TBS-T), membranes were incubated with secondary antibodies (diluted in blocking buffer) for 1.5 h and washed again three times with TBS-T before being developed using Amersham ECL Plus Western Blotting Detection System (GE Healthcare) (CD9, CCL-18, Alix and CD63) or scanned in a LI-COR Odyssey scanner (Biosciences) according to the manufacturers’ instructions (phospho-ERK and β-actin).
Transmission electron microscopy
GBM8 EVs were diluted 1:1 with PBS and coated for a minimum of 10 min on Formfar coated copper grids (Electron Microscopy Sciences (EMS)). For the analysis of size distribution, grids were washed five times after coating, fixed in 1% glutaraldehyde (EMS) and incubated in 0.5% uranyl acetate (SPI Supplies)/2% methyl cellulose (SIGMA). A total of nine images (three images per grid from three separate grids) were acquired using a transmission electron microscope (Philips CM100 Bio Twin), connected to a CCD camera (Olympus, Morada G2) and analysed in iTEM version 5.2 software. Diameters of all EVs found on these images were measured in iTEM, resulting in a total of 944 measurements. For immuno-gold stainings, grids were coated with EVs 1:1 diluted in PBS, washed five times with PBS supplemented with 1% BSA (PBA), blocked for 5 min in PBA and 10 min in a commercial blocking reagent (Aureon) or 10% rabbit serum (obtained from the Animal facility VU University medical centre). After a minimum of 30 min incubation with primary antibodies, grids were washed again five times with PBA before incubation for 20 min with secondary reagents. Lastly, grids were washed, fixed in 1% glutaraldehyde and incubated in 0.5% uranyl acetate/2% methyl cellulose before imaging. Image acquisition was performed using a transmission electron microscope connected to a CCD camera and iTEM software.
EV interaction analysis
For EV interaction experiments, subconfluent cultures were incubated with 10 ng/µL of PKH67-labelled EVs (if not stated otherwise) for 18 h. Although it is firmly established that uptake of EVs is rapid, and becomes saturated at 2–3 after incubation, we have incubated overnight (18 h), because we were not only interested in EV binding, but also in subsequent processes such as internalisation, accumulation and cellular distribution where interference could potentially prevent EV function. When indicated, cells or EVs were treated with recombinant CCL18, anti-CCL18 neutralising antibody, rCCL1, rCCL17, heparin (25 µg/mL), heparinase III, MC148 or R243 (20 µM unless indicated otherwise) for 1 h before EV addition, except for heparinase III, treatment (2 miU every 2 h for 6 h at 37°C). After overnight incubation with labelled EVs, cells were washed with PBS before fluorescence analysis. PKH67+ cells were either directly quantified in a Leica DM6000 microscope or analysed by flow cytometry. As GBM8 medium contains heparin, GBM8 uptake experiments were conducted in heparin-reduced medium (0.2 µg/mL).
siRNA validation transfection
For siRNA screening validation of the Top-8 EV uptake-inhibiting GPCRs, new siRNAs against them were obtained from another manufacturer (Qiagen FlexiTube siRNAS: PTGIR_1: SI00019250, C5R1_1: SI00027412, TRAR3_1 (TAAR9): SI00159208, ADORA2A_1: SI00013874, MRGX2_1: SI00147994, CXCL3_1: SI00032662, CCR8_7: SI03027843, GPR172B_1: SI00120295). siRNAs were transfected in HEK-293T cells with Lipofectamine 2000 following manufacturer’s instructions. Efficient mRNA knock-down of target genes was verified by quantitative real-time PCR (data not shown). siRNA screening results were also validated in GBM8 cells by electroporation of Qiagen’s siRNAs with a microporator MP-100 (Digital Bio, Seoul, South Korea) following manufacturer’s instructions with a single pulse of 1400 V for 40 ms. At 48 h after transfection, HEK-293T and GBM8 cells were incubated overnight with 20 ng/µL of PKH67-labelled EVs, washed twice with PBS and subjected to fluorescent EV uptake analysis. As a control for EV uptake inhibition in GBM8 cells, siRNA control cells were treated with Dynasore (80 µM) – a Dynamin2 inhibitor know to impair EV uptake [Citation22] – for 30 min before incubation with labelled EVs.
RNA isolation and RT-PCR
A total of 5 × 10⁵ cells or 40 µg of EVs were lysed in lysis/binding buffer, and RNA was isolated using the total RNA extraction protocol from the MirVana kit (Ambion) following manufacturer’s indications. After isolation, RNA integrity and concentration were determined on an Agilent 2100 Bioanalyzer using Agilent Small RNA kit (Agilent Technologies, Germany), concentration of the samples was adjusted to the minimum concentration of the samples analysed and cDNA was synthesised using Omniscript RT kit for RNA samples above 50 ng or with Sensiscript RT kit when RT reactions contained less than 50 ng (both kits were from Qiagen) following manufacturer’s instructions.
Small RNA sequencing and data analysis
The RNA quality from GBM cell lines and matched EVs was analysed on Agilent 2100 Bioanalyzer using Agilent Small RNA kit (Agilent Technologies, Germany). Maximum sample input (6 µL) was prepared for sequencing using the Illumina TruSeq small RNA Preparation Kit according to the manufacturer (Illumina). RNAseq was performed on a HiSeq 2500 (Illumina) pair-end 125 nucleotide length read, using equimolar amounts for each sample. Sequencing reads analysis was performed by using the sRNAbench analysis package as described previously [Citation41]. Briefly after adaptor trimming and unique reads grouping, reads were aligned to the human genome (UCSC hg19) using the Bowtie 1.1.2. To provide annotations for RNA elements that mapped to human genome, several databases were used, including miRBase (version 21) for mature and pre-miRNA sequences and NCBI Reference Sequences (RefSeq Release 69, 2 January 2015). Apart from the main sRNAbench programme, a differential expression module based on edgeR (Robinson et al., 2010) was used to generate an expression matrix of all miRNAs detected. Note that by using edgeR, sRNAbench applies implicitly TMM normalisation in the detection of differentially expressed small RNAs, which was reported to be among the most stable methods [Citation42,Citation43].
Relative cell number quantifications
Relative number of cells in GBM8 spheres was estimated by calculating GBM8 sphere volumes, assuming the volume of a neurosphere to be proportional to the number of cells comprising it. When seeded at low density in round-bottom, cell-repellent 96-well plates (Greiner Bio-One), GBM8 cells form a single, nearly perfectly spherical neurosphere. Using a Leica DM 3000B motorised microscope equipped with a Pulnix JAI RMC-1327GE camera, pictures of individual spheres were taken. Moreover, the area covered by the sphere was calculated using ImageJ software. Radius of the sphere was calculated as the square root of the area divided by Pi, and relative sphere volume was calculated by taking four thirds of Pi multiplied by the third power of the calculated radius. When stated, R243 and/or TMZ (20 µM or otherwise indicated concentrations) were directly added to the culture medium immediately after seeding the cells. EVs were added at a final concentration of 100 ng/µL once 30 min after drug treatments and again 24 h later. Spheres were measured between 5 and 7 days after treatments. IC50 value determination for R243 on GBM8 cells, as well as TMZ/R243 combination studies were performed using CellTiter-Glo kit (Promega), and GBM-FM relative cell numbers in ) were estimated by luciferase assay (Promega). Both assays were performed following manufacturer’s recommendations.
Figure 1. GBM cells can exchange functional RNA via EVs. (a) EM image of GBM8 EVs isolated by differential centrifugation (scale bar: 100 nm). (b) Western blot analysis of EV markers CD63, Alix and CD9 on EVs isolated from GBM8 cells. Control: Supernatant from the 70,000 x g centrifugation step. (c) GBM8 cells incubated overnight with PKH67-labelled GBM8 EVs. Arrows indicate PKH67+ cells which have taken up EVs (scale bar: 10 µm). (d) GBM8 cells incubated with 100 ng/µL of isolated EVs show enlarged neurospheres (right picture) as compared with cells incubated with control supernatant from the last centrifugation step (left picture) (scale bars: 100 µm). (e) Luciferase assay on GBM8-FM cells incubated with increasing concentrations of isolated EVs indicates dose-dependent increase in cell number. The graphs show the means ± standard deviation (SD) of three independent experiments. ***indicates p-value ≤0.001 and **** indicates p-value ≤0.0001 as determined by one-way analysis of variance (ANOVA). (f) BrdU incorporation assay reveals increased proliferation rate in cells incubated with 100 ng/µL as compared to control-incubated cells. The graph shows the mean ± standard deviation (SD) of two independent experiments. * indicates p-value ≤0.05 (t-test) (g) Western blot analysis of phospho-ERK on cells incubated as in (f), β-actin was used as a loading control. Numbers above blot represent relative phospho-ERK band intensities. (h) GBM8 spheres were treated with TMZ for 96 h in the presence or absence of 100 ng/µL of GBM8-isolated EVs, and relative cell numbers were estimated by calculating sphere volume. The data are normalised to control-treated cells (100%), and graphs show the means ± SD of four independent experiments. ** indicates p-value ≤0.01, *** indicates p-value ≤0.001 and **** indicates p-value ≤0.0001 as determined by ANOVA.
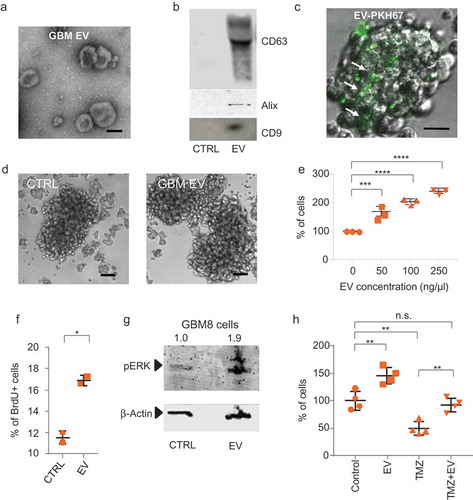
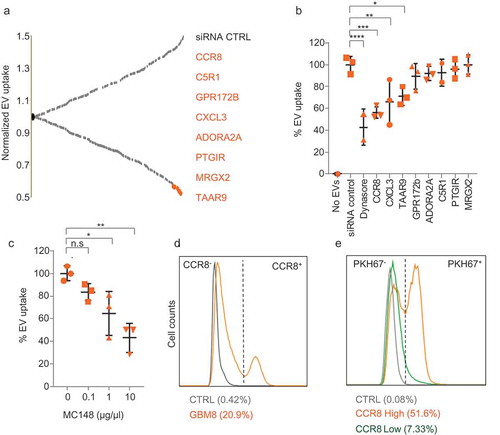
Figure 2. CCR8 acts as an EV receptor (a) GPCR siRNA screening result on HEK-293T cells. Normalised PKH67 fluorescence is displayed on the Y-axis, and each dot represents a siRNA against an individual GPCR Top-8 EV uptake-reducing siRNAs are highlighted in orange and indicated at the right side. (b) siRNA screening validation on GBM8 cells with an independent set of siRNAs. Normalised PKH67 fluorescence (EV uptake) is displayed on the Y-axis. Treatment of cells with Dynasore served as a control for EV uptake reduction. (c) CCR8 inhibitor MC148 reduces EV uptake in a dose-dependent fashion. (d) FACS analysis of CCR8 expression in GBM8 cells. Negative control: No anti-CCR8 primary antibody (e) PKH67 fluorescence (representative of EV uptake) of CCR8− (green) compared to CCR8+ (orange) GBM8 cells. Negative control (grey): GBM8 cells not incubated with PKH67 EVs.
Development of Cre and mTmG lines and in vitro Cre-mT/mG EV transfer studies
The Cre-expressing GBM8 cell line was generated by lentiviral transduction of the plasmid Puro.Cre empty vector (Addgene #17,408), followed by puromycin selection for 1 month. Homogeneity of Cre expression in GBM8-Cre cells was verified by immunocytochemistry. GBM8 mT/mG cells were generated by releasing the entire (linearised) mT/mG cassette from ROSA26 mT/mG plasmid (Addgene #17,787) by restriction with AscI, AccI and PmeI (New England Biolabs), band purification and electroporation with a microporator MP-100 (Digital Bio, Seoul, South Korea) following manufacturer’s instructions with a single pulse of 1400 V for 40 ms. After 1 month in culture, cells still expressing mTomato protein were sorted by flow cytometry in a FACSARIA instrument (BD Biosciences). Functionality of the mT/mG cassette was verified by incubating the lenti Puro.Cre virus directly on GBM8-mT/mG cells and observing appearance of mG+ cells 96 h later. For EV transfer studies, 1 × 10⁴ GBM8-mT/mG cells were seeded in 6-well plates and Cre-donor EV isolates were added at a final concentration of 10 and 40 ng/µL. An equivalent volume of PBS was added as negative control. Alternatively, a total 104 GBM8-mT/mG and GBM8-Cre cells were co-cultured at 1/10 and 1/100 ratios of mT/mG vs Cre cells. As a negative control, GBM8-mT/mG cells were co-cultured with parental Cre− cells. After 12 days in culture, wells were inspected for the presence of spheres with GFP+ cells in a Leica DM IL microscope equipped with a DFC345 FX camera. Results were expressed as % of GFP+ spheres relative to the total spheres.
In vivo Cre-mT/mG EV transfer studies
Vesicles were harvested by ultracentrifugation of conditioned medium from Cre-containing GBM8 cells or from parental cells. For tumour-to-tumour crosstalk, GBM8-mTmG cells, GBM8-Cre cells and GBM8 parental cells were prepared and concentrated as indicated above. Shortly before intracranial injection, GBM8-mTmG were washed once with phosphate buffered saline (PBS) and concentrated to 1.2 x 10⁵ cells per µL. Mice were stereotactically injected with 6 × 10⁵ cells in a final volume of 5 µL into the striatum. All intracranial injections were performed using isoflurane inhalation anaesthesia (1.5 L O2/min; 2% isoflurane) and appropriate systemic and topical analgesia. Coordinates used for intracranial injections were 0.5 mm X, 2 mm Y, −2.5 mm Z from the bregma [Citation1]. Three days after injection of GBM8-mTmG tumour cells, 10 µL vesicle suspension (15 µg) was injected into the tumour, using the same coordinates. GBM8-mTmG cells were injected in the striatum of the left hemisphere; whereas, GBM8-Cre (n = 6) or GBM8 parental cells (n = 6) were injected in the right hemisphere. Three weeks after tumour injection, mice were sacrificed and cryosections (8 µm thick) of brains were prepared. Fluorescence of endogenous mTomato and/or GFP in the left hemisphere was imaged in DAPI stained cryosections using a Zeiss Fluorescence microscope.
GPCR siRNA screening
For the GPCR siRNA screening, HEK-293T cells were plated in 96-well plates at a density of 5 × 10⁴ cells/mL. After an overnight incubation, cells were transfected with a siGENOME Smartpool siRNA library-G Protein-Coupled Receptors (50 nM, Dharmacon) using Lipofectamine 2000 as a transfection reagent following manufacturer’s indications. This library contains siRNAs against 512 individual GPCRs and GPCR-associated genes. After 48 h, 20 ng/µL of PKH67-labelled EVs was added to the plates. As controls for EV uptake reduction, every plate was loaded with a standard curve of labelled EVs (20, 10, 5 and 0 ng/µL) on untransfected cells. After overnight incubation with stained EVs, plates were washed twice with PBS, nuclei were stained with DAPI and plates were scanned in an Acumen eX3 (TTP LabTech, Melbourne, UK) microplate cytometer. After this overnight incubation time, the fluorescence signal represents the sum of multiple EV interactions and processes, including cell-surface bound EVs and intracellular EVs. Fluorescence levels were normalised by mean fluorescence intensity of all the plates excluding controls and divided by the number of nuclei determined by DAPI staining.
Flow cytometry
For FACS analysis, cells were washed in PBS, resuspended in PBS supplemented with 1% BSA (PBS-BSA) and analysed with FACSDiva software in a BD Fortessa instrument. Collected data were processed with flowJoX software. CCR8 expression analysis was conducted by incubating cells with anti CCR8 antibody for 30 min on ice, washing them three times with PBS-BSA and incubating them with an Alexa Fluor 405-coupled secondary antibody for another 30 min. Cells were analysed after three more washes with PBS-BSA. For the BrdU incorporation assay, cells were seeded at a density of 4 × 10⁵ cells/mL and EVs (or PBS in the control wells) were added at a final concentration of 100 ng/µL at the moment of seeding and once more 18 h later. At 12 h after second EV addition, cells were incubated for 2 h with BrdU and washed with PBS prior fixation with 4% paraformaldehyde (PFA) for 15 min. Membranes were permeabilised with 100% cold methanol and cells were washed with DNAse buffer (10 mM Tris, 2.5 mM MgCl2, 0.1 mM CaCl2) and treated with DNAseI diluted in DNAse buffer at RT for 20 min. Cells were washed in immunocytochemistry (ICC) wash buffer (1x PBS, 0.1% Triton TX-100, 0.05% Azida, 1% BSA), blocked in wash buffer containing 10% fetal bovine serum (FBS) for 20 min at room temperature and incubated overnight with anti-BrdU primary antibody at 4°C. After three wash steps, Alexa Fluor 405-coupled secondary antibody was incubated at RT for 2 h. Before analysis by flow cytometry, samples were washed three times in ICC wash buffer.
CCR8 and CCL18 expression and patient survival analysis
Expression and Kaplan–Meier analyses were performed using the R2 online platform (R2.amc.nl). To distinguish expression levels of GBM versus normal brain tissue, MAS5.0 normalised, u133p2 microarray data of the French Tumour Glioma Dataset (gse16011), containing 276 glioma samples of all histology and 8 control samples; the Sun Tumour Glioma dataset (GSE4290) containing 157 tumour samples including 26 astrocytomas, 50 oligodendrogliomas and 81 glioblastomas; and the Hegi Tumour Glioblastoma dataset (GSE7696), containing 80 GBM specimens of patients, were compared to eight normal samples present in the French dataset; the Berchtold Normal Brain regions dataset (GSE11882) containing 176 samples from hippocampus, entorhinal cortex, superior-frontal gyrus, and postcentral gyrus brain tissues, and the Harris Normal Brain PFC dataset (GSE13564), containing 44 prefrontal cortex brain tissues [Citation44–Citation46]. Kaplan–Meier analyses were performed using the French dataset. The significance of the difference in expression levels of CCR8 and CCL18 between tumour versus normal brain tissues was determined using a t-test. The significance of the Kaplan analyses was tested using a Mann–Whitney test. For this, the most optimal expression threshold point was determined.
Immunocytochemistry, immunohistochemistry, tissue microarray and chemokine array
For immunocytochemistry, attachment of cells to glass coverslips was induced by adding 10% FBS for 2 h. Then, coverslips were washed with PBS, fixed with 4% PFA for 15 min and treated with cold methanol. After a wash in ICC wash buffer, coverslips were blocked in ICC wash buffer containing 10% FBS for 20 min at room temperature and incubated overnight with anti-Cre or anti-CCR8 primary antibodies at 4°C. After three wash steps, Alexa Fluor 488-coupled (Cre) or Alexa Fluor 594-coupled (CCR8) secondary antibodies were incubated at RT for 2 h. Slides were washed three times before and after DAPI counterstain and mounted with Vectashield (Vector Laboratories) on glass slides. For analysis of GBM8 mT/mG xenografts, brain cryosections (10 µm thick) were fixed in 4% PFA, washed three times with PBS for 10 min before and after counterstaining with DAPI and mounted on glass coverslips with Vectashield. Pictures were taken with a Leica DM6000 microscope and processed with ImageJ software. GFP Immunohistochemistry (Abcam; ab 6556; 1:1000) was performed on cryopreserved tissue slides following standard procedures. Slides were scanned using Aperio Scanscope and processed with ImageScope software (Leica). Tissue micro array – GL805a (TMA) containing glioblastoma samples and control tissues was purchased from US Biomax Inc. After deparaffination and microwave-induced antigen retrieval (Tris-EDTA pH9.0), TMA’s were stained with anti-CCR8 antibody (E77, Abcam) and anti-rabbit/mouse EnVision-HRP (DAKO). For negative staining, the first antibody was omitted. CCR8 expression was calculated based on the stained area (0–4) and staining intensity (0–4), thus resulting in a maximal value of 16. To detect chemokines secreted by GBM8 cells, Proteome Profiler™ Human Chemokine Array Kit (R&D Systems) was used to detect secreted chemokines in GBM8 conditioned medium following manufacturer’s instructions. Briefly, array membranes were blocked and incubated for 2 h with conditioned medium collected from cells growing at 2.5 x 10⁵ cells/mL for 24 h and diluted 1:1 in blocking buffer. After washing, membranes were incubated with a cocktail of biotinylated human chemokine antibodies in blocking buffer at RT for 2 h and then incubated with horseradish peroxidase (HRP)-conjugated streptavidin in blocking buffer overnight at 4°C following further washes. After three washes, membranes were developed using Chemi Reagent Mix and visualised on X-ray film (GE healthcare).
Enzyme-linked immunosorbent assay
To detect EV-associated molecules, a fixed concentration of 5 ng/µL or serial dilutions of isolated EVs were coated overnight at 4°C in coating buffer (0.2 M NaHCO3, pH 9.2) on ELISA plates. Plates were washed twice with TSM buffer (20 mM Tris, pH 7.4, 150 mM NaCl, 1 mM CaCl2, 2 mM MgCl2) and blocked with 1% BSA in TSM for 1 h at room temperature. Plates were then incubated with primary antibodies at a fixed concentration (1 µg/mL) or in serial dilutions (from 4 µg/mL to 62.5 ng/mL) in TSM buffer with 1% BSA for 1 h at room temperature. After three washes with TSM buffer, plates were incubated with secondary antibodies at RT for 1 h, washed again three times, and the reaction was developed, using 3,3′,5,5′-tetramethylbenzidine (TMB) as a substrate (Sigma Aldrich). Signal intensities were acquired with a Biotek Synergy HT microplate reader.
In vivo analysis of R243 and TMZ treatment
Treatment with R243 (1.0 mg/kg, i.p. once daily) or vehicle (1% DMSO in PBS) was started at day 4 after tumour injection and continued until day 8. At day 5, animals were treated once with 10 mg/kg TMZ, i.p., or vehicle (4% DMSO in PBS). Stocks of R243 (100 µM; 35.7 mg/mL) were prepared in DMSO and stored at −20°C. Working solutions were prepared freshly before each administration by diluting R243 stock solution in PBS.
Bioluminescence imaging
Tumour progression was followed by measuring firefly luciferase (Fluc) signal by a charge-coupled device (CCD) camera, using the Xenogen-IVIS Lumina system under isoflurane anaesthesia. Mice were injected intraperitoneally with 150 µL D-luciferin (100 mg/kg). Regions of interest were defined on the head of the mice. The photon flux (p/s) in these regions was used as a total measurement of Fluc activity. Photon flux was normalised to the group means at day 8 ()). Disease progression was defined as the time point at which for two consecutive measurements an increase in BLI was observed.
Figure 3. CCR8 inhibition neutralises EV-induced phenotypes in vitro. (a) PKH67 uptake analysis of cells treated with vehicle (green) or with R243 (orange). Control: No PKH67 EVs (grey). (b) Representative pictures of cells incubated as in (a) (scale bars: 25 µm). (c) Relative cell number of cells incubated with and without GBM8 EVs in the presence or absence of R243. Values are normalised to control (vehicle, no EVs), and graphs show the means ± SD of six independent experiments. (d) CellTiter-Glo viability assay (Promega) on GBM8 cells treated with variable concentrations of TMZ and R243. Darker orange represents less viability. (e) Relative cell number of GBM8 spheres incubated with or without 100 ng/µL of GBM8 EVs and treated with TMZ in combination with R243 (orange bars) or vehicle (grey bars). Bars show the means ± SD of four independent experiments. For all experiments * indicates p-value ≤0.05, ** indicates p-value ≤0.01, *** indicates p-value ≤0.001 and **** indicates p-value ≤0.0001 as determined by ANOVA.
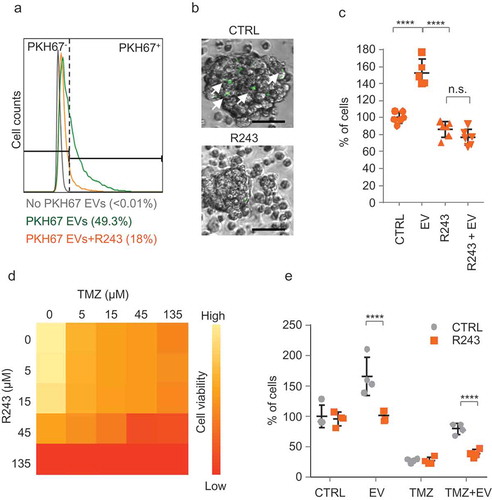
Figure 4. CCR8 and CCL18 expression levels are increased in GBM and are indicators of poor prognosis. (a) Representative pictures of a GBM TMA immunostained against CCR8 (scale bar: 200 µm). (b) Scoring of CCR8 immunoreactivity on TMA of GBM of different grades and healthy tissue. * indicates p-value ≤0.05 (t-test). (c,d) CCR8 and CCL18 mRNA expression analysis on datasets using R2 Analysis and Visualisation Platform. X-axis shows the dataset used. (e,f) Survival analysis of patients expressing high and low levels of CCR8 and CCL18 mRNA, respectively. For expression and Kaplan–Meier analyses R2 online platform (R2.amc.nl) was used. Differential expression was tested by t-test and significance of Kaplan analysis by Mann–Whitney test. p-values for CCR8 expression were 10–10 (Sun/Bechtold), 9–9 (Hegi/Harris) and ˃0.05 for the French dataset. p-values for CCL18 expression were 0.004 (Sun/Bechtold), 0.05 (Hegi/Harris) and 0.0003 for the French dataset.
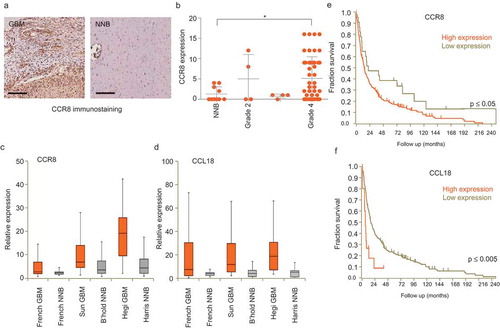
Figure 5. CCL18 enhances EV uptake. (a) EV uptake analysis on GBM8 cells incubated with recombinant CCL18 prior PKH67-EV addition. (b) EV uptake analysis on EVs pre-incubated with CCL18 neutralising antibody. * indicates p-value ≤0.05, ** indicates p-value ≤0.01, *** indicates p-value ≤0.001 as determined by ANOVA. (c,d) ELISA results on plates coated with dilutions of isolated EVs and incubated with anti-CD63 (c) or anti-CCL18 (d). Both incubations displayed dose-dependent signal. (e) Immunogold EM pictures showing GBM EVs with strong reactivity against endogenous CCL18. (f) Positive control: Immunogold staining against the exosomal marker CD63. Ab control: No primary antibody (Scale bars: 25 nm).
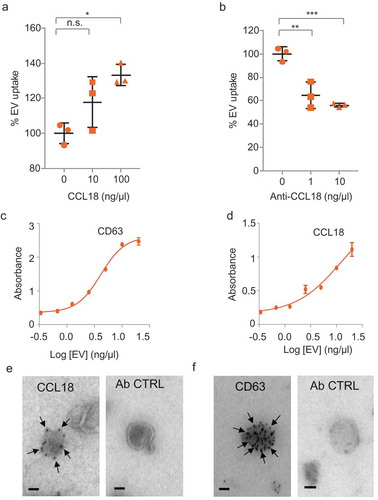
Figure 6. CCL18 acts as a bridging molecule between GAGs on EVs and cellular CCR8 (a–c) Heparan sulphate (a), dermatan sulphate (b) and chondroitin sulphate (c) GAGs are present on EV membranes, as determined by ELISA. (d) EV uptake is prevented by heparin (25 µg/mL) and by (e) Heparinase III (H’se III) (2 miU every 2 h for 6 h at 37°C) treatment of EV isolates. *** indicates p-value ≤0.001 as determined by t-test. (f) Proposed model: GAGs present on the EV membrane bind CCL18 which connects with cellular CCR8 promoting EV uptake. Error bars represent SD of three independent experiments.
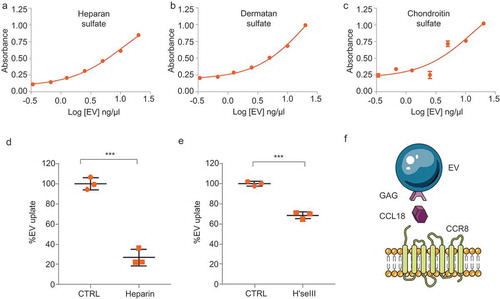
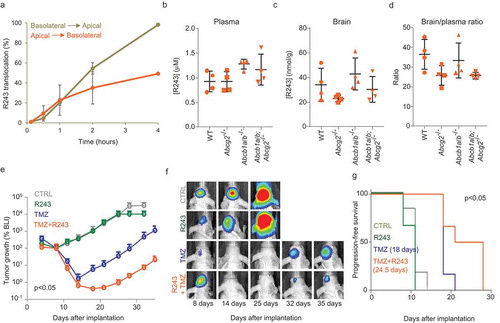
Figure 7. Pharmacological inhibition of CCR8 delays tumour growth after TMZ treatment. (a) R243 transwell translocation assay for the drug transporter P-gp using MDCK cells. Percentage of R243 translocation from basolateral to apical (grey line) and from apical to basolateral (orange line) is plotted on the Y-axis. (b–d) R243 levels were measured in plasma (b) and in brain (c) 1 h after i.v. injection of the drug, and brain-to-plasma ratio was calculated (d). No statistical differences were measured by ANOVA. (e–g) BLI tumour growth analysis of GBM8 mouse xenografts treated with vehicle (grey); R243, 1.0 mg/kg (green); TMZ, 10 mg/kg (blue) or R243 and TMZ combined (orange). Mice were treated with R243 once daily from day 4 to day 8 after tumour injection and TMZ was administered a single time at day 5. The y-axis represents the median BLI normalised to day 8. The p-value was determined by t-test on the area under the curve for TMZ vs TMZ+R243. Representative BLI images are shown in (f) and progression-free survival is calculated in (g). P-value on median progression-free survival was determined by the Log-rank (Mantel-Cox) test.
Pharmacokinetic studies
WT FVB mice and transgenic Abcg2−/-, Abcb1a/b−/- and Abcg2; Abcb1a/b−/- FVB mice were used in pharmacokinetic studies. R243 was administered i.v. at a dose of 10 mg/kg in a formulation containing 2 mg/mL R243 in DMSO:Cremophor EL:saline (1:1:8). Blood and brains were collected 1 h after administration. Plasma was obtained by centrifugation (5 min, 5000 rpm, 4°C) and brains were weighed and homogenised using a FastPrep®-24 (MP-Biomedicals, NY, USA) in 1% (w/v) bovine serum albumin in water. R243 was extracted by liquid–liquid extraction using ethyl acetate and measured using LC–MS/MS.
In vitro translocation assays
Conventional bidirectional translocation assays were performed using parental MDCK cells as described previously [Citation47] R243 was added to either the apical or basolateral side of a Transwell microporous polycarbonate membrane filters (3.0 µm pore size, 24 mm diameter; Costar Corning, Corning, NY, USA) at a concentration of 100 nM and translocation over time was measured using LC–MS/MS. Complete R243 translocation was reached when an equilibrium between both compartments was established.
Accession numbers
The raw sequencing data are deposited at a public database. The NCBI SRA accession number for the small RNA sequencing by Illumina Hi-Seq 2500 reported in this paper is SRP092232. Small RNA sequencing data used in the analysis for Supplementary Figure 9 is presented in Supplementary Table S1 with the list of human miRNAs detected in GBM8 cells and their paired EVs. Individual miRNA sequencing reads mapped to human miRNAs are detected in cells and their paired EVs. Highlighted in yellow are miRNAs represented in Supplementary Figure 9. RPM, reads per million of normalised reads (relative expression).
Results
GBM EVs induce a proliferative phenotype in recipient GBM cells
To confirm the pro-tumoural capacity of EVs on GBM cells we isolated EVs from GBM-conditioned media by differential ultracentrifugation [Citation40,Citation48]. EVs isolated from stem-like GBM8 cells (a primary stem-like GBM cell type) had diameters ranging from 30 to 200 nm (), Supplementary Figure 1(a)) and expressed CD63, Alix and CD9 ()). EVs isolated from U87 and U251 were phenotypically similar to GBM8 EVs and also expressed EV markers (Supplementary Figure 1(b,c)). GBM8 cells were incubated with isolated and PKH67-labelled GBM8 EVs, resulting in a dotted fluorescent pattern, indicating efficient EV binding ()). Similar results were obtained for U251 and U87 (Supplementary Figure 1(d)). The active uptake of EVs was confirmed by the uptake of PKH67-labelled GBM8-derived EVs after 1-h incubation, which was efficiently blocked by the addition of dynasore (Supplementary Figure 1(e)). Using FACS analysis, the proportion of PKH67+ cells after incubation with labelled EVs showed a sigmoidal log-linear dose–response relationship with the amount of PKH67-labelled EVs added (R = 0.9998). Co-incubation of PKH67-labelled EVs with increasing concentrations of unlabelled EVs resulted in a dose-dependent reduction in mean fluorescence intensity (Supplementary Figures 1(f,g)) [Citation39,Citation40]. These results prompted us to quantify EV-mediated proliferation. We incubated GBM8 cells with fresh (EV-free) medium or with medium supplemented with isolated GBM EVs, resulting in enlarged stem-like GBM8 neurospheres and an increase in total cell number in cells supplemented with exogenous EVs ()). The EV-mediated induction of proliferation was significant and dose-dependent, increasing GBM8 stem-like cell numbers by 2.4-fold when cells were incubated with 250 ng/µL of isolated EVs ()). Addition of exogenous EVs resulted in a 1.5-fold increase in 5-bromo-2′-deoxyuridine (BrdU) incorporation, indicating that the observed increase in cell number is, at least partially, due to an enhanced proliferation rate ()). EV exposure also induced activation of the MAPK-ERK pathway, as evidenced by an increase in phospho-ERK levels ()). Because MAPK-ERK activation is also implicated in TMZ resistance in GBM cells [Citation49], we validated the effects of TMZ treatment in the presence of EVs. After determining the IC50 value of TMZ on GBM8 cells (~20 µM, Supplementary Figure 2), we treated cells with 20 µM TMZ in the presence or absence of 100 ng/µL of purified EVs. As shown in ), addition of exogenous EVs indeed resulted in strong protection against TMZ-mediated cell kill, although a partial contribution of a concomitant induction of cellular proliferation is not excluded.
To determine whether functional transfer by EVs occurs at physiologically relevant levels, we used a colour switch system based on EV-mediated Cre recombinase mRNA transfer [Citation1]. Reporter mT/mG cells contain a floxed copy of membrane-tagged Tomato (mT). Upon Cre-mediated recombination the mT sequence is excised allowing expression of a membrane-tagged GFP (mG) located immediately downstream, resulting in a colour switch from mT+ (red) to mG+ (green) (Supplementary Figure 3(a)). Cre protein expression in stably transduced EV donor cells was confirmed by immunocytochemistry (Supplementary Figure 3(b)), and functionality of the reporter cells was verified by incubating cells with Cre-expressing lentivirus (Supplementary figure 3(c)). RT-PCR analysis revealed presence of Cre mRNA in EVs isolated from these donor cells (Supplementary Figure 3(d)). Addition of purified Cre+ EVs isolated from Cre donor cells induced patches of mG+ cells in recipient GBM8-mT/mG stem-like neurospheres (Supplementary Figure 3(e)). In order to determine whether transfer of biologically functional molecules was also achieved by natural secretion of EVs from donor cells, we conducted co-culture experiments, with no exogenous addition of EVs, resulting again in the appearance of clusters of mG+ cells and thus confirming efficient Cre transfer in a more physiological setting (Supplementary Figure 3(f)).
Altogether these results indicate that GBM EVs can transfer cargo, and that EV interaction results in activation of the MAPK-ERK pathway, induces proliferation, and that EVs can reverse TMZ sensitivity.
CCR8 acts as an EV receptor
To identify cellular receptors involved in EV uptake, we performed siRNA screening using PKH67-labelled EV uptake by HEK-293T cells as readout. HEK-293T cells were selected because the conditions for siRNA screening of these cells were considered more favourable as compared to primary stem-like GBM neurospheres. We selected a siRNA library against G-protein coupled receptors (GPCRs) because of the highly versatile roles of GPCRs in many cellular processes, including viral entry, and because many GPCRs are potentially druggable. After testing that GBM EVs are efficiently taken up by HEK-293T cells and that EV uptake is dose-dependent (Supplementary Figure 4(a,b)), we transfected the GPCR siRNA library. At 48 h after transfection, cells were incubated overnight with labelled EVs and fluorescent cells were recorded (Supplementary Figure 4(c)). A total of 65 of 512 siRNAs caused a reduction in fluorescent signal stronger than 30%. From these, we selected the top-8 for further validation with an independent set of siRNAs ()). CCR8 inhibition caused a strong and consistent reduction in EV uptake in both HEK-293T and GBM8 cells and therefore was selected for further studies () and Supplementary Figure 4(d)).
CCR8 is a beta chemokine receptor with a known role in induction of chemotaxis in Th2 cells via its two ligands CCL1 and CCL18 [Citation50], and functions as a co-receptor for enveloped viruses including HIV [Citation51,Citation52]. The CCR8 axis has been found to be activated in urothelial and renal carcinomas resulting in immune response impairment, and it is responsible for apoptosis inhibition in lymphoma [Citation53,Citation54]. Furthermore, CCR8 function in melanoma cells is essential for the entry of metastatic cells into lymph nodes [Citation55]. We show the relevance of CCR8 on EV uptake in GBM8 cells by the dose-dependent reduction of uptake in the presence of increasing concentrations of MC148, a highly selective virus-encoded CCR8 antagonist [Citation56] ()). According to the CCR8 expression levels, GBM8 cells can be divided into two populations. One population expresses undetectable levels of CCR8 (CCR8− cells), whereas the other population shows significant CCR8 immunoreactivity (CCR8+ cells) () and Supplementary Figure 4(e)). In several independent experiments, we have observed variable proportions of CCR8+ GBM cells, ranging from 20% to 80%. Interestingly, when we combined labelled EV uptake with CCR8 immunostaining, we observed that a significantly larger proportion of CCR8+ cells take up PKH67-labelled EVs than do CCR8− cells ()), strongly suggesting that CCR8 participates in the uptake process.
CCR8 inhibition neutralises EV-induced phenotypes in vitro
R243 is a small molecule which functionally inhibits CCR8 both in vivo and in vitro [Citation57]. We therefore synthesised a batch of R243 to test its effect on inhibiting EV uptake (chemical synthesis scheme in Supplementary Figure 5(a)). As expected, R243 treatment strongly impaired EV uptake (,)). CCR8 inhibition by R243 or MC148 occurred at early time points (3 h), suggesting a role in early steps of EV uptake (Supplementary Figure 5(b)). We then tested whether R243 could counteract EV-induced phenotypes on recipient GBM cells. After determining the IC50 value of R243 on GBM8 cells (44 µM, Supplementary Figure 5(c)), we pre-treated GBM8 cells with R243 (20 µM) for 30 min, incubated the cells with isolated EVs and measured the total number of GBM cells after 96 h. As shown in ), R243 alone had no measurable effect on GBM cell growth; whereas, R243 pre-treatment was able to completely block EV-induced GBM cell growth. Next, we studied whether addition of R243 would improve the effect of TMZ treatment. Combined treatment of GBM cells resulted in enhanced potency of TMZ, with combination indexes [Citation58] down to 0.8 ()). We studied the effects of R243 on GBM cells treated with TMZ in the presence of isolated EVs. Interestingly, although EV supplementation alone restored cell numbers after TMZ treatment, R243 treatment partially prevented this EV-induced resistance to TMZ ()). As shown in Supplementary Figure 5(d–h), R243 reduced EV uptake by three different GBM lines tested, although with variable potency. We also observed a significant effect of the drug on A375 cells (malignant melanoma), but not on A549 cells (lung carcinoma). These results suggest that CCR8 may also function as an EV receptor on certain non-GBM cell types.
CCR8 and CCL18 expression levels are increased in GBM and are indicators of poor prognosis
To determine whether CCR8 expression has implications in tumour progression in GBM patients, we performed immunostaining against CCR8 on a tissue microarray (TMA) from glioma samples of patients with different glioma grades, including grade IV GBM. Tumour cells exhibited different immunoreactivity patterns which we scored depending on the intensity of the staining. Blinded classification of array specimens revealed a significant increase in CCR8 expression in grade IV GBM as compared to normal (non-tumoural) brain tissues (,) and Supplementary Figure 6). We also performed metadata analysis on publicly available microarray data using the R2 Analysis and Visualisation Platform (http://r2.amc.nl). Results showed increased mRNA levels of both CCR8 and its natural ligand CCL18 in GBM as compared to normal brain samples (,d)). Moreover, survival analyses indicate that both CCR8 and CCL18 are indicators of poor prognosis in GBM patients (,)).
CCL18 acts as a bridging molecule between gags on EVs and cellular CCR8
We performed EV uptake analyses in the presence of CCL1 and CCL18, the two known ligands of CCR8, as well as with neutralising antibodies directed against these chemokines. Recombinant CCL18 addition significantly increased EV uptake, and the CCL18 neutralising antibody decreased uptake (,)), whereas addition of recombinant CCL17 had no effect, and the addition of rCCL1 even resulted in a small, but significant, reduction of EV uptake at the highest dose (Supplementary Figure 7(a,b)). These results suggest that CCL18 plays a mediating role in the EV uptake via CCR8. Chemokine arrays were used to determine that GBM8 cells secrete many chemokines, including CCL18 (Supplementary Figure 7(c)). Given that EV membranes are highly glycosylated [Citation59,Citation60], and that chemokines bind with high affinity to glycans [Citation61,Citation62], we considered the possibility that CCL18 could be acting as a bridging molecule between glycans on the EV membrane and the cellular receptor CCR8. We incubated isolated EVs with recombinant CCL18 overnight, washed the EVs with PBS and purified them again. Western blot analysis revealed that CCL18 can be detected in the EV pellet but not in the supernatant, confirming effective binding of CCL18 to EVs (Supplementary Figure 7(d)). We incubated ELISA plates with isolated GBM8 EVs and confirmed proper vesicle coating by detection with the marker CD63 () and Supplementary Figure 7(e)). This system also allowed us to detect endogenous CCL18, but not CCL1 on GBM8 EVs () and Supplementary Figure 7f, g). To further confirm CCL18 presence on GBM8 EVs, we performed immunogold EM on isolated EVs, observing exosome-like vesicles with strong immunoreactivity against CCL18 and CD63 (, ).
Next, we validated the presence of glycans on GBM EV membranes. As shown in –c), GBM8 EVs are rich in heparan sulphate, chondroitin sulphate and dermatan sulphate, the main glycosaminoglycans (GAGs) produced by eukaryotic cells [Citation63–Citation65]. Chemokine–glycan interactions occur mainly by electrostatic forces. Heparin is a soluble and highly sulphated GAG, capable of displacing chemokine–glycan interactions owing to its high negative charge density [Citation61,Citation62,Citation66]. Furthermore, heparin has been shown to efficiently bind and capture EVs [Citation67]. We reasoned that if CCL18 binding to EVs is essential for cellular uptake, pretreatment of EVs with heparin should cause CCL18 to be displaced from the EV membrane consequently, resulting in diminished uptake. Indeed, heparin pretreatment reduced EV uptake by 80% ()). This result is in agreement with a previous report from Paggetti and colleagues in which heparin treatment of chronic lymphoid leukaemia-derived EVs caused a strong reduction in EV uptake [Citation28]. To further demonstrate the involvement of GAGs in the uptake process, we treated purified EVs with Heparinase III (H’se III), which cleaves 1–4 linkages between hexosamine and glucuronic acid residues in heparan sulphate molecules. H’se III treatment reduced EV uptake by approximately 40%, confirming that glycans exposed on the EV membrane facilitate EV uptake ()). Collectively, these results reveal an EV uptake model in which CCL18 acts as a ‘connectokine’ between glycans decorated on the EV membrane and the cellular receptor CCR8 ()).
Pharmacological inhibition of CCR8 delays tumour growth after TMZ treatment
A common problem in the development of drugs for GBM treatment is the blood–brain barrier (BBB). Therefore, we first verified that R243 is capable of reaching the brain. Specific transporter proteins present on the BBB are known for their role in blocking drug delivery to the brain [Citation68]. By using wildtype mice, and transgenic mice deficient for the transporters Abcg2 and Abcb1a/b [Citation68,Citation69], we show that these drug transporters have no meaningful impact on the brain penetration of R243 (–c)). Intriguingly, the brain-to-plasma ratio of R243 was 35 in wildtype mice, unusually high, pointing to a remarkable accumulation of R243 into the brain ()). Next, to test the effects of R243 on GBM in vivo, we employed a version of GBM8 cells (GBM8-FM) stably expressing mCherry protein and firefly luciferase, which allows monitoring of tumour growth by bioluminescence imaging. Subsequently, we tested with the Cre-mT/mG EV reporter system the ability of in vivo transfer of EV cargo. We orthotopically injected GBM8-mT/mG recipient cells in the brain of nude mice (n = 6). Three days after implantation of the recipient reporter cells, we injected EVs isolated from Cre+ (n = 3) or Cre− (n = 3) donor cells in the brains of these mice. Two weeks later the mice were sacrificed and the brains were resected, sliced and analysed by fluorescent microscopy. The tumour tissues consisted mostly of red mT+ cells, but tumour areas with abundant mG+ cells were also observed in three out of three mice injected with Cre+ EVs, in contrast to the brains of the three mice injected with Cre− control EVs, where no mG+ cells were detected (Supplementary Figure 8(a)). Next, we investigated whether physiological levels of locally produced Cre+ EVs – by co-injection of GBM8-Cre donor cells with GBM8-mT/mG recipient cells – can also result in functional transfer of Cre. Hence, we co-injected mice with mT/mG recipient cells in one hemisphere, and Cre+ or Cre− donor cells in the opposite hemisphere of the brain in order to minimise the risk of cell contact-dependent Cre transfer. Again, the brains of three out of three mice co-injected with Cre+ cells displayed patches of mG+ cells in mT/mG tumours, in contrast to mice co-injected with Cre− GBM cells which resulted only in mT+ cells (Supplementary Figure 8(b)). The presence of mG+ cells was further validated by anti-GFP immunostaining of mouse brain slices (Supplementary Figure 8(c)). These results demonstrate that EVs can indeed provide functional transfer of cargo-like RNA molecules, or proteins in orthotopic brain tumours, albeit that the efficiency of the Cre–mT/mG reporter system under these conditions is relatively low. Next, we tested if we could inhibit the EV mediated protumoural effects in vivo, by the administration of the CCR8 inhibitor R243. As shown in ,), R243 administration did show a trend in reducing primary GBM stem-like xenograft growth in nude mice (n = 6), although no significant effects were reached. However, when we administered R243 before and after TMZ treatment in nude mice (n = 6), the effect of TMZ was significantly enhanced, and tumour recurrence was significantly delayed as compared to TMZ treatment in the absence of R243 (,)). In conclusion, under these conditions, R243 only showed a minor non-significant effect when administered alone, and perhaps repeated dosing and/or earlier treatment would be more beneficial. However, administration of R243 in combination with TMZ did demonstrate a significant delay of recurrence after TMZ treatment and warrants further preclinical testing ()).
Discussion
We present three main findings related to EV uptake by GBM cells: (i) GBM EVs can be transferred between GBM cells in vitro and in vivo, stimulating GBM cell growth and protecting against TMZ; (ii) CCR8 acts as an EV receptor on GBM cells and binds to CCL18, which acts as a bridging molecule to GAGs exposed on EVs, and (iii) Pharmacological inhibition of CCR8 with the small molecule R243 inhibits EV uptake by GBM cells, resulting in sensitisation of GBM cells to TMZ in vitro and in vivo.
Uptake of GBM EVs can induce cell growth in recipient cells, confirming previous reports [Citation9,Citation10], but seemed to have stronger phenotypic effects on TMZ resistance in GBM, in particular in vivo. Tumour-derived EVs have been implicated in resistance to other types of therapy in various tumour types [Citation15–Citation19]. By the use of the Cre-based colour switch model, we demonstrated that transfer of active mRNA molecules – such Cre recombinase – among GBM cells occurs in vitro as well as in vivo, and that transferred mRNA can be transcribed into functional molecules once incorporated in recipient cells. Cre mRNA transfer was observed both when we injected purified EVs into the tumour and, more importantly, when donor cells were allowed to naturally secrete Cre mRNA-loaded EVs, implying that physiological levels of EVs reached by tumour cells’ secretion are sufficient to target distant cells and transcribe their cargo. We identified a set of miRNAs in GBM EVs that have potential implications in the process of TMZ resistance. Among the most abundant miRNAs in GBM EVs, we observed a majority of pro-tumoural, proliferation-inducing miRNAs, such as miR-10b-5p, miR-92 and miR-21 (Supplementary Figure 9(a,b)) [Citation70–Citation73]. More research is essential to fully understand the mechanisms involved in the capacity of GBM EVs to induce TMZ resistance. TMZ is an alkylating agent that transfers a methyl group to purine bases in cellular DNA, causing incorrect pairing and triggering the mismatch repair system (MMR), resulting in cell cycle arrest and apoptosis in proliferating cells [Citation74–Citation76]. Tumour cells become resistant to TMZ by different mechanisms, including overexpression of DNA repair mechanisms and multidrug efflux transporters such as P-gp, mutations in p53 and phosphatase and tensin homolog (PTEN), and altered RNA expression patterns [Citation77–Citation79]. The main inducer of TMZ resistance is the DNA repair enzyme O6-methyl-guanidine methyltransferase (MGMT). The MGMT methylation status is a better predictor of TMZ resistance than ‘stemness’ of the glioblastoma cells [Citation80]. MGMT counteracts TMZ effects by direct removal of the O6-methyl group from alkylated guanines [Citation81]. Interestingly, it was reported that GBM EVs from cell lines resistant to TMZ as well as from treatment-refractory patients carry elevated levels of MGMT mRNA, and that these levels are predictive for patient outcome [Citation82]. We therefore do not exclude that EV transfer of MGMT mRNA molecules facilitates, at least partly, the resistance to TMZ observed [Citation60–Citation63].
Here, we propose a model in which the chemokine CCL18, a natural ligand of the CCR8 receptor, connects glycans exposed on the EV membrane to the CCR8 receptor expressed on GBM cells. Viruses and EVs can have similar biophysical characteristics and routes of biogenesis and uptake [Citation29,Citation30,Citation83]. For instance, it was reported that certain strains of HIV can bind oligomers of CCL5 via glycans exposed on the viral envelope, allowing viral attachment to the plasma membrane of the target cell. CCL5 was also shown to strongly induce uptake of (cellular, non-viral) EVs from uninfected T lymphocytes [Citation84]. Of note, it was reported that enveloped viruses, such as HIV, can use chemokine receptors as co-receptors, including CCR8 [Citation51,Citation85–Citation87]. Moreover, natural ligands can compete with these viruses for the co-receptors, inhibiting viral uptake [Citation88,Citation89]. Exploring other viral co-receptors as potential EV receptors could be of interest.
Myanishi et al. demonstrated that Tim1 and Tim4 can act as EV receptors by binding to phosphatidylserine exposed on EVs. However, EV uptake by a certain cell may not only depend on the presence of specific cellular receptors, but in the case of bridging uptake mechanisms, also on the availability of adaptor ligands, either secreted by the recipient or donor cell, or by other cells in the microenvironment. Here, we show that CCL18 functions as bridging adaptor for GBM EVs, and CCL18 expression has been identified as an important prognostic factor in GBM [Citation90]. Recently, it was shown that EVs can also be decorated by autotaxin resulting in binding to integrins expressed on cell surfaces [Citation32]. Similarly, it was reported that heparan sulphates exposed on EVs can bind to fibronectin, serving as a connecting molecule to heparan sulphates expressed on cell membranes [Citation34]. Christianson et al. previously showed that heparan sulphate molecules expressed on cell surfaces can function as EV receptors on GBM cells [Citation33], and others demonstrated that heparin treatment reduces EV uptake by recipient cells, including GBM cells [Citation28,Citation34,Citation91–Citation94]. We observed that pretreatment of cells with heparin reduces EV uptake to a lesser extent than pretreatment of EVs with heparin (data not shown), suggesting that both mechanisms (direct heparin sulphate- and CCR8-mediated endocytosis) can occur simultaneously. An important consequence of the ‘connectokine’ model is that it implies a complex level of regulation of EV transfer, perhaps similarly as observed for decoration of EVs with autotoxin [Citation32] or fibronectin.
Interfering with selective EV uptake may be a promising approach to attack cancer cells, given the numerous potential protumoural effects EVs can exert. Here, we show that two CCR8 inhibitors, the peptide MC148 and the small molecule inhibitor R243, were able to inhibit EV uptake. Because the structure and the size of R243 allowed transport across the BBB, this compound was selected for our in vivo experiments. R243, a small molecule inhibitor of CCR8, inhibits EV uptake and counteracts EV-induced responses in recipient GBM cells in vitro and in vivo. R243 did not only influence the interaction of EVs and the GBM8 cell line, but had similar effects in two other GBM cell lines and in a melanoma cell line, suggesting a general role of CCR8-EV interaction, although the exact role of CCR8 expression on other non-cancerous cells – remains to be investigated. For instance, Th2 lymphocytes are known to express high levels of CCR8 [Citation50,Citation95–Citation97], which we were not able to analyse in our nude mouse xenograft models with primary human GBM stem-like brain tumours. In addition, we do not exclude that other receptors can function in the uptake of GBM EVs, and perhaps additional chemokine/chemokine receptor pairs play a role in the tropism determination of EVs. Complex networks of chemokine/chemokine receptor pairs are known to induce tumour cell survival, angiogenesis, invasion as well as recruitment to metastatic niches. These networks act in both autocrine and paracrine fashion, establishing virtual reciprocal dialogues between the tumour and its environment. The CCR8 axis has been related to several cancer progression-related processes in lymphoma, urothelial and renal carcinomas, breast, and pancreatic cancers [Citation53,Citation54,Citation98–Citation101]. Noteworthy, in melanoma, where EV-mediated communication has been shown to be key for metastasis [Citation5,Citation102], highly malignant cells express elevated levels of CCR8 and migrate to the lymph node in response to the secretion of the ligand by lymphatic endothelial cells. Blocking of the CCR8 axis resulted in strong reduction of metastatic transit through the lymph node in xenograft models [Citation55], suggestive of a potential role of EV uptake via CCR8 during melanoma metastasis.
In summary, we describe a mechanism of EV uptake involving a chemokine receptor and its natural ligand acting as a connecting adaptor. Inhibition of CCR8 decreased EV-induced phenotypes in GBM in vitro and in vivo models, opening the door to new anticancer approaches based on chemokine-receptor targeting of tumour EV crosstalk.
Author contributions
J.B. and T.W. designed the study and wrote the manuscript. J.B., T.L., X.W.Z., S.D., P.vd.S., B.W., D.K.L, M.C.d.G., M.Z., A.Z., M.H.W.C., L.E.W., A.L.L., A.G., M.B.O., I.H.vd.M., R.M.R., T.H.v.K., and J.J.G.G., performed experiments and analysed data. Y.v.K., B.A.T., P.W., W.P.V., D.P.N., V.W.v.B., J.C.v.R., D.M.P., O.v.T, and T.W. provided materials, performed data analyses and interpretation. All authors provided critical comments on the manuscript.
Declaration of interest
The authors declare no potential conflicts of interest.
ZJEV_A_1446660.zip
Download Zip (19.8 MB)Acknowledgments
The authors thank M.H. Meel for his help with FACS sorting and J.W. van Weering for his assistance with electron microscopy. The plasmids Puro.Cre (Addgene plasmid # 17408) and ROSA26 mT/mG (Addgene plasmid # 17787) were a kind gift from Dr. T. Jacks and Dr. L. Luo. Financial support was provided by European Research Council 336540 (TW) and Stichting STOPhersentumoren.nl (JB and TW). This work is part of the research programme Vernieuwingsimpuls with project number 016.116.366 financed by the Netherlands Organization for Scientific Research (TW).
Disclosure statement
No potential conflict of interest was reported by the authors.
Supplementary material
Supplemental data for this article can be accessed here.
Additional information
Funding
Related Research Data
References
- Zomer A, Maynard C, Verweij FJ, et al. In vivo imaging reveals extracellular vesicle-mediated phenocopying of metastatic behavior. Cell [Internet]. 2015 [cited 2015 May 22];161:1–21. DOI:10.1016/j.cell.2015.04.042
- Wang Y, Yi J, Chen X, et al. The regulation of cancer cell migration by lung cancer cell-derived exosomes through TGF-β and IL-10. Oncol Lett [Internet]. 2016 [cited 2017 Jan 2];11:1527–1530. Spandidos Publications. DOI:10.3892/ol.2015.4044
- Liao J, Liu R, Shi YJ, et al. Exosome-shuttling microRNA-21 promotes cell migration and invasion-targeting PDCD4 in esophageal cancer. Int J Oncol. 2016;48:2567–2579.
- Hoshino A, Costa-Silva B, Shen T-L, et al. Tumour exosome integrins determine organotropic metastasis. Nature [Internet]. 2015;527:329–335.
- Peinado H, Alečković M, Lavotshkin S, et al. Melanoma exosomes educate bone marrow progenitor cells toward a pro-metastatic phenotype through MET. Nat Med [Internet]. 2012;18:883–891.
- Costa-Silva B, Aiello NM, Ocean AJ, et al. Pancreatic cancer exosomes initiate pre-metastatic niche formation in the liver. Nat Cell Biol [Internet]. 2015;17:816–826.
- Hosseini-Beheshti E, Choi W, Weiswald LB, et al. Exosomes confer pro-survival signals to alter the phenotype of prostate cells in their surrounding environment. Oncotarget [Internet]. 2016;7:14639–14658.
- Rodríguez M, Silva J, Herrera A, et al. Exosomes enriched in stemness/metastatic-related mRNAS promote oncogenic potential in breast cancer. Oncotarget [Internet]. 2015;6:40575–40587.
- Setti M, Osti D, Richichi C, et al. Extracellular vesicle-mediated transfer of CLIC1 protein is a novel mechanism for the regulation of glioblastoma growth. Oncotarget [Internet]. 2015;6:31413–31427.
- Skog J, Würdinger T, van Rijn S, et al. Glioblastoma microvesicles transport RNA and proteins that promote tumour growth and provide diagnostic biomarkers. Nat Cell Biol [Internet]. 2008 [cited 2014 Jul 11];10:1470–1476. DOI:10.1038/ncb1800
- Baglio SR, Lagerweij T, Pérez Lanzón M, et al. Blocking tumor-educated MSC paracrine activity halts osteosarcoma progression. Clin Cancer Res. 2017;23(14):3721–3733. DOI:10.1158/1078-0432.CCR-16-2726.
- Wendler F, Favicchio R, Simon T, et al. Extracellular vesicles swarm the cancer microenvironment: from tumor–stroma communication to drug intervention. Oncogene [Internet]. 2017 [cited 2017 May 17];36:877–884. Nature Publishing Group. DOI:10.1038/onc.2016.253
- Godlewski J, Krichevsky AM, Johnson MD, et al. Belonging to a network–microRNAs, extracellular vesicles, and the glioblastoma microenvironment. Neuro Oncol [Internet]. 2015 [cited 2016 Nov 11];17:652–662. Oxford University Press. DOI:10.1093/neuonc/nou292
- Godlewski J, Ferrer-Luna R, Rooj AK, et al. MicroRNA signatures and molecular subtypes of glioblastoma: the role of extracellular transfer. Stem Cell Reports [Internet]. 2017 [cited 2017 Jul 1];8:1497–1505. Elsevier. DOI:10.1016/j.stemcr.2017.04.024
- Bebawy M, Combes V, Lee E, et al. Membrane microparticles mediate transfer of P-glycoprotein to drug sensitive cancer cells. Leuk Off J Leuk Soc Am Leuk Res Fund, UK [Internet]. 2009;23:1643–1649.
- Corcoran C, Rani S, O’Brien K, et al. Docetaxel-resistance in prostate cancer: evaluating associated phenotypic changes and potential for resistance transfer via exosomes. PLoS One. 2012;7. DOI:10.1371/journal.pone.0050999
- Ma X, Chen Z, Hua D, et al. Essential role for TrpC5-containing extracellular vesicles in breast cancer with chemotherapeutic resistance. Proc Natl Acad Sci U S A [Internet]. 2014;111:6389–6394.
- Takahashi K, Yan IK, Kogure T, et al. Extracellular vesicle-mediated transfer of long non-coding RNA ROR modulates chemosensitivity in human hepatocellular cancer. FEBS Open Bio. 2014;4:458–467.
- Sousa D, Lima RT, Vasconcelos MH. Intercellular transfer of cancer drug resistance traits by extracellular vesicles. Trends Mol Med. 2015;21:595–608.
- Wiklander OPB, Nordin JZ, O’Loughlin A, et al. Extracellular vesicle in vivo biodistribution is determined by cell source, route of administration and targeting. J Extracell Vesicles [Internet]. 2015;4:26316.
- Prada I, Meldolesi J. Binding and fusion of extracellular vesicles to the plasma membrane of their cell targets. Int J Mol Sci. 2016;17. DOI:10.3390/ijms17081296
- Mulcahy LA, Pink RC, Carter DRF. Routes and mechanisms of extracellular vesicle uptake. J Extracell Vesicles [Internet]. 2014;3:1–14.
- Parolini I, Federici C, Raggi C, et al. Microenvironmental pH is a key factor for exosome traffic in tumor cells. J Biol Chem. 2009;284:34211–34222.
- Lässer C, Alikhani VS, Ekström K, et al. Human saliva, plasma and breast milk exosomes contain RNA: uptake by macrophages. J Transl Med [Internet]. 2011;9:9.
- Svensson KJ, Christianson HC, Wittrup A, et al. Exosome uptake depends on ERK1/2-heat shock protein 27 signaling and lipid raft-mediated endocytosis negatively regulated by caveolin-1. J Biol Chem. 2013;288:17713–17724.
- Escrevente C, Keller S, Altevogt P, et al. Interaction and uptake of exosomes by ovarian cancer cells. BMC Cancer [Internet]. 2011;11:108.
- Smyth TJ, Redzic JS, Graner MW, et al. Examination of the specificity of tumor cell derived exosomes with tumor cells in vitro. Biochim Biophys Acta [Internet]. 2014;1838:2954–2965.
- Paggetti J, Haderk F, Seiffert M, et al. Exosomes released by chronic lymphocytic leukemia cells induce the transition of stromal cells into cancer-associated fi broblasts. Blood. 2015;126:1106–1118.
- van Dongen HM, Masoumi N, Witwer KW, et al. Extracellular vesicles exploit viral entry routes for cargo delivery. Microbiol Mol Biol Rev [Internet]. 2016;80:369–386.
- Wurdinger T, Gatson NN, Balaj L, et al. Extracellular vesicles and their convergence with viral pathways. Adv Virol. 2012;2012. DOI:10.1155/2012/767694
- Miyanishi M, Tada K, Koike M, et al. Identification of Tim4 as a phosphatidylserine receptor. Nature. 2007;450:435–439.
- Jethwa SA, Leah EJ, Zhang Q, et al. Exosomes bind autotaxin and act as a physiological delivery mechanism to stimulate LPA receptor signalling in cells. J Cell Sci [Internet]. 2016 [cited 2016 Aug 29];129:3948–3957. DOI:10.1242/jcs.184424
- Christianson HC, Svensson KJ, van Kuppevelt TH, et al. Cancer cell exosomes depend on cell-surface heparan sulfate proteoglycans for their internalization and functional activity. Proc Natl Acad Sci U S A [Internet]. 2013 [cited 2013 Nov 7];110:17380–17385. DOI:10.1073/pnas.1304266110
- Purushothaman A, Bandari SK, Liu J, et al. Fibronectin on the surface of myeloma cell-derived exosomes mediates exosome-cell interactions. J Biol Chem. 2016;291:1652–1663.
- Al-Nedawi K. Intercellular transfer of the oncogenic receptor EGFRvIII by microvesicles derived from tumour cells. Nat Cell Biol. 2008;10:619–624.
- Antonyak MA, Li B, Boroughs LK, et al. Cancer cell-derived microvesicles induce transformation by transferring tissue transglutaminase and fibronectin to recipient cells. Proc Natl Acad Sci [Internet]. 2011;108:4852–4857.
- Johnson DR, O’Neill BP. Glioblastoma survival in the United States before and during the temozolomide era. J Neurooncol. 2012;107:359–364.
- Stupp R, Mason WP, van den Bent MJ, et al. Radiotherapy plus concomitant and adjuvant temozolomide for glioblastoma. N Engl J Med [Internet]. 2005 [cited 2015 Jan 2];352:987–996. DOI:10.1056/NEJMoa043330
- Trebst C, Staugaitis SM, Kivisäkk P, et al. CC chemokine receptor 8 in the central nervous system is associated with phagocytic macrophages. Am J Pathol [Internet]. 2003 [cited 2017 Dec 4];162:427–438. American Society for Investigative Pathology. DOI:10.1016/S0002-9440(10)63837-0
- Théry C, Amigorena S. Isolation and characterization of exosomes from cell culture supernatants and biological fluids. Curr Protoc Cell Biol [Internet]. 2006;Chapter 3 Unit 3 22, page 1–29. DOI:10.1002/0471143030.cb0322s30.
- Koppers-Lalic D, Hackenberg M, Bijnsdorp IV, et al. Nontemplated nucleotide additions distinguish the small RNA composition in cells from exosomes. Cell Rep. 2014;8:1649–1658.
- Dillies M-A, Rau A, Aubert J, et al. A comprehensive evaluation of normalization methods for Illumina high-throughput RNA sequencing data analysis. Brief Bioinform [Internet]. 2013 [cited 2017 Nov 21];14:671–683. Oxford University Press. DOI:10.1093/bib/bbs046
- Maza E, Frasse P, Senin P, et al. Comparison of normalization methods for differential gene expression analysis in RNA-Seq experiments. Commun Integr Biol [Internet]. 2013 [cited 2017 Nov 21];6:e25849. Taylor & Francis. DOI:10.4161/cib.25849
- Gravendeel LAM, Kouwenhoven MCM, Gevaert O, et al. Intrinsic gene expression profiles of gliomas are a better predictor of survival than histology. Cancer Res [Internet]. 2009;69:9065–9072.
- Sun L, Hui A-M, Su Q, et al. Neuronal and glioma-derived stem cell factor induces angiogenesis within the brain. Cancer Cell [Internet]. 2006 [cited 2017 Nov 21];9:287–300. DOI:10.1016/j.ccr.2006.03.003
- Murat A, Migliavacca E, Gorlia T, et al. Stem cell–related “Self-Renewal” signature and high epidermal growth factor receptor expression associated with resistance to concomitant chemoradiotherapy in glioblastoma. J Clin Oncol [Internet]. 2008 [cited 2017 Nov 21];26:3015–3024. DOI:10.1200/JCO.2007.15.7164
- Lin F, De Gooijer MC, Hanekamp D, et al. Targeting core (mutated) pathways of high-grade gliomas: challenges of intrinsic resistance and drug efflux. CNS Oncol [Internet]. 2013 [cited 2016 May 5];2:271–288. DOI:10.2217/cns.13.15
- Livshts MA, Khomyakova E, Evtushenko EG, et al. Isolation of exosomes by differential centrifugation: theoretical analysis of a commonly used protocol. Sci Rep. 2015;5. DOI:10.1038/srep17319
- Sato A, Sunayama J, Matsuda K, et al. MEK-ERK signaling dictates DNA-repair gene MGMT expression and temozolomide resistance of stem-like glioblastoma cells via the MDM2-p53 axis. Stem Cells [Internet]. 2011 [cited 2017 Jan 4];29:1942–1951. Wiley Subscription Services, Inc, A Wiley Company. DOI:10.1002/stem.753
- Islam SA, Ling MF, Leung J, et al. Identification of human CCR8 as a CCL18 receptor. J Exp Med. 2013;210 SRC:1889–1898.
- Lee S, Tiffany HL, King L, et al. CCR8 on human thymocytes functions as a human immunodeficiency virus type 1 coreceptor CCR8 on human thymocytes functions as a human immunodeficiency virus type 1 coreceptor. J Virol. 2000;74 SRC:6946–6952.
- Calado M. Coreceptor usage by HIV-1 and HIV-2 primary isolates: the relevance of CCR8 chemokine receptor as an alternative coreceptor. Virology. 2010;408:174–182.
- Eruslanov E. Expansion of CCR8(+) inflammatory myeloid cells in cancer patients with urothelial and renal carcinomas. Clin Cancer Res an off J Am Assoc Cancer Res. 2013;19 SRC:1670–1680.
- Louahed J. CCR8-dependent activation of the RAS/MAPK pathway mediates anti-apoptotic activity of I-309/CCL1 and vMIP-I. Eur J Immunol. 2003;33:494–501.
- Das S. Tumor cell entry into the lymph node is controlled by CCL1 chemokine expressed by lymph node lymphatic sinuses. J Exp Med. 2013;210 SRC:1509–1528.
- Lüttichau HR, Stine J, Boesen TP, et al. A highly selective CC chemokine receptor (CCR)8 antagonist encoded by the poxvirus molluscum contagiosum. J Exp Med [Internet]. 2000 [cited 2017 Jan 4];191:171–180. The Rockefeller University Press.
- Oshio T, Kawashima R, Kawamura YI, et al. Chemokine receptor CCR8 is required for lipopolysaccharide-triggered cytokine production in mouse peritoneal macrophages. Plos One. 2014;9. DOI:10.1371/journal.pone.0094445
- Chou T, Talalay PC. Quantitative analysis of dose-effect relationships: the combined effects of multiple drugs or enzyme inhibitors. Adv Enzyme Regul. 1984;22:27–55.
- Escrevente C, Grammel N, Kandzia S, et al. Sialoglycoproteins and N-glycans from secreted exosomes of ovarian carcinoma cells. PLoS One. 2013;8. DOI:10.1371/journal.pone.0078631
- Batista BS, Eng WS, Pilobello KT, et al. Identification of a conserved glycan signature for microvesicles. J Proteome Res. 2011;10:4624–4633.
- Fukui S, Feizi T, Galustian C, et al. Oligosaccharide microarrays for high-throughput detection and specificity assignments of carbohydrate-protein interactions. Nat Biotechnol. 2002;20:1011–1017.
- Handel TM, Johnson Z, Crown SE, et al. Regulation of protein function by glycosaminoglycans-as exemplified by chemokines. Annu Rev Biochem. 2005;74 SRC-:385–410.
- Raedts J, Kengen SW, der Oost J. van Occurrence of L-iduronic acid and putative D-glucuronyl C5-epimerases in prokaryotes. Glycoconj J. 2011;28:57–66.
- Bülow HE, Hobert O. The molecular diversity of glycosaminoglycans shapes animal development. Annu Rev Cell Dev Biol [Internet]. 2006 [cited 2017 Feb 21];22:375–407. Annual Reviews. DOI:10.1146/annurev.cellbio.22.010605.093433
- Hook M, Kjellen L, Johansson S. Cell-surface glycosaminoglycans. Annu Rev Biochem. 1984;53:847–869.
- Kuschen GSV, Coulin F, Power CA, et al. Glycosaminoglycans interact selectively with chemokines and modulate receptor binding and cellular responses. Biochemistry. 1999;38:12959–12968. American Chemical Society. DOI:10.1021/bi990711d
- Balaj L. Heparin affinity purification of extracellular vesicles. Sci Rep.2015; 5:10266. DOI:10.1038/srep10266
- van Tellingen O, Yetkin-Arik B, de Gooijer MC, et al. Overcoming the blood–brain tumor barrier for effective glioblastoma treatment. Drug Resist Updat. 2015 cited 2017 May 11;19:1–12. Internet. DOI:10.1016/j.drup.2015.02.002
- Lin F, Marchetti S, Pluim D, et al. Abcc4 together with Abcb1 and Abcg2 form a robust cooperative drug efflux system that restricts the brain entry of camptothecin analogues. Clin Cancer Res [Internet]. 2013 [cited 2017 Nov 21];19:2084–2095. DOI:10.1158/1078-0432.CCR-12-3105
- Gabriely G, Yi M, Narayan RS, et al. Human glioma growth is controlled by microRNA-10b. Cancer Res [Internet]. 2011 [cited 2017 Jan 2];71:3563–3572. NIH Public Access. DOI:10.1158/0008-5472.CAN-10-3568
- Chan JA, Krichevsky AM, Kosik KS, et al. MicroRNA-21 is an antiapoptotic factor in human glioblastoma cells MicroRNA-21 is an antiapoptotic factor in human. Cancer Res. 2005;65:6029–6033.
- Wang K, Wang X, Zou J, et al. MiR-92b controls glioma proliferation and invasion through regulating Wnt/beta-catenin signaling via Nemo-like kinase. Neuro Oncol [Internet]. 2013 [cited 2017 Jan 4];15:578–588. Oxford University Press. DOI:10.1093/neuonc/not004
- Niu H, Wang K, Zhang A, et al. miR-92a is a critical regulator of the apoptosis pathway in glioblastoma with inverse expression of BCL2L11. Oncol Rep. 2012;28:1771–1777.
- Denny BJ, Wheelhouse RT, Stevens MF, et al. NMR and molecular modeling investigation of the mechanism of activation of the antitumor drug temozolomide and its interaction with DNA. Biochemistry. 1994;33:9045–9051.
- Drabløs F. Alkylation damage in DNA and RNA—repair mechanisms and medical significance. DNA Repair (Amst); 2004;3 SRC-G:1389–1407. DOI:10.1016/j.dnarep.2004.05.004.
- Friedman HS, Kerby T, Calvert H. Temozolomide and treatment of malignant glioma. Clin Cancer Res. 2000;6 SRC-G:2585–2597.
- Messaoudi K, Clavreul A, Lagarce F. Toward an effective strategy in glioblastoma treatment. Part I: resistance mechanisms and strategies to overcome resistance of glioblastoma to temozolomide. Drug Discov Today. 2015;20:899–905.
- Hiddingh L. EFEMP1 induces gamma-secretase/Notch-mediated temozolomide resistance in glioblastoma. Oncotarget. 2014;5 SRC-G:363–374.
- Hiddingh L, Raktoe RS, Jeuken J, et al. Identification of temozolomide resistance factors in glioblastoma via integrative miRNA/mRNA regulatory network analysis. Sci Rep [Internet]. 2014;4:5260.
- Beier D, Schulz JB, Beier CP. Chemoresistance of glioblastoma cancer stem cells - much more complex than expected. Mol Cancer [Internet]. 2011 [cited 2017 Dec 5];10:128. BioMed Central. DOI:10.1186/1476-4598-10-128
- Kaina B, Christmann M, Naumann S, et al. MGMT: key node in the battle against genotoxicity, carcinogenicity and apoptosis induced by alkylating agents. DNA Repair (Amst). 2007;6:1079–1099.
- Shao H, Chung J, Lee K, et al. Chip-based analysis of exosomal mRNA mediating drug resistance in glioblastoma. Nat Commun [Internet]. 2015;6:6999.
- Meckes DG, Raab-Traub N. Microvesicles and viral infection. J Virol [Internet]. 2011;85:12844–12854.
- Trkola A, Gordon C, Matthews J, et al. The CC-chemokine RANTES increases the attachment of human immunodeficiency virus type 1 to target cells via glycosaminoglycans and also activates a signal transduction pathway that enhances viral infectivity. J Virol [Internet]. 1999;73:6370–6379.
- Dragic T. HIV-1 entry into CD4+ cells is mediated by the chemokine receptor CC-CKR-5. Nature. 1996;381 SRC:667–673.
- Feng Y, Broder CC, Kennedy PE, et al. HIV-1 entry cofactor: functional cof a seven-transmembrane, receptor. Science. 1996;272 SRC:872–877.
- Deng H, Liu R, Ellmeier W, et al. Identification of a major co-receptor for primary isolates of HIV-1. Nature. 1996;381:661–666.
- Cocchi F, Devico AL, Garzinodemo A, et al. Identification of rantes, Mip-1-Alpha, and Mip-1-Beta as the major hiv-suppressive factors produced by Cd8(+) T-Cells. Science. 1995;270:1811–1815.
- Trkola A, Paxton WA, Monard SP, et al. Genetic subtype-independent inhibition of human immunodeficiency virus type 1 replication by CC and CXC chemokines. J Virol [Internet]. 1998;72:396–404.
- Cheng W. Bioinformatic profiling identifies an immune-related risk signature for glioblastoma. Neurology. 2016;86:2226–2234.
- Atai NA, Balaj L, Van Veen H, et al. Heparin blocks transfer of extracellular vesicles between donor and recipient cells. J Neurooncol. 2013;115:343–351.
- Franzen CA, Simms PE, Van Huis AF, et al. Characterization of uptake and internalization of exosomes by bladder cancer cells. Biomed Res Int. 2014;2014. DOI:10.1155/2014/619829
- Sento S, Sasabe E, Yamamoto T. Application of a persistent heparin treatment inhibits the malignant potential of oral squamous carcinoma cells induced by tumor cell-derived exosomes. PLoS One. 2016;11(2)e:148454. DOI:10.1371/journal.pone.0148454.
- Sukreet S, Zhang H, Adamec J, et al. Identification of glycoproteins on the surface of Cow’s milk exosomes that mediate the uptake of exosomes into human colon carcinoma Caco-2 Cells. The FASEB journal. 30(1):125.
- Soler D, Chapman TR, Poisson LR, et al. CCR8 expression identifies CD4 memory T cells enriched for FOXP3+ regulatory and Th2 effector lymphocytes. J Immunol [Internet]. 2006;177:6940–6951.
- Connolly S, Skrinjar M, Rosendahl A. Orally bioavailable allosteric CCR8 antagonists inhibit dendritic cell, T cell and eosinophil migration. Biochem Pharmacol. 2012;83:778–787.
- De Monte L, Reni M, Tassi E, et al. Intratumor T helper type 2 cell infiltrate correlates with cancer-associated fibroblast thymic stromal lymphopoietin production and reduced survival in pancreatic cancer. J Exp Med [Internet]. 2011;208:469–478.
- Hoelzinger DB, Smith SE, Mirza N, et al. Blockade of CCL1 inhibits T regulatory cell suppressive function enhancing tumor immunity without affecting T effector responses. J Immunol. 2010;184(12):6833-6842. DOI:10.4049/jimmunol.0904084
- Chen J, Yao Y, Gong C, et al. CCL18 from tumor-associated macrophages promotes breast cancer metastasis via PITPNM3. Cancer Cell. 2011;19:541–555.
- Li D, Duell EJ, Yu K, et al. Pathway analysis of genome-wide association study data highlights pancreatic development genes as susceptibility factors for pancreatic cancer. Carcinogenesis. 2012;33:1384–1390.
- Burkholder B, Huang R-Y, Burgess R, et al. Tumor-induced perturbations of cytokines and immune cell networks. Biochim Biophys Acta Rev Cancer. 2014;1845:182–201.
- Hood JL, San Roman S, Wickline SA. Exosomes released by melanoma cells prepare sentinel lymph nodes for tumor metastasis. Cancer Res. 2011;71:3792–3801.