
ABSTRACT
Improvements in identification and assessment of extracellular vesicles (EVs) have fuelled a recent surge in EV publications investigating their roles as biomarkers and mediators of disease. Meaningful scientific comparisons are, however, hampered by difficulties in accurate, reproducible enumeration and characterization of EVs in biological fluids. High-sensitivity flow cytometry (FCM) is presently the most commonly applied strategy to assess EVs, yet its utility is limited by variant ability to resolve smaller EVs. Here, we propose the use of 405 nm (violet) wavelength lasers in place of 488 nm (blue) for side scatter (SSC) detection to obtain greater resolution of EVs using high-sensitivity FCM. To test this hypothesis, we modelled EV resolution by violet versus blue SSC in silico and compared resolution of reference beads and biological EVs from plasma and bronchoalveolar lavage (BAL) fluid using either violet or blue wavelength SSC EV detection. Mie scatter modelling predicted that violet as compared to blue SSC increases resolution of small (100–500 nm) spherical particles with refractive indices (1.34–1.46) similar to EVs by approximately twofold in terms of light intensity and by nearly 20% in SSC signal quantum efficiency. Resolution of reference beads was improved by violet instead of blue SSC with two- and fivefold decreases in coefficients of variation for particles of 300–500 nm and 180–240 nm size, respectively. Resolution was similarly improved for detection of EVs from plasma or BAL fluid. Violet SSC detection for high-sensitivity FCM allows for significantly greater resolution of EVs in plasma and BAL compared to conventional blue SSC and particularly improves resolution of smaller EVs. Notably, the proposed strategy is readily implementable and inexpensive for machines already equipped with 405 nm SSC or the ability to accommodate 405/10 nm bandpass filters in their violet detector arrays.
Introduction
In an era of precision medicine, extracellular vesicles (EVs) are rapidly emerging as important biomarkers in cancer, sepsis, cardiovascular disease and other inflammatory disorders [Citation1–Citation3]. Beyond their association with specific disease states, EVs may in fact directly mediate and disseminate disease processes as they are capable of releasing or transferring internal or membrane-bound cargo to other cells or become incorporated directly into target cells [Citation4].
At present, clinical and preclinical studies sample a variety of biological fluids to assess EVs relevant to specific diseases. The most frequently applied method of detection of EVs remains high-sensitivity flow cytometry (FCM), due to its widespread availability and its ability to rapidly count and characterize EVs by either light scatter or fluorescence. That notwithstanding, EV detection by FCM is hampered by significant limitations. FCM was originally designed for the study of micrometre-sized cells, and its application for studying submicron particles faces several important constraints. Specifically, detection of smaller EVs is presently challenging and not standardized, with cytometers varying in their optical capabilities, sensitivities and inconsistent gating strategies. Consequently, discrimination of the smallest EVs from instrument noise/debris remains a roadblock to a more representative quantitative assessment of EVs.
To address the limited resolution of small EVs by FCM, we propose here enhancements which increase the sensitivity and resolution of smaller EV detection and as such improve the ability to detect a greater portion of EV populations in biological fluids. Specifically, we propose that side scatter (SSC) detection with 405 nm (instead of 488 nm) laser light allows greater sensitivity for EV detection using high-sensitivity FCM. Here, we demonstrate that use of violet as compared to blue laser light increases light scatter intensity and quantum efficiency (QE) of SSC detection by FCM and improves the precision in detection of reference beads and biological EV populations from mouse plasma and bronchoalveolar lavage (BAL) fluid which translated into increased capacity to resolve smaller beads and EVs over instrument noise. The innovation of using violet SSC allows for a simple, low-cost strategy to measure EVs more accurately and facilitates the detection of a greater portion of smaller EVs.
Methods
Light scatter calculations
Relative intensities of light scatter surrounding modelled small spherical particles of differing diameters, designed to simulate reference beads and biological EVs of varying sizes, were calculated using Mie scatter theory (MiePlot, Philliplaven.com, 4.5.01, with a particle refractive index [RI] of 1.39, wavelength of incident light set at the indicated wavelength in the figure, medium RI constant between samples at 1 with unpolarized light collection). The model simulates the scatter of incident laser light (wavelengths: 405 or 488 nm) from a small spherical particle and calculates scattered light intensity every 0.5° for 360° circumferentially surrounding the small modelled spherical particles.
Biological fluids for EV enumeration
Experiments for assessment of EVs from biological fluids were performed in 8–10-week-old male BALB/c mice as previously described [Citation5] and approved by the Animal Care Committee of St. Michael’s Hospital. In brief, blood was collected from anesthetized mice via 25-gauge needle puncture of the left ventricle, while BAL fluid was subsequently obtained by lavage with 1 mL normal saline.
Recovered BAL fluid or whole citrated blood was centrifuged at 600×g for 15 min at room temperature to remove cells. Next, cell-free supernatants were spun twice at 2500×g for 15 min at room temperature to remove debris. After differential centrifugation, acellular samples containing EVs underwent size exclusion chromatography (SEC) using a commercial kit as directed (iZON qEVsingle, Christchurch NZ). Post-SEC separation, EVs were diluted as described in 100 nm filtered phosphate buffered saline (PBS) for nanoparticle tracking analysis (NTA) or FCM analysis.
Flow cytometry
Latex (180, 240, 300, 500, 590 and 880 nm) and silica (110 and 500 nm) beads (Apogee Flow Systems product #1495, Hempstead, UK) or EV-containing samples were measured over 120 s using the slowest possible flow rate in a BD FACS Aria III SORP equipped with a 130 mW 488 nm laser and a 55 mW 405 nm laser (BD Biosciences, San Jose, CA, USA), a 100 µm nozzle, sheath fluid (FACS flow; BD Biosciences) pressurized at 20 pounds per square inch, no neutral density filters, a Fourier optical transformation unit and a small particle detection module. Where indicated, analyses were conducted on a BD x20 Fortessa with electronically matched laser powers of 50 mW for both 405 and 488 nm SSC such that the only variable in EV detection was laser wavelength. Laser power density for the BD Aria III 488 nm (1.53 × 10⁵ W/cm2) and 405 nm (6.92 × 10⁴ W/cm2) laser and x20 Fortessa 488 nm (3.7 × 10⁵ W/cm2) and 405 nm (2.4 × 10⁵ W/cm2) laser were calculated using focused laser spot dimensions kindly provided by BD. Cytometers were stabilized by running filtered (<200 nm) sheath fluid and sample buffer for a period of at least 30 min to minimize instrument background noise prior to measuring samples. Between measurements of bead or EV-containing samples, filtered PBS (100 nm filter) was run to prevent cross-contamination. The FACS Aria and x20 Fortessa underwent preventative maintenance and laser alignment prior to conducting experiments which included daily reassessment of quality control using the BD CST program.
Gating was performed on the BD FACS Aria III and x20 Fortessa by placing a polystyrene 800 nm bead at identical target values on 405 and 488 nm SSC and gating from this bead population down to instrument noise (Supplemental Figure 1) [Citation5]. Thresholds were set at 488 nm SSC (400 threshold) with threshold event rates <200 per second for fluorescent beads (), while for experiments involving EVs ( and , Supplemental Figure 2) thresholds were set at 488 nm SSC (400 threshold) for 488 nm SSC enumeration and 405 nm SSC (550 threshold) for 405 nm SSC enumeration of EVs. Electronic aborts never exceeded 1% of the threshold rate which was maintained at 5000/s or lower for EV sample readings. Volumetric sample acquisition rates were 35 and 50 µL/min, respectively, for the Aria III and x20 Fortessa. To test for contribution of non-EV false positives, detergent-resistant events such as immune complexes or debris were identified following selective depletion of EVs by 0.05% Triton X-100 (Sigma Aldrich, Canada). Detergent lysis reduced EV counts for all gating strategies assessed by >95%. FCM-based enumeration of EVs in diluted plasma (specific gravity 1.014 g/mL) or BAL fluid (specific gravity 1.0095 g/mL) was calculated from gravimetric consumption (EVs/μL = [# EV-gated events × specific gravity of sample medium (in g/mL)]/[∆ sample mass (in g) × 1000 μL/mL]) during sample uptake as previously described [Citation5]. Potential error due to coincident (swarm) events was effectively ruled out by serial dilutions of the EV samples (up to 10-fold higher and lower concentrations, respectively) (Supplemental Figure 2). No change in median FSC and SSC was detected between the different EV dilutions examined indicative of a lack of swarm detection.
Figure 1. Side scatter at 405 nm is superior to 488 nm lasers for detection of small spherical particles. (a) Depicts 360°computer-modelled light intensity plots for 405 nm (top; violet) and 488 nm (bottom; blue) for small spherical particles of 100, 200 or 500 nm in size (left to right). Incident laser light (405 nm: violet arrow or 488 nm: blue arrow) passes along a vector from 180° (bottom of the plot) up to the absolute centre of the plot which depicts where the modelled particle is situated. The distribution of scattered light seen (coloured contour line surrounding the modelled particle located at the centre of the plot) varied depending on the size of particle and type of laser (405 vs. 488 nm). (b) Shows the light intensity of side scatter detection at 90° for 405 nm (black bars) and 488 nm (white bars) lasers based on computer modelling for spherical 100, 200 and 500 nm particles (top to bottom) with refractive indices (RIs) of 1.34, 1.37, 1.4 and 1.46.
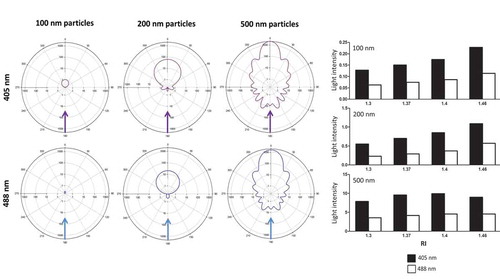
Figure 2. Use of 405 nm rather than 488 nm laser increases signal intensity over the relevant range of angles for SSC detection. (a) Displays signal intensities calculated by computer modelling (Y axes) of light scatter around small particles at the indicated particle diameters. Light scatter was modelled at a collection angle of 31.5°–148.5° which is the range over which the side scatter signal is detected (X axes) for 405 nm (black dotted lines) and 488 nm (solid grey lines). These calculations were done for 100, 200 and 500 nm sized modelled spherical small particles (left to right) with refractive indexes (RIs) of 1.34, 1.37, 1.4 and 1.46 (top to bottom). (b) Depicts the overall fold changes in area under the curve (AUC) for 405 and 488 nm wavelengths for particles ranging in size from 100, 200 and 500 nm (Y axis) with RIs of 1.37 or 1.46 (X axis).
Figure 3. Improved empiric flow cytometric resolution of microspheres by 405 nm instead of 488 nm side scatter. (a) Depicts populations of 180, 240, 300, 590 and 880 nm silica (S) or 500 nm latex (L) beads resolved by 405 nm (left panel) or 488 nm (right panel) forward scatter (FSC; X axis) and side scatter (SSC; Y axis) by flow cytometry. (B) Shows increased resolution (reduced coefficients of variation [CVs]) for 405 nm (black bars) compared with 488 nm (white bars) SSC for the beads (X axis) shown in (a). Data are depicted as mean CV ± SD, n = 4 with * representing differences between 405 and 488 nm wavelength detection of identical samples of beads with p < 0.05 as detected by two-tailed paired t-test.
![Figure 3. Improved empiric flow cytometric resolution of microspheres by 405 nm instead of 488 nm side scatter. (a) Depicts populations of 180, 240, 300, 590 and 880 nm silica (S) or 500 nm latex (L) beads resolved by 405 nm (left panel) or 488 nm (right panel) forward scatter (FSC; X axis) and side scatter (SSC; Y axis) by flow cytometry. (B) Shows increased resolution (reduced coefficients of variation [CVs]) for 405 nm (black bars) compared with 488 nm (white bars) SSC for the beads (X axis) shown in (a). Data are depicted as mean CV ± SD, n = 4 with * representing differences between 405 and 488 nm wavelength detection of identical samples of beads with p < 0.05 as detected by two-tailed paired t-test.](/cms/asset/023dc50a-fb89-4b5f-adc1-3d34fdae48f4/zjev_a_1454776_f0003_oc.jpg)
Figure 4. NTA of EVs in murine plasma and BAL fluid. Duplicate samples of EVs from both diluted mouse bronchoalveolar lavage (BAL) and plasma were each analysed by NTA independently five times for 40 s. Depicted are representative histograms of average size distributions for mouse BAL (black) and plasma (grey) as well as 100 nm calibration beads (black hashed).
Figure 5. Resolution of EV populations from biological samples of plasma and BAL were improved using 405 nm instead of 488 nm side scatter. (a) Shows representative forward- (FSC PMT-H) and side scatter (SSC-H) height dot plots showing buffer only (left plots, EVs from BAL (middle plots) and detergent-lysed BAL EVs (right plots) gated by 488 nm (top) or 405 nm (bottom) SSC-H). (b) Shows identical plots but with plasma EVs (middle plots) and detergent-lysed plasma EVs (right plots). Bar graphs in both panels (a) (BAL) and (b) (plasma) depict fold increases (relative to 488 nm SSC) in EV concentration detected with either 405 nm (black bars) or 488 nm (white bars) SSC resolved by high-sensitivity flow cytometry (BD Aria III). Data are depicted as mean ± SD, n = 5 with * representing differences between 405 and 488 nm wavelength detection of identical samples of EVs with p < 0.005 detected by two-tailed paired t-test.
Figure 6. Resolution of EV populations from biological samples of plasma and BAL were improved using 405 instead of 488 nm side scatter with identical laser power. (a) Shows representative forward- (FSC-H) and side scatter (SSC-H) height dot plots showing buffer only (left plots, EVs from BAL (middle plots) and detergent-lysed BAL EVs (right plots) gated by 488 nm (top) or 405 nm (bottom) SSC-H). (b) Shows identical plots but with plasma EVs (middle plots) and detergent-lysed plasma EVs (right plots). Bar graphs in both panels (a) (BAL) and (b) (plasma) depict fold increases (relative to 488 nm SSC) in EV concentration detected with either 405 nm (black bars) or 488 nm (white bars) SSC resolved by high-sensitivity flow cytometry (BD x20 Fortessa with electronically matched laser power for 405 and 488 nm). Data are depicted as mean ± SD, n = 5 with * representing differences between 405 and 488 nm wavelength detection of identical samples of EVs with p < 0.005 detected by two-tailed paired t-test.
Nanoparticle tracking analysis
Duplicate samples of BAL and plasma EVs diluted 1:100 in filtered PBS (100 nm filter) were manually analysed at room temperature (22°C) in 40 s intervals from five separate fields of view per sample using NanoSight standard analysis routine by an LM10 NTA equipped with a 65 mWatt 405 nm violet laser, sCMOS camera (camera level 5, slider shutter 45 and slider gain of 15) and NTA 3.1.46 software (Malvern Instruments Inc., Saint-Laurent, QC). Processing settings consisted of signal gain of 10 and detection threshold settings of 5. For size calibration, 100 nm polystyrene latex microspheres (NTA4088; Malvern Instruments Inc.) were used.
Statistical analysis
Data are given as mean ± standard deviation (SD). Comparisons were performed by two-tailed unpaired Student’s t-testing for two groups or two-way analysis of variance for multiple groups using Prism software 5.00 (GraphPad Software, CA, USA). Significance was assumed at p < 0.05.
Results
EV detection with 405 nm SSC provides superior light scatter signal from small particles in silico
Detection of EVs by FCM is challenging due to their small size, in particular due to the fact that EV diameters are often smaller than the wavelength of incident light used to detect them by FCM. Consequently, we probed whether shorter wavelengths (405 nm) instead of commonly used 488 nm light sources may be advantageous for the detection of particles of different sizes. Light scatter intensity surrounding 100, 200 and 500 nm sized spherical particles was calculated for either 405 or 488 nm lasers. In these models, incident laser light interacts with a small particle located in the centre of the circular plots and is scattered around the particle according to Mie scatter theory. Each concentric circle surrounding the particle represents a logarithmic decade of light scatter intensity. The resulting plots represent an in silico diagram of the intensity of scattered laser light over a 360° circumference around the scattering particle. In addition to 405 vs. 488 nm laser light wavelengths, different RIs, selected based on a range encompassing EVs and reference materials, were tested within this model. The results from this simulation suggest increased signal detection (sensitivity) with 405 nm as compared to 488 nm laser light for 100, 200 and 500 nm spherical particles, with the advantage being more pronounced at smaller particle sizes ()). At a SSC detection angle of 90°, 405 nm lasers resulted in a signal increase by approximately twofold over 488 nm lasers for all particles examined ()). In addition to improving signal intensity, use of 405 nm lasers also increases the QE for signal detection by photomultiplier tube (PMT) detectors. The ability of PMTs to detect scattered light and resolve submicron particles relies on the QE which based on intrinsic PMT specifications was 18% higher for 405 (25.1%) compared with 488 (21.2%) nm wavelength lasers in the present setup.
For angles of detection pertinent to FCM SSC detection 405 nm laser light results in increased signal detection
SSC measurements of EVs and submicron beads are collected over a wide angle via a high numerical aperture lens orthogonal to the flow cell and incident laser light. To quantify how much scattered light (signal) is gathered by the SSC assembly, total SSC signal intensity was determined by integrating the area under the curve for the SSC signal intensity gathered from 31.5° to 148.5° (angle of collection on the FACS Aria III SORP instrument used – personal communication BD engineering) for light sources of either 405 or 488 nm. Calculations were again made using Mie scatter theory for spherical particles of three different sizes (100, 200 and 500 nm) and four different RIs (1.34, 137, 1.4 and 1.47) as described above. SSC signals were consistently higher for 405 nm instead of 488 nm wavelength detection (), with the greatest fold increases in total light intensity signal for 405 nm in comparison to 488 nm lasers occurring for the smallest modelled particles (100 nm > 200 nm > 500 nm) for all RIs examined.
Resolution of reference beads is increased with 405 nm in comparison to 488 nm wavelength SSC gating
To assess the resolution of commonly used EV gating particles, silica and latex spherical reference beads ranging in size from 180 to 880 nm were resolved by SSC FCM employing both 405 and 488 nm laser sources. The use of 405 nm wavelength instead of 488 nm laser allowed for improved precision in measuring bead populations via FCM, evident as more discrete bead populations which were consequently more easily resolved from each other or instrument noise () as evidenced by markedly reduced coefficients of variation (CVs) for populations of 180, 240, 300, 500, 590 and 880 nm beads for 405 nm in comparison to 488 nm. The reduction in CV was particularly prominent for smaller as compared to larger beads and reached statistical significance for the smallest beads (180 and 240 nm, respectively) examined in line with the results from the Mie scatter theory models predicting improvement in resolution specifically for detection of small particles.
Resolution of biological EV populations is increased with 405 nm in comparison to 488 nm wavelength SSC gating
While resolution of small particles should be theoretically increased at 405 nm and reference beads offer a means of quantifying improved resolution at submicron sizes, the most critical comparison relates to the specific resolution of relevant biological EV populations. EVs are mostly smaller in diameter than the incident wavelength (488 or 405 nm) used for FCM detection. NTA of murine BAL (2.24 × 10¹⁰ ± 6.0 × 10⁸ EV/mL) and plasma (8.24 × 10¹⁰ ± 2.4 × 10⁸ EV/mL) EV samples revealed mean EV sizes of 212.8 ± 2.6 nm and 171.3 ± 3.2 nm, respectively (), thus verifying the notion that the majority of EVs in biological fluids fall below the incident wavelength of light used to detect them by conventional FCM. Consequently, this predicts that use of a smaller wavelength of light (i.e. 405 nm) for EV discrimination would detect a disproportionately larger population of EVs undetectable at 488 nm. We therefore next enumerated EVs in the identical murine plasma and BAL samples by FCM using either 405 or 488 nm SSC laser light. In both biological samples, use of 405 as compared to 488 nm laser light increased EV counts by approximately twofold (). However, while the increased count of EVs as a consequence of improved resolution of EVs from instrument noise using 405 nm SSC was apparent, it should be considered that on the Aria III SORP used for these measurements, the 405 nm laser operates at 50 mW and the 488 nm laser is 130 mW. As these confounding factors hamper direct comparison between the two wavelengths [Citation5], we therefore used an x20 Fortessa cytometer with matched laser powers, thus reducing variability in measured SSC signal due solely to differences in photon illumination between 405 and 488 nm SSC measurements. Consequently, using the x20 Fortessa with matched laser power, significantly higher EV counts were detected in both plasma and BAL fluid at 405 nm SSC than 488 nm SSC (), with fold changes in excess of those seen with the Aria III ().
Discussion
Here, we propose the use of 405 nm as compared to conventional 488 nm SSC laser light as an easy and cost-effective implementation to increase detection of EVs in biological fluids by FCM. Simulations based on Mie light scatter theory predict 405 nm (violet) instead of 488 nm (blue) wavelength SSC detection of submicron particles by FCM improves EV measurements by: (a) generating significantly more intense light scatter signals (increased signal to noise); (b) exploiting the advantages of increased detector QE to violet laser light; (c) increasing the precision in EV population measurements (lower EV population CVs); and (d) consequently increasing resolution of smaller EVs over instrument noise. The modelled improvement of submicron particle resolution was apparent across a range of relevant RIs related to current gating aids and EVs [Citation5–Citation7]. In actual experiments, this improvement was verified when utilizing reference beads as well as EV populations and was particularly prominent for smaller particle sizes. Latex or silica beads ranging in size from 180 to 880 nm had improved resolution at 405 nm as compared to 488 nm in terms of significantly reduced CVs at smaller bead sizes. EVs isolated from mouse plasma or BAL fluid were also detected with greater resolution at 405 nm. The improved detection of smaller sized particles by 405 nm SSC is particularly advantageous for detection of biological EVs as their size distribution is characteristically left-shifted towards smaller diameters as seen by NTA analysis of the murine plasma and BAL samples examined.
Limitations of FCM for measurement of EVs
Studying EVs can involve a wide variety of detection methods, yet one of the most popular and accessible techniques remains FCM. Current-generation high-sensitivity flow cytometers can detect EVs, but fundamental limitations such as challenges in effectively discriminating small EVs from the threshold of instrument noise provides confounding false-positive events for small particle detection and impacts the ability to accurately enumerate EVs due to poor representative sampling of the true EV population. These limitations have fuelled the need for technical advances that may reduce the discrimination threshold between genuine EV events and instrument noise at the lower end of the EV gate, thereby improving measurement sensitivity and detectability of smaller EV populations. For detection of particles of greater diameter than the excitation wavelength of laser light used by FCM such as cells (≫ 405 nm–488 nm) scattering of laser light is robust. However, as particles approach diameters at or below the wavelength of detection light sources, light scatter becomes critically limited. For these scenarios, Mie theory predicts that utilization of shorter wavelengths should significantly increase light scattering and allow for enhanced signal intensity and improved particle resolution.
Violet is superior to blue SSC for detection of small spherical particles
Simulations based on Mie theory indicated that 405 nm was superior to 488 nm SSC detection for spherical 100, 200 and 500 nm particles with differing RIs. Of importance, the advantage seen by computer modelling involving the smaller wavelength SSC (405 nm) was amplified for smaller particles, which is important considering EVs are typically <400 nm and the size distribution is typically left-shifted towards smaller particle sizes. Also relevant to the study of EVs and their gating aids, the benefits with 405 instead of 488 nm SSC detection were seen with small modelled spheres across a range of RIs relevant to characteristic FCM EV reference materials and biological EVs. RIs vary between types of particles based on their composition [Citation8]. Calculations from NTA studies utilizing Mie theory reveal that smaller EVs have RIs in the range of 1.37–1.39, whereas larger EVs (>200 nm) were seen to have RIs >1.4 [Citation6]. Beads typically have higher RIs (1.47–1.63) which more closely resemble lipoproteins, various types of viruses or protein aggregates than biological EVs [Citation6,Citation8]. With this in mind, we assessed RIs ranging from 1.34 to 1.46 to encompass typical ranges for EVs and reference materials. The findings from the modelling of spheres of different sizes with different RIs revealed distinct advantages of violet over blue SSC detection for both reference materials and EVs.
Violet is superior to blue SSC for detection of beads
The enhanced SSC signal detection at shorter wavelengths was equally evident for EV gating aids such as silica and latex beads of 180–880 nm in diameter. For all tested beads, SSC detection revealed consistent benefit with the use of violet as compared to blue laser, and the increased sensitivity and resolution (lower CVs) at 405 nm were again consistently more pronounced at smaller particle sizes. In particular, the smallest beads examined (180 nm) were poorly resolved from background instrument noise by 488 nm laser and only became a discrete population separate from instrument noise when resolved by 405 nm laser light. The use of 405 nm SSC detection was advantageous in terms of increased sensitivity and precision for detection over a wide variety of beads in terms of sizes, composition and thus differing RIs as 405 nm laser-resolved beads had smaller distributions in terms of FSC and SSC spread with less overlap with different populations of beads (differing in size and composition) as seen with 488 nm laser-resolved beads. Beads are commonly used to define boundaries in terms of FSC and SSC for EV detection by FCM [Citation5,Citation9], which is crucial for their accurate characterization and semi-quantitative enumeration. Considering the differences in resolution of beads at different wavelengths of illumination, we wish to further reiterate that signal intensity will also be affected in different flow cytometers based on their optics and angles of light collection. Consequently, beads will scatter light and generate signals dependent in part on their size but also the cytometer-specific optics, laser wavelength used and the RI of the bead material. Since EV RIs are very different than reference bead materials, we wish to highlight the need for caution when defining EV gates using “reference” beads. Reduced CVs associated with improved resolution of reference bead populations at 405 nm as compared to 488 nm can increase confidence in establishing EV gating for beads at least as small as 180 nm. After having validated the results from in silico simulation based on Mie theory experimentally in reference beads, we next tested biological EVs themselves at both wavelengths of SSC detection.
Violet is superior to blue SSC for detection of EVs
Utilization of 405 nm as compared to 488 nm SSC detection markedly increased precision allowing increased resolution of EVs leading to higher numbers detected in typical biological samples such as plasma and BAL fluid. To our knowledge, this is the first description of the expanded capacity to detect EVs by FCM with 405 nm- instead of 488 nm-based SSC detection. Notably, other systems designed for EV detection such as NTA commonly use 405 nm wavelength light to detect EVs [Citation8,Citation10]; however, this principle had so far not been applied to FCM. Size histograms of EVs as generated by NTA for plasma and BAL fluid showed characteristic left-skewed distributions to smaller particles in line with previously published EV sizing studies [Citation11–Citation15]. Since the benefits of 405 nm SSC detection were most pronounced for the smallest spherical particles or gating beads examined, respectively, we consider the increased number of EVs detected by 405 nm as compared to 488 nm laser light to reflect predominantly smaller particles which were not accessible for measurement by 488 nm SSC detection. By expanding the lower end of detection of EVs by high-sensitivity FCM at 405 nm, SSC allows for a greater proportion of the EV populations to be detected and thus for a more representative assessment of the true EV population.
Though 405 nm SSC detection does not solve the issue of standardization of EV detection strategies, it does improve resolution to detect more of the abundant, smaller EVs and lower end gating aids at a higher degree of precision (demonstrated by lower CVs). Just as beads offer strategies to define the upper size limit for EVs [Citation5], new emerging gating aids such as lipid bilayer microspheres and nanoerythrosomes offer advantages of smaller sizes and RIs similar to EVs [Citation5,Citation7]. Even with these new gating strategies available, however, the exact discrimination between genuine EV events and instrument noise remains the predominant challenge, in particular, for smaller EV sizes where EVs are most abundant. Until an effective lower gating aid (reviewed in [Citation7]) is found, investigators are limited to semi-quantitative and relative fold-change observations of EVs.
The present study offers an accessible and inexpensive means to significantly expand the limits of EV detection. While some conventional flow cytometers can have dedicated 405 nm SSC channels (such as the Beckman Coulter Cytoflex or Life Technologies Attune nxt), other high-sensitivity flow cytometers can be inexpensively adapted to accept 405 nm SSC. For example, instruments capable of accepting 405/10 bandpass filters in an appropriate position in the detector array (most commonly by substituting the shortest wavelength detector on the violet laser line or the “BV421” channel on most BD instruments) can immediately be converted into using violet SSC as was done in the current study with a BD FACS Aria III SORP instrument. This simple enhancement at minimum can lead to improved sensitivity and accuracy for observation of EVs from commonly studied biological fluids such as plasma and BAL fluid and may help improve sensitivity of modern FCM platforms to allow consideration of novel small lower end gating aids for EV detection which are needed to allow greater standardization of FCM EV observations.
supplemental_files.zip
Download Zip (354.1 KB)Acknowledgements
MJM was supported by a CIHR Vanier Scholarship. We also wish to acknowledge Dr Eugene Park for his assistance in data analysis.
Disclosure statement
No potential conflict of interest was reported by the authors.
Supplementary materials
Supplemental data for this article can be accessed here.
Additional information
Funding
Related Research Data
References
- Nawaz M, Camussi G, Valadi H, et al. The emerging role of extracellular vesicles as biomarkers for urogenital cancers. Nat Rev Urol. 2014;11(12):1–11.
- Ban LA, Shackel NA, McLennan SV. Extracellular vesicles: a new frontier in biomarker discovery for non-alcoholic fatty liver disease. Int J Mol Sci. 2016;17(3):376.
- Tannetta D, Masliukaite I, Vatish M, et al. Update of syncytiotrophoblast derived extracellular vesicles in normal pregnancy and preeclampsia. J Reprod Immunol. 2017;119:98–106.
- McVey M, Tabuchi A, Kuebler WM. Microparticles and acute lung injury. Am J Physiol Lung Cell Mol Physiol. 2012;303(5):L364–L381.
- McVey MJ, Spring CM, Semple JW, et al. Microparticles as biomarkers of lung disease: enumeration in biological fluids using lipid bilayer microspheres. Am J Physiol Lung Cell Mol Physiol. 2016;310(9):L80–L84.
- Gardiner C, Shaw M, Hole P, et al. Measurement of refractive index by nanoparticle tracking analysis reveals heterogeneity in extracellular vesicles. J Extracell Vesicles. 2014;3:25361.
- Valkonen S, van der Pol E, Boing A, et al. Biological reference materials for extracellular vesicle studies. Eur J Pharm Sci. 2017;15(98):4–16.
- van der Pol E, Coumans FA, Sturk A, et al. Refractive index determination of nanoparticles in suspension using nanoparticle tracking analysis. Nano Lett. 2014;14(11):6195–6201.
- Rousseau M, Belleannee C, Duchez AC, et al. Detection and quantification of microparticles from different cellular lineages using flow cytometry. Evaluation of the impact of secreted phospholipase A2 on microparticle assessment. PLoS One. 2015;10(1):e0116812.
- Dragovic RA, Gardiner C, Brooks AS, et al. Sizing and phenotyping of cellular vesicles using nanoparticle tracking analysis. Nanomedicine. 2011;7(6):780–788.
- Arraud N, Gounou C, Linares R, et al. A simple flow cytometry method improves the detection of phosphatidylserine-exposing extracellular vesicles. J Thromb Haemost. 2015;13(2):237–247.
- Arraud N, Gounou C, Turpin D, et al. Fluorescence triggering: a general strategy for enumerating and phenotyping extracellular vesicles by flow cytometry. Cytometry A. 2016;89(2):184–195.
- Gyorgy B, Modos K, Pallinger E, et al. Detection and isolation of cell-derived microparticles are compromised by protein complexes resulting from shared biophysical parameters. Blood. 2011;117(4):e39–e48.
- van der Pol E, Coumans F, Varga Z, et al. Innovation in detection of microparticles and exosomes. J Thromb Haemost. 2013;11(Suppl 1):36–45.
- van der Pol E, Hoekstra AG, Sturk A, et al. Optical and non-optical methods for detection and characterization of microparticles and exosomes. J Thromb Haemost. 2010;8(12):2596–2607.