
ABSTRACT
Newts can regenerate amputated limbs and cardiac tissue, unlike mammals which lack broad regenerative capacity. Several signaling pathways involved in cell proliferation, differentiation and survival during newt tissue regeneration have been elucidated, however the factors that coordinate signaling between cells, as well as the conservation of these factors in other animals, are not well defined. Here we report that media conditioned by newt limb explant cells (A1 cells) protect mammalian cardiomyocytes from oxidative stress-induced apoptosis. The cytoprotective effect of A1-conditioned media was negated by exposing A1 cells to GW4869, which suppresses the generation of extracellular vesicles (EVs). A1-EVs are similar in diameter (~100–150 nm), structure, and share several membrane surface and cargo proteins with mammalian exosomes. However, isolated A1-EVs contain significantly higher levels of both RNA and protein per particle than mammalian EVs. Additionally, numerous cargo RNAs and proteins are unique to A1-EVs. Of particular note, A1-EVs contain numerous mRNAs encoding nuclear receptors, membrane ligands, as well as transcription factors. Mammalian cardiomyocytes treated with A1-EVs showed increased expression of genes in the PI3K/AKT pathway, a pivotal player in survival signaling. We conclude that newt cells secrete EVs with diverse, distinctive RNA and protein contents. Despite ~300 million years of evolutionary divergence between newts and mammals, newt EVs confer cytoprotective effects on mammalian cardiomyocytes.
Responsible editor Elena Aikawa, Harvard Medical School, USA
Introduction
Newts are semi-aquatic amphibians that are members of the salamander family and, unlike mammals, can regenerate lost organs and tissues. In fact, adult newts are able to regenerate entire limbs, jaws, retina and significant portions of their hearts following damage. This remarkable ability relies on the plasticity of newt cells to dedifferentiate, proliferate and redifferentiate into appropriate cell types [Citation1]. The regeneration of lost cardiac tissue is of particular interest, as adult mammals cannot do so [Citation2–Citation6]. The mediators of regeneration in newts are largely unknown; however, secreted factors, such as newt Anterior Grade protein, have been shown to be required for limb regeneration [Citation7]. Additionally, conditioned media from either newt myogenic precursor cells (A1) or from primary cell cultures derived from regenerating limb tissues cross-react with C2C12 mouse myoblasts in culture, inducing differentiated myotubes to re-enter the cell cycle [Citation8,Citation9]. Secreted factors in conditioned media often include extracellular vesicles (EVs), which are nano-sized, lipid bilayer particles that deliver RNA, lipids and proteins to recipient cells and can modulate their morphology and behaviour [Citation10]. However, cells from newts and other urodeles have not been previously shown to secrete EVs. As EVs have the potential to confer cytoprotective and proliferative effects on differentiated cells, we sought to determine if newt A1 cells secrete factors that could induce proliferation or promote apoptotic resistance in mammalian cardiomyocytes, and to assess whether these therapeutic effects are attributable to EVs within the cultured newt cell media. We find that A1-conditioned media induces a protective, but not proliferative, effect on mammalian cardiomyocytes in culture, and that this bioactivity is lost when the media are depleted of EVs. Analysis of the A1-EV cargo contents revealed several RNA and protein candidates that may contribute to the cardioprotective abilities of newt EVs. Preliminary reports have appeared in abstract form [Citation11,Citation12].
Methods
Cell culture and EV purification
A1 cells derived from normal hind limb of Notophthalmus viridescens were obtained from Dr Craig M. Crews’ lab at Yale University. The cells, which are naturally immortal, were maintained in culture and cellular identity confirmed using the well-characterized 22/18 blastemal marker antibody as previously described [Citation13,Citation14]. The cells were cultured on gelatin-coated flasks in minimum essential media (MEM) supplemented with 10% heat inactivated fetal bovine serum (FBS) (Gibco), 10 μg/ml insulin (Sigma), 100 U/ml antibiotics (Penicillin/Streptomycin, Gibco) and 2 mM l-glutamine (Gibco) [Citation14]. After reaching ~80% confluency, the cells were serum starved for 3 days. For EV inhibition studies, we added increasing amounts of the drug GW4869 (Sigma) suspended in dimethyl sulfoxide (DMSO) using a stock concentration of 5 mM. The GW4869 treatments were applied to complete media for 12 h to suppress EV generation. Then the media was changed to serum free and the A1s treated for an additional 48 h to serum-free media plus GW4869. EVs were collected from cell supernatant by a series of centrifugation and filtration steps [Citation15]. Briefly the supernatant was centrifuged at 3200 ×g for 20 min followed by a centrifugation at 10,000 ×g for 30 min at 4°C to remove cell debris. For the assessment of RNA and protein cargo, A1-EVs were isolated from the media by ultrafiltration centrifugation (Amicon Ultra, 100 kDa molecular weight cut off (MWCO), Millipore) or polyethylene glycol (PEG) precipitation (ExoQuick-TC, SBI) overnight at 4°C. The PEG-treated A1 media was centrifuged at 830 ×g for 10 min to isolate the EV pellet. For cardiomyocyte treatment, A1-conditioned media was concentrated approximately tenfold using Ultrafiltration modules (Amicon Ultra, 100 kDa MWCO, Millipore). Cardiosphere-derived cells (CDCs) and normal human dermal fibroblasts (NHDFs) cells were plated on fibronectin (FN)-coated dishes in Iscove's Modified Dulbecco's Medium (IMDM) supplemented with 20% FBS (Gibco) growth media. After reaching ~80% confluency, the cells were serum starved for 3 days and the supernatant processed as described above.
Cardiomyocyte proliferation and apoptosis assays
Neonatal rat ventricular myocytes (NRVMs) were isolated from P2 neonatal Sprague-Dawley rats as previously described [Citation16]. The cells were plated on FN-coated 6-well plates at a density of 1.5 million cells/well in DMEM containing 10% FBS (Gibco) media and incubated at 37°C, with 5% CO2 for 24 h. Following washing with serum-free DMEM, the cells were incubated with 100, 250 or 500 µg A1 cell conditioned media (A1-CM) components in NRVM media or NRVM media control for 48 h in the presence of 10 µM 5-Bromo-2ʹ-deoxyuridine (BrdU) (Sigma). The cells were harvested and briefly fixed in 4% paraformaldehyde (PFA). Cells were permeabilized and stained with fluorescein isothiocyanate (FITC)-conjugated anti-BrdU antibody (BD Pharmingen, cat# 347580) and Phycoerythrin (PE)-conjugated anti-α-sarcomeric actin antibody (Miltenyi, cat# 130-106-937). The cardiomyocyte apoptosis assays were performed by treating NRVMs with 100 µg of A1-CM in NRVM media for 12 h. The NRVMs were then treated with 50 μM H2O2 for an additional hour. The cells were harvested and fixed in 4% PFA. The intact cells were then stained with an anti-annexin V antibody (1:50, Abcam, cat# ab108194). After thorough washing in phosphate-buffered saline (PBS) and an additional fixation step using 4% PFA, the cells were permeabilized and then stained with Alexa-488 goat anti-rabbit secondary antibody and a PE-conjugated anti-α-sarcomeric actinin antibody (1:50, Miltenyi, cat# 130-106-937) to identify cardiomyocytes. The cells were analysed using a Cyan flow cytometer (BD Biosciences) and data analysed using FlowJo software.
NRVM RNA isolation and signalling pathway analysis
NRVMs were isolated by collecting ventricle tissue from 2-day old rat pups as described [Citation16]. NRVMs in culture were treated with 250 μg of A1-EVs or media-only control for 12 h and then washed away with PBS. Total RNA was isolated from NRVM culture using RNeasy Mini kit (Qiagen) and RNA sequencing (RNA-Seq) was performed (Illumina). Ingenuity Pathway Analysis (IPA, Qiagen) was used to identify the canonical pathways activated in A1-EV-treated NRVMs relative to control-treated controls. We report on the pathways associated with cardiomyocyte proliferation and cytoprotection showing statistically significant findings where −log (p-value) is greater than 1.3; p-value <0.05. The z-score statistic was used to assess the statistical significance of an observed number of “activated” and “inhibited” genes in order to predict the overall activation state of a given signalling pathway. Z-scores greater than +2 or less than −2 were considered significant in the analysis. Ratios for each of the canonical pathways were calculated as the number of genes included in the canonical pathway divided by the total number of genes that constitute the pathway. For the phosphoinositide 3-kinase/protein kinase B (also known as AKT) (PI3K-AKT) signalling pathway PCR array experiments, total RNA was isolated from the untreated or newt A1-CM-treated NRVMs following 12-h post-treatment using standard Trizol extraction methods (Qiagen). First strand cDNA was synthesized using the RT2 First Strand Kit (SA Biosciences). Gene-specific qPCR arrays for PI3K-AKT Signalling (catalog # PARN-058Z) were purchased from SA Biosciences and qPCR was performed using SYBR Green on an ABI 7900HT detection system. Housekeeping genes present on the qPCR arrays were used to normalize gene expression levels using standard ΔΔCt methods [Citation17].
EV particle characterization
The number and size of the EV particles were evaluated using nanoparticle tracking analysis methods on a NanoSight NS-300 (Malvern), instrument per manufacturer’s instructions. Acetylcholinesterase (AChE) enzymatic assays were performed using fluorescent enzymatic assays (Fluorocet kit, SBI). The protein quantification was performed using the Quick Start™ Bradford Protein Assay (Bio-Rad). The exosome RNA concentration was determined by NanoDrop UV spectroscopy (Thermo Scientific).
Western Blots, FACS bead assays and single particle profiling
Cellular and EV protein lysates were made using radioimmunoprecipitation assay buffer (RIPA) lysis buffer (Thermo) plus the HALT protease inhibitor cocktail (Thermo) and prepared for sodium dodecyl sulfate polyacrylamide gel electrophoresis (SDS PAGE) separation. Protein quantification of the lysates was performed using a BCA protein assay kit (Thermo Scientific). A total amount of 30 μg of proteins per well were separated on 4–12% SDS-polyacrylamide gels in quadruplicate and transferred onto nitrocellulose blotting membranes (Bio-Rad). Blocking of the membranes was performed using 5% non-fat milk in PBS containing 0.5% Tween 20. NRVM cellular blots for AKT were probed using 1:1000 dilutions of the following Cell Signalling rabbit antibodies: phospho-AKT (S473, #4060S), total AKT (#4691S) and β-actin Mouse mAb antibody (Invitrogen, #MA5-11869 clone [8H10D10]). Horseradish peroxidase (HRP)-conjugated secondary anti-rabbit antibody (Cell Signalling, cat# 7074S) and anti-mouse secondary antibody (Cell Signalling, cat# 7076S) were used at a 1:4000 dilution. Quantitative blot analyses were performed using Image J (NIH). EV blots were probed with the following primary antibodies using a 1:1000 dilution: Mouse monoclonal [A6.1] to Thrombospondin (TSP; Abcam, cat# ab1823), Rabbit polyclonal to Periostin (POSTN; Abcam, cat# ab92460), Mouse monoclonal anti-FN Antibody [DH1] (Millipore, cat# MAB1940), Mouse monoclonal anti-CD9 Antibody [Ts9] (Thermo, cat# 10626D), Rabbit polyclonal anti-Actin antibody (Sigma, cat# A2066) and Mouse monoclonal anti-Hsp70 antibody [5A5] (Abcam, cat# ab2787). Following washing with TBS-Tween buffer and incubation with appropriate HRP-labelled secondary antibodies, protein detections were performed using ECL kit (Thermo Scientific). Analysis of EV surface proteins by flow cytometry with magnetic bead capture (MagCapture™ Exosome Kit, WAKO) was performed and quantitated using the same detection antibodies used in the Western blots with appropriate fluorescent secondary antibodies. EV protein markers were additionally characterized using a Miltenyi MACSQuant single particle microflow instrument and analysed for known EV protein markers TSP (Abcam cat# ab1823), POSTN (Abcam cat# ab172615), FN 1 (Abcam cat# ab198933), CD63 (Miltenyi cat# 130-100-158), CD9 (Miltenyi cat# 130-103-989) and CD81 (Miltenyi cat# 130-107-981). Briefly, approximately 104 EVs were stained with 5 ng primary antibody for 1 h at 4°C and subjected to flow analysis or secondary antibody detection (where needed) was added using a DyLight-488 goat anti-rabbit (Sigma cat# 16-237) at 100 ng and further incubated for 1 h at 4°C before flow analysis.
EV protein preparation and proteomic analysis
Newt A1-cell derived EVs were isolated by UFC or precipitated as described above and the pellets washed three times with sterile PBS. Lysis of the exosome pellets were performed by adding 2% SDS, 1× Protease-Inhibitor and a sonication for 20 min with 10 s on/off cycles at an amplitude of 70% was performed, followed by acetone precipitation and then reduction using 1 mM tris(2-carboxyethyl)phosphine (TCEP). The samples were then alkylated with 5 mM iodoacetamide and digested with ~1:40 Trypsin-LyC (Promega), desalted and speedvac to total dryness. Liquid chromatography MS/MS was carried out on a Dionex Ultimate 3000 NanoLC connected to an Orbitrap Elite (Thermo Fisher) equipped with an EasySpray ion source. The mobile phase A was comprised of 0.1% aqueous formic acid and mobile phase B of 0.1% formic acid in acetonitrile. Peptides were loaded onto the analytical column (PepMap RSLC C18 2 µm, 100 Å, 50 µm i.d. × 15 cm) at a flow rate of 300 nL/min using a linear AB gradient composed of 2–25% A for 185 min, 25–90% B for 5 min, then and isocratic hold at 90% for 5 min with re-equilibrating at 2% A for 10 min. Temperature was set to 40°C for both columns. Nano-source capillary temperature was set to 275°C and spray voltage set to 2 kV. MS1 scans were acquired in the Orbitrap Elite at a resolution of 60,000 FWHM with an AGC target of 1 × 10⁶ ions over a maximum of 500 ms. MS2 spectra were acquired for the top 15 ions from each MS1 scan in normal scan mode in the ion trap with a target setting of 1 × 10⁴ ions, an accumulation time of 100 ms, and an isolation width of 2 Da. Normalized collision energy was set to 35% and one microscan was acquired for each spectra. Preparative data analysis and peptide identification search were performed using the raw MS/MS files after they were converted to mzXML using MSConvert. The mzXML files were searched against the Swiss-Prot reviewed human FASTA database (33,330 proteins and decoys) using the COMET, X! Tandem native and X! Tandem k-score search algorithms [Citation18,Citation19]. Target-decoy modelling of peptide spectral matches was performed with peptide prophet [Citation20] using the following criteria: fragment tolerance: 1.00 Da; parent tolerance: 0.040–0.160 Da; fixed modification: +57 on C (carbamidomethyl); variable modification: +16 on M (oxidation); enzyme: trypsin with three max missed cleavages. Post-search analysis was performed using Scaffold 3 version 1.4.1 (Proteome Software, Inc., Portland, OR, USA) with protein and peptide probability thresholds set to 95% and peptides with a probability score of >95% from the entire experimental data set were imported into Skyline software [Citation21] to establish a library for quantification of precursor extracted ion intensities (XICs). Precursor XICs from each experimental file were extracted against the Skyline library, and peptide XICs with isotope dot product scores >0.8 and a minimum of two peptides per protein were filtered for final protein identification. Proteomic analysis for biological process identification of the newt A1-EV proteome was performed using Fundamental Enrichment analysis software that simultaneously queries multiple databases that are integrated from heterogeneous genomic and proteomic resources [Citation22].
EV RNA preparation and Next-generation sequencing
RNA was extracted from newt and human-derived CDC and NHDF EVs using the RNeasy Mini kit (Qiagen) per manufacturer’s instructions. The RNA yields were quantitated by NanoDrop A260 for overall recoveries. A total amount of 1 μg RNA was used to generate Illumina-compatible libraries for deep sequencing at UCLA sequencing core facility. Two biological replicates for each group were processed and sequenced as technical replicates using a single-end 50 bp read setting. Bioinformatics for RNA type abundance was performed using the specialized exosome RNA analysis pipeline on the Maverix Biomics platform as described previously [Citation23]. Sequence mapping was performed on the human genome, as no newt annotated genome build was available at the time.
EV RNA and protein cargo type comparisons
Approximately 200 ng EV RNA from newt A1-, CDC- or NHDF-EVs were used to generate Illumina sequencing libraries and sequenced on a HiSeq 2500 instrument using a single-end 50 bp read setting. The resulting read data were filtered and analysed using the Maverix Biomics exosome RNA analysis pipeline as described in [Citation23]. Pie graphs were generated to display the relative RNA type abundances in each of the EVs sequenced. Newt A1-, human CDC- or human NHDF-EVs mass spec proteomic data are displayed in pie graph form according to known biological processes for comparisons using Fundamental Enrichment Analysis software [Citation22].
Statistical analysis
All data are presented as mean ± SEM. Student’s unpaired t-test or one-way ANOVA was used for comparisons between two groups unless otherwise noted. A value of p < 0.05 was considered significant.
Results
Factors in A1 cell media confer cytoprotection on mammalian cells
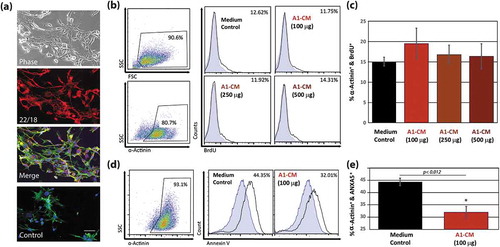
The A1 myogenic mesenchymal cell line from the hind limb of N. viridescens newt was expanded as described [Citation24]. Consistent with previous descriptions [Citation13,Citation14], A1 cells in culture demonstrated fibroblast-like morphology and stained positive for the blastemal marker 22/18 ()). A1-CM is known to induce mammalian skeletal myoblast dedifferentiation along with re-entry into the cell cycle, but with limited cell proliferation [Citation8,Citation9]. We explored whether newt A1-CM would elicit proliferative and/or cytoprotective responses in NRVMs [Citation15,Citation25]. The addition of increasing amounts of A1-CM to NRVMs, concurrent with BrdU to measure DNA synthesis, did not induce NRVM proliferation 48 h post-treatment (). We then tested whether A1-CM can protect NRVMs against oxidative stress. NRVMs were exposed to A1-CM for 12 h after which 50 µM hydrogen peroxide was added to the media and the culture was incubated for 1 h [Citation26]. FACS analysis of A1-media-exposed NRVMs () revealed a significant cytoprotective effect as measured by decreased surface levels of the early apoptotic marker annexin V, when compared to control media (12% reduction, p < 0.012).
Figure 1. The effects of A1 conditioned media on mammalian cardiomyocyte proliferation and apoptosis. (a) Representative images of newt-derived A1 cells in culture. Images showing phase contrast (top panel), fluorescent images using an established A1 marker 22/18 alone (second panel), or a fluorescent channel overlay of the 22/18 marker (red), FITC-phalloidin (green) and DAPI (blue) (third panel). To rule out auto-fluorescence, the overlay was regenerated without the 22/18 primary antibody, but including the TRITC-conjugated secondary antibody (red), FITC-phalloidin (green) and DAPI (blue), lower panel. (b) Representative flow cytometry point plots and histograms indicating the abundance of BrdU-positive NRVMs following 48 h priming with 100, 250, 500 µg of A1-CM, or NRVMs without A1-CM priming. Antibodies against α-actinin were used to identify cardiomyocytes. (c) Graphical representation of BrdU incorporation of NRVMs following A1-CM treatments. (d) Representative flow cytometry point plots and histograms detecting annexin V on the surface of NRVMs after 12 h of 100 µg of A1-CM or media control treatments, followed by a 1-hour exposure to 50 µM H2O2 in NRVM media. (e) Graphical representation of the percentage of NRVMs that stain positive for strong annexin V signal for the two treatment groups, following H2O2 application. Experiments were done in triplicate. Standard error bars are displayed. * indicates statistical significance, p < 0.05. Scale bar = 100 µm.
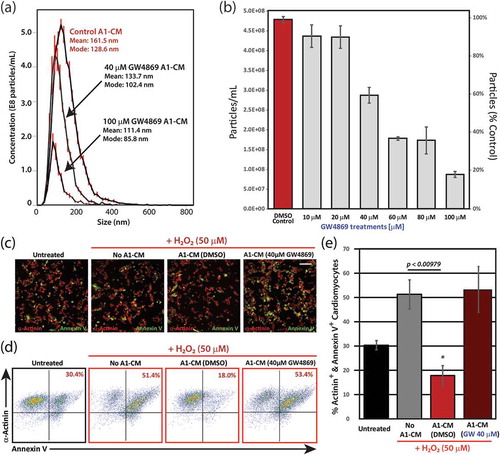
To rationalize the cytoprotective effects of A1-CM, we hypothesized that A1 cells secrete EVs which are bioactive on mammalian cardiomyocytes [Citation27–Citation31]. Dynamic light scattering of A1-CM (, Control A1-CM) revealed abundant EVs within the size range typical for mammalian exosomes and microvesicles (mean diameter: 161.5 nm; modal diameter: 128.6 nm). In mammalian cells, inhibition of the ceramide synthesis pathway using a small molecule inhibitor, GW4869, which targets neutral sphingomyelinase-2 (nSMase2), suppresses exosome secretion [Citation32,Citation33]. A1-EV levels were significantly reduced within the A1-CM in a GW4869 dose-dependent manner (): at 40 and 100 µM GW4869, two- and fivefold decreases in EV production were observed, respectively. The concentrations of GW4869 required to suppress EV secretion in A1 cells were higher than in mammalian cells (~20 µM [Citation33–Citation35]). To confirm A1 cells were not dying off due to the presence of GW4869, leading to reduced EVs in the CM, we counted the nuclei of GW4869-exposed A1 cells (Supplemental Figure 1). Contrary to expectations, GW4869 led to increased cell numbers in a dose-dependent manner. Inhibition of the ceramide pathway in mammalian cells leads to cellular proliferation [Citation36], and this effect appears to be conserved in urodeles. In NRVMs exposed to H2O2, cell surface levels of annexin V, an indicator of early apoptosis [Citation37], were significantly reduced following a 12 h pretreatment with A1-CM compared to NRVMs that did not receive A1-CM (). To test whether EVs in A1-CM mediate cytoprotection, we exposed A1 cells to 40 µM GW4869, or DMSO vehicle control, and applied the resulting CM to NRVMs prior to oxidative stress. The cytoprotective effect of A1-CM on NRVMs was lost when the A1 cells had been incubated with GW4869 ((c–e)). To ensure that the presence of GW4869 within the A1-CM was not responsible for the increase in apoptotic signalling, NRVMs were exposed to 40 µM GW4869, or a DMSO control, for 12 h and then subjected to oxidative stress as described above. We did not observe any difference in apoptotic signalling between treatments in stressed or unstressed NRVMs (Supplemental Figure 2).
Figure 2. Inhibition of EV secretion following treatment of A1 cells with the ceramide pathway inhibitor, GW4869 and analysis of the anti-apoptotic effects of A1-EVs following oxidative stress. (a) Histogram representations of EV detection in A1-CM following treatment with increasing concentrations of GW4869, as determined by dynamic light scattering methods (NanoSight). Particle size and yield for three treatment groups (DMSO control, 40 and 100 µM GW4869) are also shown. (b) Analysis in bar graph form of particle number per mL (left y-axis) and % particles relative to DMSO control (right y-axis) are displayed for each GW4869 treatment condition on A1 cells. (c) NRVMs exposed to A1-CM or A1-CM (40 µM GW4869) and subjected to oxidative stress (50 µM H2O2, 1 h). Representative images of the fixed and stained cells are shown for each of the four conditions; α-actinin shown in red and annexin V in green. (d) Representative flow cytometry point plots are shown for each of the four conditions. (e) Graphical analysis of the flow cytometry data indicates the percentage of α-actinin+ annexin V+ cardiomyocytes for each of the four conditions. Experiments were done in triplicate. Standard error bars are displayed. * indicates statistical significance, p < 0.05. Scale bar = 100 µm.
Newt A1-CM induces AKT signalling in rat cardiomyocytes
To investigate the signalling pathways underlying cytoprotection conferred by A1-CM, we performed RNA-Seq whole cell transcriptomic analysis on NRVMs treated with A1-CM and controls. IPA (Qiagen), focused on pathways involved in cardiomyocyte proliferation and cardioprotection, revealed a significant increase in the PI3K/AKT signalling pathway (Z = +2.12). The Fisher exact test statistical approach (z-score) was employed to determine likely activation states of upstream regulators based on comparison with a model that assigns random regulation directions. A significance threshold was set at the commonly used values of ±1.3. Activation of the PI3K/AKT pathway, which is known to promote both cardiomyocyte proliferation and survival () [Citation38], peaked at 12 h and subsided 24 h after A1-CM exposure (). Conversely, there was a significant reduction in the expression of genes associated with cellular differentiation, including bone morphogenetic protein (BMP) signalling (Z = −1.13) and TGF-β signalling (Z = −1.89) pathways [Citation39]. Also shown are the p-values for each of the identified signalling pathways as well as the ratio of genes significantly up- or down-regulated relative to all genes associated with that pathway. P-values in this context indicate the probability of random overlap between our gene data set and genes that are known to be regulated by specific transcriptional regulators. From the table in (c), we observed that the PI3K/AKT and VEGF signalling pathways reach significance for up- or down-regulation. Based on this analysis, we chose to further evaluate the expression of genes involved in AKT signalling.
Figure 3. Signalling pathways and gene expression in NRVMs following priming with A1-CM. (a) RNA isolated from NRVMs, following a 12-h treatment with A1-CM, was subjected to deep sequencing and gene pathway analysis using Ingenuity Pathway Analysis. The graph depicts the top canonical pathways involved in cardiomyocyte proliferation and survival. The bar direction, colour and height for the z-score axis indicate the significance of pathway modulation not due to chance (red = increased fold change; blue = decreased fold change). (b) Bar graph depicts the PI3K/AKT pathway z-score changes at 6, 12 and 24 h post A1-CM treatment. (c) Summary table lists each of the individual members of signalling pathway values including z-score, p-value and the ratio of canonical genes modulated within the respective pathway. (d) Individual gene expression of the PI3K/AKT signalling pathway (blue text) and BAD phosphorylation and anti-apoptotic signalling pathways (orange text) within NRVMs following A1-CM or A1-CM (40 µM GW4869) exposures are shown. Expression levels are displayed relative to NRVM controls exposed only to conventional NRVM media.
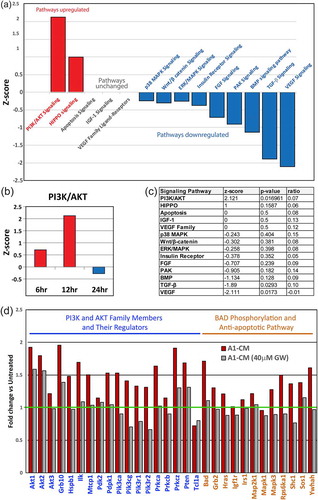
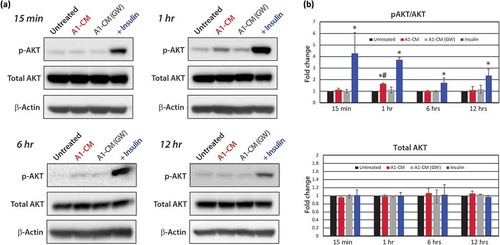
Focused qPCR arrays revealed that many genes in the PI3K/AKT and anti-apoptotic signalling pathways were upregulated in NRVMs that had been exposed to A1-CM, specifically AKT itself (). We also observed increased expression of the pro-apoptotic BCL2-associated agonist of cell death (Bad) gene and suppression of the cell survival kinase T-Cell Leukemia/Lymphoma 1A gene (Tcl1a). Such changes in gene expression were blunted in NRVMs exposed to CM from GW4869-incubated A1 cells. To determine if A1-CM activated AKT signalling in NRVMs, we monitored phosphorylation states of AKT at various times after A1-CM addition (). Western blot analyses showed a strong increase in AKT phosphorylation at all times (15 min–12 h) following the addition of insulin (1 µM; positive control), as expected [Citation40]. One hour after A1-CM treatment, NRVMs showed a significant increase (1.7-fold) in AKT phosphorylation, an effect not seen in cells exposed to A1-CM(GW). AKT phosphorylation levels returned to basal levels after 6- and 12-h post-treatment. Total AKT protein levels did not change significantly throughout the time course study for any of the conditions. Taken together, our RNA-Seq, qPCR data and Western blot analyses support an induction of cytoprotection through activation of AKT pathway signalling mediated by EV-associated factors in A1-CM.
Figure 4. Protein analyses of AKT signalling. (a) Representative Western blot images for protein phospholylation (p-) states and total AKT expression levels across time points including 15-min, 1-, 6- or 12-h post-treatment are shown for untreated, A1-CM, A1-CM (GW4869) and insulin-treated (1 µM) NRVMs. (b) Graphical representations of the quantitation for p-AKT (S473) to total AKT ratio (top graph) and total AKT levels (lower graph). Experiments were performed in triplicate, total AKT band intensities were calibrated to β- actin as the loading control and expression values normalized to untreated controls. Statistical significance differences between untreated NRVMs and treatment groups are indicated by * (p < 0.01), and # indicates statistically significant changes between A1-CM and A1-CM (GW) treatments (p < 0.01).
Characterization of newt A1-EVs
The finding that GW4869 suppressed A1-CM bioactivity motivated us to characterize EVs in the media. EVs were isolated from A1-CM by ultrafiltration centrifugation (UFC), as described in methods. Dynamic light scattering analysis revealed that A1-EVs resemble EVs derived from human heart progenitor cells (cardiosphere-derived cells, CDCs) and normal human dermal fibroblasts (NHDFs) [Citation15] in diameter (~150 nm), quantity (~6x10⁸ particles per mL, ) and vesicle morphology when imaged by electron microscopy ( inset images). Mammalian exosomes have an acetylcholinesterase (AChE) activity [Citation41,Citation42], a feature shared by isolated A1-EVs (). Intriguingly, A1-EVs contain more RNA (eightfold higher) and protein (threefold higher) per particle than human CDC- or NHDF-EVs ((c,d), respectively).
Figure 5. Newt A1-EV characterization. (a) Dynamic light scattering was used to measure A1-EV size and concentration. The red error bars of the histogram indicate +/− one standard error of the mean size. Examples are shown of different A1-EV sizes by negative stain in electron micrographs (insets). (b) Acetylcholineesterase activity was measured for cell culture media (control) or isolated normal human dermal fibroblast (NHDF) EVs, cardiosphere-derived cell (CDC)-EVs, and the newt A1-EVs by fluorescent enzyme assays. (c and d) Graphical representation of the amount of RNA per particle (femtograms) and protein per particle (picograms) for NHDF-, CDC- and A1-EVs following the 3-day serum-starvation protocol of cultured cells. (e–h) Western blots of common EV surface proteins from A1 cells and EVs and mammalian NHDF cells and EVs are shown. This set of markers is comprised of thrombospondin1 (TSP1), periostin (POSTN), fibronectin (FN) and CD9. Example FACS bead assay histogram data with A1-EVs and NHDF-EVs stained to detect TSP1 (i), POSTN (j), FN (k) and CD9 (l). Quantitative measurements for abundance levels expressed as % of control antibody stains are indicated in green text for each FACS assay.
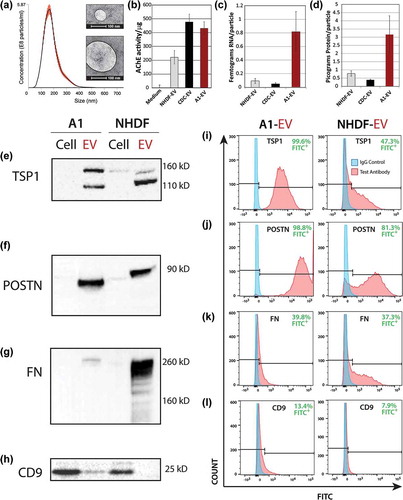
Western blot analyses for known exosome markers in newt A1 cellular and UFC-isolated EV lysates revealed the expression of thrombospondin 1(TSP1), periostin (POSTN), fibronectin (FN), and CD9 (). TSP1 was highly enriched in A1-EVs when compared to A1 cells, with at least two distinct glycoprotein isoforms at ~160 and ~110 kD. In contrast, NHDFs expressed only the larger (~160 kD) TSP1 isoform while NHDF-EVs displayed both isoforms ()). POSTN has cardioprotective signalling bioactivity in murine models of myocardial infarction [Citation43,Citation44]; we found high levels of POSTN in A1-EVs and NHDF-EVs and trace amounts in NHDF cell lysates (). Antibodies specific for the extracellular domain of FN [Citation45] reveal enrichment of FN in A1-EVs and very high levels in NHDF-EVs ()). Among the canonical exosome markers CD9, CD63, CD81 and Hsp70, we were able to detect CD9 in both A1 and NHDF cell lysates; however, only A1-EVs displayed CD9 (). Using antibodies raised against the mammalian proteins, neither CD81 nor CD63 displayed any immunoreactive bands in A1 cells or EVs. Our Western blot results were further verified using FACS analysis with EV capture beads in which Tim4 was used to bind all vesicles containing exposed phosphatidyl serine [Citation46] and then probed for surface protein phenotypes with labelled antibodies. High levels of TSP1 were quantitated in A1-EVs (~99%) with a lower abundance observed in NHDF-EVs at ~47% (). Abundant POSTN was evident in both A1-EVs and NHDF-EVs ). The bead assays showed comparable levels of FN for both types of EVs (). CD9 was only detected in A1-EVs, supporting our Western blot data (i)).
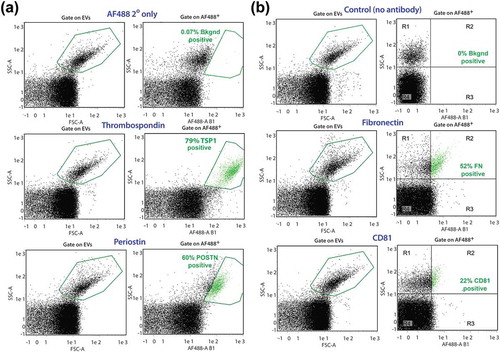
Additionally, we used highly-sensitive, single particle flow nanocytometry to quantify the relative proportions of A1-EVs expressing a particular protein surface marker within the entire EV population [Citation29,Citation47]. Sizable fractions of A1-EVs expressed TSP1 (79%), POSTN (60%), FN (52%) and low levels of CD81 (22%) (right panels, ); positive particles highlighted in green). These findings indicate that many proteins associated with mammalian EVs, and specifically exosomes, are found in A1-EVs, with a surprisingly high cross-reactivity of the antibodies.
Figure 6. A1-EV surface marker profiles by nanoflow cytometry. Representative forward scatter (FSC) and side scatter (SSC) plots of A1-EV populations analysed with the MACSQuant nanoparticle flow cytometer for the expression of established EV surface markers, using a combination of primary and secondary antibodies. Newt A1-EVs were readily detectable above background noise as a separate population. (a) Gate settings for A1-EV FSC-A/SSC-A are shown on the left set of graphs and gate settings for fluorescent-positive particle gates are shown on the right side (boxed in green, with positive EVs also shown in green colour). These graphs show marker profiling for the control secondary antibody (AF488 2° only), TSP1, and POSTN. (b) Nanoflow cytometry analyses of A1-EVs using fluorescent-conjugated primary antibodies for control (no antibody), FN and CD81 surface antigens are shown.
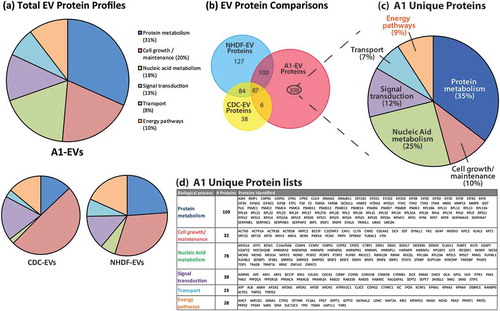
As mentioned above, EVs are secreted vesicles that transport protein, RNA and lipids to recipient cells. To expand on our canonical EV protein analyses, we also performed mass spectrometry on A1-EVs and EVs of mammalian origin to compare their components (). In their proteomic profiles, A1-EVs contained a much higher percentage of factors involved in protein and nucleic acid metabolism than CDC-EVs or NHDF-EVs (, lower pie charts). In fact, the largest grouping of proteins unique to A1-EVs () is involved in protein metabolism (31%), and includes extracellular matrix remodelling [Citation22,Citation48] as well as proteosomal and ribosomal subunit factors (). The second highest proportion of proteins unique to A1-EVs are nucleic acid metabolism factors, with particular enrichment of heterogeneous nuclear ribonucleoprotein family members, responsible for RNA shuttling () [Citation49,Citation50]. Similar protein profiles were seen using mass spectrometry and Western blot with A1-EVs enriched by either UFC or precipitation methods (Supplemental Figure 3 and Supplemental Tables 1 and 2).
Figure 7. EV protein profiles as determined by mass spectrometry. (a) Proteomic profiles of A1-, CDC-, NHDF-EV protein contents identified by mass spectrometry and analysed for biological process classification using Functional Enrichment Analysis Tool (FUNRICH) software. The biological process class relative abundances for each EV source are displayed in pie graph forms. (b) Venn diagram displaying the proportion of proteins shared and unique to each EV type. Two hundred ninety-seven proteins were identified as being unique to A1-EVs. (c) These unique A1 EV proteins were further classified based on their biological function with the percentage of each functional group displayed and a complete list of these proteins are listed in the table shown in (d).
Next, A1-EV RNA cargo was profiled by RNA-Seq and mapped using sequence similarity to human genome databases. We identified a high proportion of antisense and coding messenger RNA sequences, as well as abundant lincRNA sequences ((a)), but a very low relative abundance of miRNAs (0.014%). The largest proportion of identified RNAs (34.4%) mapped to non-coding RNA (rfam [Citation51]) with the most abundant species belonging to the Signal Recognition Particle RNA family, universally conserved ribonucleoprotein complexes involved in protein trafficking [Citation52].
Figure 8. EV RNA profiles as determined by RNA sequencing. (a) Profiles of total RNA types identified by RNA-Seq and analysed via the Maverix Biomics exosome RNA data analysis pipeline from A1-, CDC- and NHDF-EVs and RNA type identified by mapping to the human genome. Relative abundances of RNA types are shown in pie graph form. (b) Venn diagram displaying the proportion of messenger RNAs shared and unique to each EV type. (c) 86 mRNAs were shared between the EVs derived from the stem cell-like CDCs and A1 myogenic precursor cells. From this group, the mRNAs were classified based on the biological function of their translated proteins (FUNRICH), and the five largest categories are displayed in pie chart format, with the corresponding mRNAs listed within the appropriate pie slice. (d) 123 unique A1-EV mRNAs were identified and further classified based on the biological function of their translated proteins (FUNRICH), and the five largest categories are displayed in pie chart format, with the corresponding mRNAs listed within the appropriate pie slice.
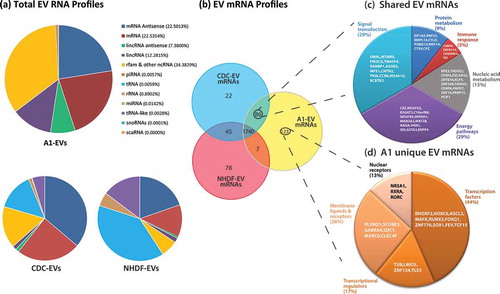
When comparing the patterns of RNA in A1-EVs and human CDC-EVs, we found overall similarity with a broad diversity of RNA types and relatively little tRNA or rRNA (, lower pie charts). In contrast, RNA from NHDF-EVs, which are biologically inert in various assays of cardiac injury, consisted largely of tRNA, rRNA and tRNA-like sequences. Due to the high numbers of individual RNA transcripts, we narrowed our analysis to coding mRNA sequences shared and unique among the three types of EVs; most of mRNAs so identified (1740) were present in all three EV species (; for a complete list of A1 RNAs, see Supplemental Table 3). The mRNAs were further grouped by biological processes associated with their encoded proteins (when known). A1-EVs and CDC-EVs shared 86 specific mRNAs, the 50 most abundant of which segregate into five distinct biological processes: signal transduction, energy pathways, protein metabolism, nucleic acid metabolism and immune response factors ((c)). Among 123 mRNAs with >1000 mapped sequencing reads unique to A1-EVs, many belonged to one of four functional classes: transcription factors, transcriptional regulators, membrane ligands and receptors, and nuclear receptors. Further bioinformatics analysis revealed many of these mRNAs are involved in regulating embryogenesis, neural development and tissue patterning ((d)) [Citation53–Citation56].
Discussion
Urodele amphibians, including newts and salamanders, have a remarkable ability to repair and regenerate damaged tissue. The paracrine signalling factors that orchestrate newt tissue repair are largely uncharacterized. In mammalian development and wound repair, growing evidence points to EVs in transporting biologically active molecules required for coordinating complex cellular development, dedifferentiation, proliferation and cytoprotection [Citation57–Citation60]. In mammalian ischemic heart injury, EVs are known to mediate the benefits of cell therapy. For example, in a mouse model of myocardial infarction, EV secretion is required for CDC efficacy, and CDC-EVs mimic the cardioprotective and regenerative effects of the parent CDCs [Citation15]. Additionally, endogenous EVs figure prominently in cardioprotective paracrine signalling in mammals, in the process known as remote ischemic preconditioning [Citation61]. In contrast to mammals, paracrine signalling in newts is poorly characterized. Prior to this work, none of the highly regenerative urodele species were known to secrete EVs, nor has a physiological role for EVs been postulated in non-mammalian regeneration.
Here, we have discovered that newt myogenic precursor cells (A1) secrete EVs which resemble, in many defining features (size, morphology, contents, surface antigens and GW4869-sensitivity), mammalian exosomes. Surface proteins known to be important in mammalian EVs (e.g. TSP1, FN1, POSTN, CD9 and CD81) are also seen in newt EVs, supporting the concept of homologous mechanisms for EV biogenesis and secretion. Indeed, we demonstrated here that inhibiting nSMAse2 with GW4869 abrogates newt EV production from A1 cells, suggesting that the ceramide synthesis pathway of exosome biogenesis is also conserved. We have additionally shown that exposure to A1-EVs alters gene expression in mammalian cardiomyocytes, conferring resistance to oxidative stress, at least partially through activation of the AKT pathway. AKT signalling is crucial in resisting apoptosis and maintenance of pluripotency in embryonic stem cells as well as multipotency in mesenchymal stem cells [Citation62,Citation63]. Insulin-mediated AKT activation occurs rapidly via cell surface receptor signalling [Citation64] and served as a positive control for our Western blots on NRVMs. Unlike insulin, which activated AKT phosphorylation persistently, A1-CM transiently increased AKT phosphorylation at 1 h. Such transient responses are not atypical for the AKT signalling pathway [Citation65,Citation66]; here, the observed time course may reflect kinetics of EV uptake and/or dissemination of signalling cargo materials within NRVMs, but we have not investigated these possibilities. In addition to AKT activation, we also observed increased transcript levels of AKT itself as well as other pathway-associated genes. This finding is consistent with the known interaction between AKT phosphorylation and AKT gene expression [Citation67].
Characterization of A1-EV contents reveals a bewilderingly rich diversity of molecules which are known to be bioactive, but also many others whose roles are unknown. For example, A1-EVs contain mRNAs that directly regulate early embryonic development, such as transcription factors HOXC6, FOXQ1 and SOX1 [Citation68–Citation73]. The transfer of mRNAs encoding these potent factors, via EVs, may induce terminally differentiated myotubes to dedifferentiate and re-enter the cell cycle [Citation8,Citation9]. Additionally, many genes found within A1-EVs were associated with neural development, such as ASCL2, FEV/ETS and LMO3 [Citation74–Citation76]. This is of particular interest because innervation of the wound following limb loss in newts is one of the first steps in limb regeneration [Citation77]. Denervation of the stump during limb formation results in the loss of regenerative capacity and resorption of the blastemal stem cell cap [Citation77]. The presence of factors that regulate neural development in A1-EVs indicates that newt myogenic precursor cells secrete signalling factors that may foster neurite growth, leading to the formation of the blastemal stem cell cap and subsequent limb reformation. We are actively testing this idea in newt models of regeneration.
Our findings have several implications. First, the fact that newt cells secrete EVs rich in signalling molecules begs the question of precisely how EVs function physiologically in urodeles. The present data are consistent with, but do not demonstrate, an important homeostatic role of endogenous EVs in urodeles. As a corollary, we hypothesize that newt regeneration utilizes EVs for paracrine signalling, both as reporters of injury (e.g. from the amputation site of a limb) and as mediators of repair and regeneration. We are presently testing these broad-reaching concepts. On a translational level, the fact that newt EVs enhance injured cell survival, may make them worthy for development as therapeutic candidates. Above and beyond newt EVs themselves, their contents present myriad opportunities for mining defined factors for disease-modifying activity.
Supplemental_files.zip
Download Zip (16.3 MB)Acknowledgements
This work was supported by NIH [R01 HL 124074]. We gratefully acknowledge expert Illumina sequencing by Jie Tang, Ph.D. and Vineela Gangalapudi, Ph.D. at the Cedars-Sinai Genomics Core and advice on IPA pathway analysis from Xiangming Ding, Ph.D. at TACGenomics. We thank Ahmed Ibrahim, Ph.D., for helpful discussions, and Dr Michael Harrington at the Huntington Medical Research Institute for access to Nanosight.
Disclosure statement
No potential conflict of interest was reported by the authors.
Supplementary material
Supplemental data for this article can be accessed here.
Additional information
Funding
References
- Brockes JP, Kumar A. Appendage regeneration in adult vertebrates and implications for regenerative medicine. Science. 2005;310(5756):1–15.
- Zgheib C, Allukian MW, Xu J, et al. Mammalian fetal cardiac regeneration following myocardial infarction is associated with differential gene expression compared to the adult. Ann Thorac Surg. 2014;97(5):1643–1650.
- van Weerd JH, Christoffels VM. The formation and function of the cardiac conduction system. Development. 2016;143(2):197–210.
- Thygesen K, Alpert JS, Jaffe AS, et al. Third universal definition of myocardial infarction. Nat Rev Cardiol. 2012;9(11):620–633.
- Oberpriller JO, Oberpriller JC. Response of the adult newt ventricle to injury. J Exp Zool. 1974;187(2):249–253.
- Oberpriller JO, Oberpriller JC, Matz DG, et al. Stimulation of proliferative events in the adult amphibian cardiac myocyte. Ann N Y Acad Sci. 1995;752:30–46.
- Grassme KS, Garza-Garcia A, Delgado JP, et al. Mechanism of action of secreted newt anterior gradient protein. PLoS One. 2016;11(4):e0154176.
- McGann CJ, Odelberg SJ, Keating MT. Mammalian myotube dedifferentiation induced by newt regeneration extract. Proc Natl Acad Sci U S A. 2001;98(24):13699–13704.
- Kawesa S, Vanstone J, Tsilfidis C. A differential response to newt regeneration extract by C2C12 and primary mammalian muscle cells. Skelet Muscle. 2015;5:19.
- Raposo G, Stoorvogel W. Extracellular vesicles: exosomes, microvesicles, and friends. J Cell Biol. 2013;200(4):373–383.
- Tseliou E, Weixin L, Valle J, et al. Newt exosomes are bioactive on mammalian heart, enhancing proliferation of rat cardiomyocytes and improving recovery after myocardial infarction. Circulation. 2015;132:A15925.
- Middleton RC, Tseliou E, Antes TJ, et al. Newt exosomes are shuttles of bioactive RNAs and proteins that have signaling capabilities in mammalian systems of cardiac repair. Circulation. 2016;134:A19422.
- Griffin KJ, Fekete DM, Carlson BM. A monoclonal antibody stains myogenic cells in regenerating newt muscle. Development. 1987;101(2):267–277.
- Ferretti P, Ghosh S. Expression of regeneration-associated cytoskeletal proteins reveals differences and similarities between regenerating organs. Dev Dyn. 1997;210(3):288–304.
- Ibrahim AG-E, Cheng K, Marbán E. Exosomes as critical agents of cardiac regeneration triggered by cell therapy. Stem Rep. 2014;2:606–619.
- Golden HB, Gollapudi D, Gerilechaogetu F, et al. Isolation of cardiac myocytes and fibroblasts from neonatal rat pups. Methods Mol Biol. 2012;843:205–214.
- Livak KJ, Schmittgen TD. Analysis of relative gene expression data using real-time quantitative PCR and the 2(-Delta Delta C(T)) method. Methods. 2001;25(4):402–408.
- Eng JK, Jahan TA, Hoopmann MR. Comet: an open-source MS/MS sequence database search tool. Proteomics. 2013;13(1):22–24.
- Craig R, Beavis RC. TANDEM: matching proteins with tandem mass spectra. Bioinformatics. 2004;20(9):1466–1467.
- Keller A, Nesvizhskii AI, Kolker E, et al. Empirical statistical model to estimate the accuracy of peptide identifications made by MS/MS and database search. Anal Chem. 2002;74(20):5383–5392.
- MacLean B, Tomazela DM, Shulman N, et al. Skyline: an open source document editor for creating and analyzing targeted proteomics experiments. Bioinformatics. 2010;26(7):966–968.
- Pathan M, Keerthikumar S, Ang CS, et al. FunRich: an open access standalone functional enrichment and interaction network analysis tool. Proteomics. 2015;15(15):2597–2601.
- Khan SY, Hackett SF, Riazuddin SA. Non-coding RNA profiling of the developing murine lens. Exp Eye Res. 2016;145:347–351.
- Ferretti P, Brockes JP. Culture of newt cells from different tissues and their expression of a regeneration-associated antigen. J Exp Zool. 1988;247(1):77–91.
- Xie Y, Ibrahim A, Cheng K, et al. Importance of cell-cell contact in the therapeutic benefits of cardiosphere-derived cells. Stem Cells. 2014;32(9):2397–2406.
- Janero DR, Hreniuk D, Sharif HM. Hydrogen peroxide-induced oxidative stress to the mammalian heart-muscle cell (cardiomyocyte): nonperoxidative purine and pyrimidine nucleotide depletion. J Cell Physiol. 1993;155(3):494–504.
- Barile L, Lionetti V, Cervio E, et al. Extracellular vesicles from human cardiac progenitor cells inhibit cardiomyocyte apoptosis and improve cardiac function after myocardial infarction. Cardiovasc Res. 2014;103(4):530–541.
- Wang YZL, Li Y, Chen L, et al. Exosomes/microvesicles from induced pluripotent stem cells deliver cardioprotective miRNAs and prevent cardiomyocyte apoptosis in the ischemic myocardium. Int J Cardiol. 2015;192:61–69.
- Mead B, Tomarev S. Bone marrow-derived mesenchymal stem cells-derived exosomes promote survival of retinal ganglion cells through miRNA-dependent mechanisms. Stem Cells Transl Med. 2017;6(4):1273–1285.
- Toh WS, Lai RC, Hui JHP, et al. MSC exosome as a cell-free MSC therapy for cartilage regeneration: implications for osteoarthritis treatment. Semin Cell Dev Biol. 2017;67:56–64.
- Yan Y, Jiang W, Tan Y, et al. hucMSC exosome-derived GPX1 is required for the recovery of hepatic oxidant injury. Mol Ther. 2017;25(2):465–479.
- Essandoh K, Yang L, Wang X, et al. Blockade of exosome generation with GW4869 dampens the sepsis-induced inflammation and cardiac dysfunction. Biochim Biophys Acta. 2015;1852(11):2362–2371.
- Trajkovic K, Hsu C, Chiantia S, et al. Ceramide triggers budding of exosome vesicles into multivesicular endosomes. Science. 2008;319(5867):1244–1247.
- Kim DS, Kim SY, Moon SJ, et al. Ceramide inhibits cell proliferation through Akt/PKB inactivation and decreases melanin synthesis in Mel-Ab cells. Pigment Cell Res. 2001;14(2):110–115.
- Gills JJ, Zhang C, Abu-Asab MS, et al. Ceramide mediates nanovesicle shedding and cell death in response to phosphatidylinositol ether lipid analogs and perifosine. Cell Death Dis. 2012;3:e340.
- Uchida Y. Ceramide signaling in mammalian epidermis. Biochim Biophys Acta. 2014;1841(3):453–462.
- van Heerde WL, Robert-Offerman S, Dumont E, et al. Markers of apoptosis in cardiovascular tissues: focus on Annexin V. Cardiovasc Res. 2000;45(3):549–559.
- Lin Z, Zhou P, Von Gise A, et al. Pi3kcb links Hippo-YAP and PI3K-AKT signaling pathways to promote cardiomyocyte proliferation and survival. Circ Res. 2015;116(1):35–45.
- Goumans MJ, De Boer TP, Smits AM, et al. TGF-beta1 induces efficient differentiation of human cardiomyocyte progenitor cells into functional cardiomyocytes in vitro. Stem Cell Res. 2007;1(2):138–149.
- Aikawa R, Nawano M, Gu Y, et al. Insulin prevents cardiomyocytes from oxidative stress-induced apoptosis through activation of PI3 kinase/Akt. Circulation. 2000;102(23):2873–2879.
- Savina A, Vidal M, Colombo MI. The exosome pathway in K562 cells is regulated by Rab11. J Cell Sci. 2002;115(Pt 12):2505–2515.
- Gupta S, Knowlton AA. HSP60 trafficking in adult cardiac myocytes: role of the exosomal pathway. Am J Physiol Heart Circ Physiol. 2007;292(6):H3052–H3056.
- Kuhn B, del Monte F, Hajjar RJ, et al. Periostin induces proliferation of differentiated cardiomyocytes and promotes cardiac repair. Nat Med. 2007;13(8):962–969.
- Taniyama Y, Katsuragi N, Sanada F, et al. Selective blockade of periostin exon 17 preserves cardiac performance in acute myocardial infarction. Hypertension. 2016;67(2):356–361.
- Brenmoehl J, Falk W, Goke M, et al. Inflammation modulates fibronectin isoform expression in colonic lamina propria fibroblasts (CLPF). Int J Colorectal Dis. 2008;23(10):947–955.
- Nakai W, Yoshida T, Diez D, et al. A novel affinity-based method for the isolation of highly purified extracellular vesicles. Sci Rep. 2016;6:33935.
- Treps L, Edmond S, Harford-Wright E, et al. Extracellular vesicle-transported Semaphorin3A promotes vascular permeability in glioblastoma. Oncogene. 2016;35(20):2615–2623.
- Lu P, Takai K, Weaver VM, et al. Extracellular matrix degradation and remodeling in development and disease. Cold Spring Harb Perspect Biol. 2011;3(12).
- Villarroya-Beltri C, Gutierrez-Vazquez C, Sanchez-Cabo F, et al. Sumoylated hnRNPA2B1 controls the sorting of miRNAs into exosomes through binding to specific motifs. Nat Commun. 2013;4:2980.
- Jean-Philippe J, Paz S, Caputi M. hnRNP A1: the Swiss army knife of gene expression. Int J Mol Sci. 2013;14(9):18999–19024.
- Burge SW, Daub J, Eberhardt R, et al. Rfam 11.0: 10 years of RNA families. Nucleic Acids Res. 2013;41(Database issue):D226D232.
- Chen M, Xu R, Ji H, et al. Transcriptome and long noncoding RNA sequencing of three extracellular vesicle subtypes released from the human colon cancer LIM1863 cell line. Sci Rep. 2016;6:38397.
- Christensen J, Bentz S, Sengstag T, et al. FOXQ1, a novel target of the Wnt pathway and a new marker for activation of Wnt signaling in solid tumors. PLoS One. 2013;8(3):e60051.
- Gasperowicz M, Surmann-Schmitt C, Hamada Y, et al. The transcriptional co-repressor TLE3 regulates development of trophoblast giant cells lining maternal blood spaces in the mouse placenta. Dev Biol. 2013;382(1):1–14.
- Torres-Vazquez J, Gitler AD, Fraser SD, et al. Semaphorin-plexin signaling guides patterning of the developing vasculature. Dev Cell. 2004;7(1):117–123.
- Mascrez B, Ghyselinck NB, Chambon P, et al. A transcriptionally silent RXRalpha supports early embryonic morphogenesis and heart development. Proc Natl Acad Sci U S A. 2009;106(11):4272–4277.
- McGough IJ, Vincent JP. Exosomes in developmental signalling. Development. 2016;143(14):2482–2493.
- Huang Q, Cai B. Exosomes as new intercellular mediators in development and therapeutics of cardiomyocyte hypertrophy. Adv Exp Med Biol. 2017;998:91–100.
- Tanaka HV, Ng NC, Yang YZ, et al. A developmentally regulated switch from stem cells to dedifferentiation for limb muscle regeneration in newts. Nat Commun. 2016;7:11069.
- Balbi C, Piccoli M, Barile L, et al. First characterization of human amniotic fluid stem cell extracellular vesicles as a powerful paracrine tool endowed with regenerative potential. Stem Cells Transl Med. 2017;6(5):1340–1355.
- De Couto G, Liu W, Tseliou E, et al. Macrophages mediate cardioprotective cellular postconditioning in acute myocardial infarction. J Clin Invest. 2015;125(8):3147–3162.
- Takahashi K, Murakami M, Yamanaka S. Role of the phosphoinositide 3-kinase pathway in mouse embryonic stem (ES) cells. Biochem Soc Trans. 2005;33(Pt 6):1522–1525.
- Chen J, Crawford R, Chen C, et al. The key regulatory roles of the PI3K/Akt signaling pathway in the functionalities of mesenchymal stem cells and applications in tissue regeneration. Tissue Eng Part B Rev. 2013;19(6):516–528.
- Yao H, Han X, Han X. The cardioprotection of the insulin-mediated PI3K/Akt/mTOR signaling pathway. Am J Cardiovasc Drugs. 2014;14(6):433–442.
- Gross SM, Rotwein P. Mapping growth-factor-modulated Akt signaling dynamics. J Cell Sci. 2016;129(10):2052–2063.
- Ferreira ADF, Cunha PDS, Carregal VM, et al. Extracellular vesicles from adipose-derived mesenchymal stem/stromal cells accelerate migration and activate AKT pathway in human keratinocytes and fibroblasts independently of miR-205 activity. Stem Cells Int. 2017;2017:9841035.
- Qu Z, Guo S, Fang G, et al. AKT pathway affects bone regeneration in nonunion treated with umbilical cord-derived mesenchymal stem cells. Cell Biochem Biophys. 2015;71(3):1543–1551.
- Philippidou P, Dasen JS. Hox genes: choreographers in neural development, architects of circuit organization. Neuron. 2013;80(1):12–34.
- Kim H, Kim S, Song Y, et al. Dual function of Wnt signaling during neuronal differentiation of mouse embryonic stem cells. Stem Cells Int. 2015;2015:459301.
- Hannenhalli S, Kaestner KH. The evolution of Fox genes and their role in development and disease. Nat Rev Genet. 2009;10(4):233–240.
- Archer TC, Jin J, Casey ES. Interaction of Sox1, Sox2, Sox3 and Oct4 during primary neurogenesis. Dev Biol. 2011;350(2):429–440.
- Qiao Y, Jiang X, Lee ST, et al. FOXQ1 regulates epithelial-mesenchymal transition in human cancers. Cancer Res. 2011;71(8):3076–3086.
- Epstein JA, Aghajanian H, Singh MK. Semaphorin signaling in cardiovascular development. Cell Metab. 2015;21(2):163–173.
- Johnson JE, Birren SJ, Anderson DJ. Two rat homologues of Drosophila achaete-scute specifically expressed in neuronal precursors. Nature. 1990;346(6287):858–861.
- Hendricks T, Francis N, Fyodorov D, et al. The ETS domain factor Pet-1 is an early and precise marker of central serotonin neurons and interacts with a conserved element in serotonergic genes. J Neurosci. 1999;19(23):10348–10356.
- Hinks GL, Shah B, French SJ, et al. Expression of LIM protein genes Lmo1, Lmo2, and Lmo3 in adult mouse hippocampus and other forebrain regions: differential regulation by seizure activity. J Neurosci. 1997;17(14):5549–5559.
- Kumar A, Godwin JW, Gates PB, et al. Molecular basis for the nerve dependence of limb regeneration in an adult vertebrate. Science. 2007;318(5851):772–777.