
ABSTRACT
Extracellular vesicle (EV)-based liquid biopsies have been proposed to be a readily obtainable biological substrate recently for both profiling and diagnostics purposes. Development of a fast and reliable preparation protocol to enrich such small particles could accelerate the discovery of informative, disease-related biomarkers. Though multiple EV enrichment protocols are available, in terms of efficiency, reproducibility and simplicity, precipitation-based methods are most amenable to studies with large numbers of subjects. However, the selectivity of the precipitation becomes critical. Here, we present a simple plasma EV enrichment protocol based on pluronic block copolymer. The enriched plasma EV was able to be verified by multiple platforms. Our results showed that the particles enriched from plasma by the copolymer were EV size vesicles with membrane structure; proteomic profiling showed that EV-related proteins were significantly enriched, while high-abundant plasma proteins were significantly reduced in comparison to other precipitation-based enrichment methods. Next-generation sequencing confirmed the existence of various RNA species that have been observed in EVs from previous studies. Small RNA sequencing showed enriched species compared to the corresponding plasma. Moreover, plasma EVs enriched from 20 advanced breast cancer patients and 20 age-matched non-cancer controls were profiled by semi-quantitative mass spectrometry. Protein features were further screened by EV proteomic profiles generated from four breast cancer cell lines, and then selected in cross-validation models. A total of 60 protein features that highly contributed in model prediction were identified. Interestingly, a large portion of these features were associated with breast cancer aggression, metastasis as well as invasion, consistent with the advanced clinical stage of the patients. In summary, we have developed a plasma EV enrichment method with improved precipitation selectivity and it might be suitable for larger-scale discovery studies.
Introduction
Extracellular vesicles (EVs) or exosomes are small, spherical vesicles with a diameter of ~40–100 nm that are secreted into the extracellular milieu by many cell types upon fusing the membrane of multi-vesicular bodies (MVBs) with the plasma membrane. In contrast, micro-particles (MPs), which include not only EVs, but also micro-vesicles (MVs), apoptotic bodies and apoptotic MPs are typically small particles ranging from 50 nm to 3 µm in diameter. Secreted MPs derived from MVBs fused with the plasma membrane are termed EVs, while MPs released from the surface of plasma membranes are referred to as MVs, membrane particles as well as apoptotic vesicles [Citation1]. Recent studies are now showing EV release which may be a highly regulated process instead of a random process for the removal of unwanted internal cellular debris as originally thought [Citation2]. EVs located in biological fluids attract enormous interest because of their potential use as a source of protein and nucleic acid biomarkers, or as a prospective delivery system for various therapeutic purposes [Citation3]. A simple and efficient method for the enrichment of EV from complex biofluids, such as plasma samples, that addresses the many pitfalls of currently used methods would be useful in the research, clinical and commercial setting.
Blood samples frequently contain large quantities of soluble proteins, aggregates and contaminants from other organelles that restrict the accuracy of EV analysis. Limitations of current methods in enriching EVs from complex biological fluids include sample volume requirements, carryover of undesired high-abundant proteins and interference of downstream analysis due to leftover of method-based reagents. Differential ultracentrifugation (UC) was the gold standard to separate EVs [Citation4], which aids in the removal of most of the plasma contaminants. However, time-consuming steps, large sample volume requirement leads to poor reproducibility and restrict its utilities for large-scale studies; immuno-precipitation (IP), while providing faster process, are restricted only to certain EV subpopulation with known surface proteins, which limits its value to identify novel biomarkers. More recently, polymer-based enrichment techniques by, for example, PEG8000 has been used to enrich EVs [Citation5].
Previous studies have compared the reproducibility and efficiency in enriching plasma-derived EVs between UC and polyethylene glycol (PEG)-based methods [Citation6–Citation8]. Though results might vary from study to study, the conclusion in general was that UC may obtain EV with relatively better purity but with very low efficiency. In contrast, PEG-based method offers higher efficiency and better reproducibility, but in the cost of huge contamination of high-abundant plasma proteins. High viscosity and carryover for PEG-based method also might affect the compatibility to the downstream applications, such as electro-microscopy (EM), mass spectrometry (MS) and flow cytometry (FL). Procedures that are used for the removal of the polymer are often tedious and incomplete.
Pluronic block copolymers consist of ethylene oxide (EO) and propylene oxide (PO) blocks arranged in a triblock structure: EOx–POy–EOx. This arrangement results in an amphiphilic copolymer, in which the hydrophilicity and hydrophobicity could be altered by varying the size of the hydrophilic EO(x) and hydrophobic PO(y) units [Citation9]. Pluronic block copolymers F68 and related F127 have been reported to have broad utilities and biological properties: Copolymers with higher hydrophilic/lipophilic balance (HLB) (e.g. F-68, HLB0.80) were shown to be capable of being inserted into lipid bilayer membranes and able to restore the integrity of damaged membranes [Citation10–Citation13]; F68 was also shown to be capable of inhibiting protein aggregation [Citation14]. These biological properties seem to be in large contrast to those from PEG, and offer the potential to increase the selectivity of EV precipitation when enriching from complex biofluids, such as plasma.
An ideal method of enriching EVs from plasma might be a balance between high efficiency, low contamination and simplicity. We describe here a plasma EV enrichment method based on the Pluronic block copolymer F68, which might be able to balance these three requirements. The enrichment method described here is more selective for plasma EV fraction with high efficiency, while much less contamination from high-abundant plasma protein, making it ideal for larger scale plasma EV biomarker studies. To demonstrate its potential utility, plasma EVs from 20 high-grade (stage III and IV) breast cancer patients and age-matched non-cancer controls were profiled and compared in the current study to identify features in the EVs that might be related to breast cancer aggression, metastasis and invasion.
Experimental procedures
Cell line EV preparation
Cell line used in this study in includes Vcap, MCF7, T47D, MDA-MB-231, MDA-MB-468. Cell culture: Fetal bovine serum (FBS) (20% in Dulbecco's Modified Eagle Medium (DMEM)) was depleted of bovine EV by centrifugation at 100,000g for 16 h at 4°C. Vcap cells were cultured in DMEM, MCF7 cells were culture in EMEM, T47D cells were cultured in RMPI1640, MDA-MB-231/468 were cultured in L15 medium, all supplemented with 10% depleted FBS, 2 mM L-glutamine, 1 U/mL penicillin and 1 μg/mL streptomycin at 37°C and 5% CO2. Cell-line-generated EVs were isolated from cell cultures supernatant by sucrose density centrifugation. Briefly, supernatant was cleared of cells and cellular debris by sequential centrifugation at 400g for 10 min and 2000g for 20 min at 4°C. Cleared supernatant was concentrated by centrifugal filtration (Centricon Plus-70, 100 kDa NMWL), layered on a 30% sucrose cushion and centrifuged at 100,000g for 75 min at 4°C. Supernatant was removed and discarded without disrupting the cushion interface, which was then collected, diluted six-fold with PBS and centrifuged at 100,000g for 70 min at 4°C. The resulting EV pellet was re-suspended in PBS by pipetting and incubation overnight at 4°C, and then stored at −80°C.
Breast cancer/non-cancer plasma samples and processing
Breast cancer and non-cancer samples were from Caris biorepository, age-match samples (average of 55 years old) were chosen ()). Breast cancer samples were all from advanced clinical stage III and IV. All information regarding age and stage of the patients are listed in Supplement Table 1. Bio-specimens utilized in this experiment were obtained under an institutional review board (IRB)-approved Biorepository Protocol. All subjects were consented with an IRB approved consent form and per 21 CFR 50.20 guidelines. Blood was collected using standard venipuncture to ethylenediaminetetraacetic acid (EDTA) tubes and plasma was collected by standardized protocol and the centrifuges provided by Caris Life Sciences. Blood were then spun in the Labofuge 200 for 10 min at 5300 RPM to remove cell debris. The clear layer of the plasma was aliquoted and transferred into cryovials and store at −80°C until use. Before EV enrichment described in the following section, the plasma was quickly thawed in water at room temperature (RT) and centrifuged at 4000g for another 15 min at RT to further remove any potential protein aggregation/cell debris, clear supernatant of the plasma were then used for the EV enrichment. Plasma aliquots for the EV enrichment below were all freeze-thawed for only one time.
EV enrichment from plasma
Pluronic block copolymer F68 was from Amresco in a powder format (equivalent to VWR 95034-960), the block copolymer was dissolved in PBS to make a 15% stock solution. The stock solution is further diluted in PBS in a way that when adding 100 μL of plasma to 900μL of such solution, the final F68 concentration for enrichment is 2%; the mixture was then incubated at RT for 30 min, followed by centrifuge at 20,000g for 30 min at 4°C. The pellet was then washed with 1% F68 by vortexing followed by centrifuging for 10 min at 4°C at 20,000g; supernatant was then removed and appropriate amount of PBS was added to re-suspend the fraction. For cell line EV spiked-in sample, 1 μg of the Vcap-generated EV prepared as shown earlier was spiked into 100 μL plasma. Plasma EV extraction by Exoquick (System Biosciences, Inc.) and Total Exosome Isolation kit (ThermoFisher, TEI), instructions for 100 μL of plasma were followed. Protein quantification was performed by microBCA kit from Thermo Scientific, according to manufacturer’s instructions.
DLS, ELISA and western blot
Particle size distributions were measured by DynaPro Plate Reader II (Wyatt Technology Corporation, Santa Barbara, CA), in three replicates, 5 acquisitions of 5 s each at 25°C. PBS buffer and UC-isolated cell line EV were used as controld; direct CD9 ELISA was performed as follows: 1 μg of the protein from neat plasma, plasma with cell line EV (Vcap) precipitated by F68 and plasma alone precipitated by F68 were coated on the 96-well ELISA plate overnight at 4°C, the plates were blocked by 1% BSA in PBS for 1 h; biotinylated anti-CD9 monoclonal antibody (Abcam, ab34161) was added as detection antibody followed by streptavidin-HRP; 100 μL of Ultra ELISA Substrate (Pierce) was used and OD450 was recorded by the BioTek plate reader; for western blot, protein samples were separated on 4–12% Bis Tris protein gel and transferred to a polyvinylidene difluoride (PDVF) membrane. Primary antibody includes mouse anti-CD9 (Abcam), mouse anti-β actin antibody (Abcam), mouse anti-HSP70 antibody (Abcam), rabbit anti-Von Willebrand Factor antibody (Abcam), rabbit anti-human serum albumin antibody (Abcam), mouse anti-alpha2 macroglobulin antibody (Abcam) and rabbit anti-human IgG antibody (Abcam). Chemiluminescent signals were captured by imager (PXi, Syngene).
RNA analysis, RNA sequencing, small RNA (smRNA) sequencing and miR assay
To extract total RNA and smRNA, Trizol LS reagent was used (ThermoFisher). RNA, including total RNA and smRNA, was purified through the miRNeasy column (Qiagen) according to manufacturer’s instructions. All samples were eluted in 20 μL of RNase-free water. About 1 μL of these samples was used for bioanalyser analysis (Agilent). Density analysis of the small RNA bands was performed by ImageJ software package [Citation15]. To prepare total RNA Next Gen Sequencing (NGS) library, SMARTer Stranded Total RNA-Seq Kit (Clontech) was used and sequenced on the illumine Miseq instrument according to manufacturer’s instructions. The data were analysed by a customized Tophat/cufflinks pipeline [Citation16] against the ensemble-GRCh38 human genome and further categorization according to their biotypes from Ensemble GRCh38.85 RNA annotation. For smRNA sequencing, the library preparation was performed according to the instruction of Clean-Tag smRNA kit from Trilink Biotech. Data were then analysed by customized smRNA pipeline, reads were normalized to RPM (reads per million mapped read) for comparison; smRNA recovery was also examined by let-7a Taqman probe assay (ThermoFisher), same amount of eluted sample was used. Direct Ct from the qPCR results was used to evaluate the recovery efficiency of the let-7a miRNA. For comparing enrichment of let-7a from plasma-enriched EVs to plasma alone, relative abundance was analysed by ΔΔCt method with miR-451a as reference miR (one of the most abundant miR found in plasma [Citation17]).
Transmission electron microscopy (TEM)
TEM and immuno-TEM analysis of EVs were performed as described previously [Citation4] with modifications. Specifically, the vesicle was re-suspended in 1× PBS and deposited onto a formvar-coated slide of copper mesh EM grids (FF300-Cu-50, Electron Microscopy Sciences). The vesicle-coated grids were washed, stained with 1% UO2(CH3COO)2 and then viewed by TEM using a Philips CM12 with Gatan model 791 camera; for the immuno-gold labelling with antibodies, blocked grids coated with EVs were briefly fixed by ice-cold 1:1 ethanol/methanol for 5 min followed by washing with PBS. The grids were then transferred to a drop of the anti-CD9 antibody (Abcam) in PBS with 1% BSA, 0.01% Tween20 and incubated for 30 min. The grids were then washed and incubated with gold-labelled secondary antibody (Sigma). The grids were stained with 0.5% UO2(CH3COO)2 and then imaged by TEM.
Flow cytometry analysis
The isolated EVs were labelled with a cocktail of mouse anti-CD9-PE (BD), anti-CD63-PE (BD) and mouse anti-CD81 PE (BD) or Mouse IgG1 kappa PE as isotype antibody control (eBioscience). PBS, antibody isotype control, anti-tetraspanin cocktail diluent as well as samples without staining were processed as controls. PE fluorescence intensity associated with particle events was measured by FL (A50-Micro, Apogee Flow Systems); data analysis was performed in R3.2.2 environment with customized script, details provided in Supplementary Methods.
Shotgun proteomics
In-solution trypsin digestion was performed according to manufacturer’s instructions (ThermoFisher). Samples were analysed by nanoflow reverse phase liquid chromatography using a Dionex Ultimate 3000 RSLCnano System (ThermoFisher) coupled in-line to a Q Exactive HF mass spectrometer (ThermoFisher). The nano-LC system included an Acclaim PepMap 100 C18 5 μm 100A 300 μm × 5 mm trap column and an EASY-Spray C18 2 μm 100A 50 μm × 150 mm analytical column (ThermoFisher). Peptide samples were eluted with a two-step gradient of 2–30% B for 28 min and then 30–45% B for 5 min, where B consisted of acetonitrile containing 0.1% formic acid. Blank samples consisting of 0.1% formic acid in water were injected between each sample and eluted with the same gradient profile and times as the samples. The LC system was interfaced with the MS using an EASY-Spray electrospray ion source (ThermoFisher) and the samples were analysed using positive ion spray voltage set to 2 kV, S-lens RF level at 65, and heated capillary at 285°C. The Q Exactive HF was operated in the data-dependent acquisition mode for fragmentation. MS1 survey scans (m/z 400–1400) were acquired in the Orbitrap analyser with a resolution of 120,000 at m/z 200, an accumulation target of 3 × 10⁶, and maximum fill time of 50 ms. MS2 scans were collected using a resolution of 30,000 at m/z 200, an accumulation target of 1 × 10⁵, and maximum fill time of 100 ms, with an isolation window of 1.5 m/z, normalized collision energy of 28, and charged state recognition between 2 and 7.
ProteoWizard [Citation18] was used for peak-picking, filtering out peaks with intensity less than 100 and converting the file to mzML format. Protein search and identifications were performed using MS-GF+ [Citation19] search engine on Homo sapiens (Uniprot TaxID = 9606). For semi-quantification analysis, algorithm was establish according to the previous normalized spectra index algorithm [Citation20,Citation21] with modifications: sum of intensity from each peptide MS2 scan was normalized by the parent peptide charge, such normalized intensity for the same peptide from different MS2 scans was then sum together; sum of the normalized intensity for the same peptide is then further normalized by the experimental molecular weight of the peptide, as a unit of normalized intensity per Dalton (mass). Normalized intensity per mass between different peptides of the same protein detected in the same sample was then averaged to obtain the final spectrum index (SI). For relative abundance, the SI was further normalized by the average total MS2 intensity among all samples.
Protein categorization
To categorize the proteins for their relevance to EVs, individual GO terms were query for GO definition of extracellular exosome (0070062), cytoskeleton (0005856), cell surface receptor (0007166), endosome (0005768), Golgi apparatus (0044431), blood microparticles (0072562), endoplasmic reticulum (0044432), mitochondrion (0044429) and nucleosome (0000788). ExoCarta database version 5 was obtained from www.exocarta.org. For the second categorization, all the proteins that could be found with GO terms of extracellular exosome, cytoskeleton, cell surface receptor, endosome as well as the ones that could be found in ExoCarta database were regarded as ‘Potential EV’ proteins; proteins with GO terms of blood microparticles, endoplasmic reticulum, mitochondrion as well as nucleosome were regarded as ‘Potential Contaminant’. The proteins that match both potential EV and potential contaminant terms are regarded as ‘Undetermined’.
Statistical models
All the analyses were performed in R 3.2.2 environment. Leave-one-out (LOO) cross-validation model was built based on random forest. Briefly, to predict each test sample (1), the rest of the sample (39) was used as training set to build the model. In order to select the most important features to maximize the removal of trivial features, a second layer of LOO models was built within the 39 training set samples. Second layer of LOO models were built in order to select the most important features: LOO model again built on every 38 sample to predict the 1 test sample sequentially, among the 39 second layer LOO models, only features that showed in ≥ 90% of the models (≥35) was selected. These selected features in the second layer LOO models were then used to build the final prediction model for the whole training set and calculate the probability of the test sample. The predicted probabilities for individual samples from the LOO cross-validation model were then used to plot the area under the curve (AUC). The final set of selected features were then collected by combining all the features retained in all the individual training models for the un-supervised cluster Heatmap.
Permutation prediction was performed by permuting the sample label (cancer/non-cancer) 10,000 times, same model as described earlier was applied to calculate the AUC for each permutation. Statistical significance p-value was given by the percentage of permutation AUC that are higher or equal to the AUC performance from the correct label.
All other statistical analyses include mean, SD and t–test, which were calculated either in Excel or in R environment. Graphics were also created in either R environment or Excel.
Results
Pluronic block copolymer F68 as a reagent to enrich EVs from plasma
In order to examine whether the pluronic copolymer could be used as a reagent to enrich EVs from plasma, we first examined if the enriched fraction contains EV size particles. Plasma was precipitated by 2% of F68 as described in ‘Methods’ section. Same protocol was also applied to UC purified cell line EVs diluted with or without plasma as positive controls. Dynamic light scatter (DLS) and TEM were used to determine the size distributions and morphology of the particles recovered, respectively.
As shown in , cell line EVs purified by UC were at size around 100 nm and ranged between 30 and 300nm, cover the EV sizes reported previously [Citation2]. Distribution in the cell line EVs precipitated by F68 in absence/presence of plasma showed consistent pattern to the cell line EV alone (). Size distributions for plasma EV enriched by F68 ranged between 20 and 100 nm (), which matches exactly the size of EV described previously [Citation2]. In contrast, the PBS buffer control only showed particles below 10 nm (), which is far below the expected EV size range, indicating that the particles in the buffer solution would not interfere with the analysis. Besides the major population, there were a small subpopulation of particles with a size distribution around ~1000 nm found in both cell line EVs enriched by UC and the plasma particles precipitated by F68 (, invisible in b, it exists but is very low). This small portion of this subpopulation may consist of particles made up of MVs, apoptotic bodies or potential EV aggregates.
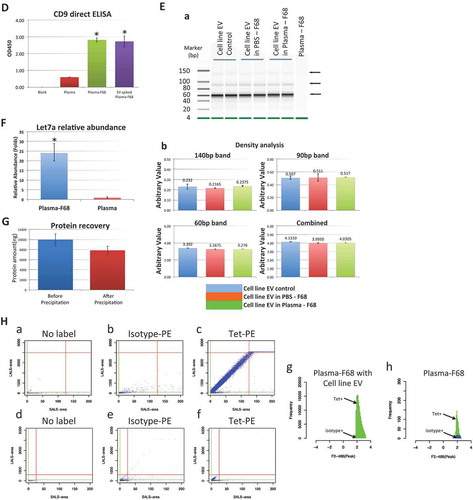
Figure 1. Characterization of the EVs enriched by pluronic copolymer F68. (A) DLS characterization of the particle size: (a) cell line EV, (b) cell line EV in PBS precipitated by F68, (c) cell line EV in plasma enriched by F68, (d) native plasma EV enriched by F68, (e) PBS buffer control; (B) TEM image of EVs from (a) the cell line EVs, (b) cell line EV in PBS precipitated by F68, (c) plasma with cell line EV spike-in precipitated by F68, (d) native plasma EVs enriched by F68 with arrow point to the label of the EV size. All scales of the images are 100 nm as shown by the scale bar on lower left corner of the images; (C) CD9 Immuno-gold TEM, EVs from (a) cell line EVs, (b) plasma spiked with cell line EVs and precipitated by F68 and (c) native plasma EV enriched by F68, were labelled with anti-CD9 antibody followed by secondary antibody with gold particle; (D) direct CD9 ELISA, 1 μg of proteins from each sample were used, two replicate per sample (*significantly higher than corresponding plasma sample, p < 0.05); (E) smRNA recovery analysis: (a) gel image from bioanalyser for comparing smRNA recovery efficiency, all samples were processed in the same way, equal volume of the eluted sample (1 μl) were analysed. Arrow point to the three most concentrated bands for density analysis; (b) density analysis of three distinct cell line EV smRNA bands (140 bp, 90 bp and 60 bp). Plots comparison including density from individual band and combined density from all three bands are shown; (F) relative abundance (ΔΔCt analysis) of let-7a microRNA from EV fraction enriched by F68 method compared to original plasma, 5 replicate for each sample (plasma as reference sample, miR-451 as reference miR; *significantly higher than corresponding plasma sample, p < 0.05); (G) protein recovery by F68 precipitation with cell line EVs in PBS. (H) Flow cytometry: (a–g) EVs enriched by F68 from plasma spiked with cell line EV; (d–h) native plasma EVs enriched by F68; (a, d) samples without labelling with antibody; (b, e) samples labelled with isotype antibody-PE antibody; (c, f) samples were labelesd with tetraspanin antibody-PE cocktail (CD9/63/81). Green line and red lines are the minimal/maximal thresholds for SALS-area and LALS-area, respectively, to gate the particle population. The extracted particle events are then projected in the event distribution histogram according to their PE fluorescence signal strength. (g) Event distribution histogram for EV enriched from plasma sample spiked with cell line EVs and (f) event distribution histogram for native plasma EVs enriched by F68. (Tet+: tetraspanin CD9/63/81 antibody-PE positive population; isotype+: isotype antibody-PE positive population) (For more details of the FL analysis, see Supplement Figure 1).
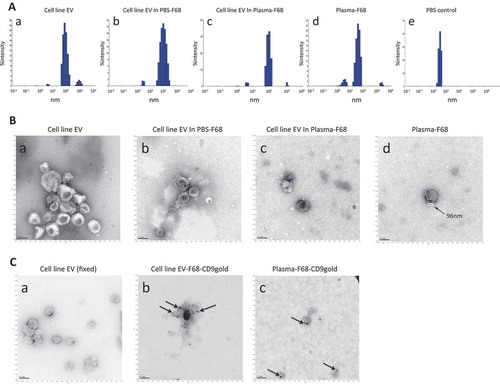
Figure 1. Continued
TEM was used to capture more morphological detail of the enriched particles. UC purified cell line EVs, alone or recovered by F68 precipitation (in presence or absence of plasma), showed intact round-shaped vesicles with membrane structure (), similar to the shape of EV that was described in a previous study [Citation2]. The native plasma particles recovered by F68 precipitation also showed similar shape with membrane structure and size (around 100 nm) (), which is consistent with the DLS results, indicating that the particles recovered from the plasma by the copolymer are in EV size range membrane structure.
To find out if the particles could be associated with tetraspanin, a common EV indicator, enriched plasma EVs were labelled with immune-gold by anti-CD9 antibody [Citation22]. For these scans, a modified protocol with ethanol/methanol fixation procedure was adopted. As a result, the shapes of EVs appeared to be more condensed and with lighter contrast compared to the regular protocol mentioned earlier. TEM scans shows cell line EVs alone or precipitated by F68 were able to be labelled with gold particles against CD9 marker as expected (), indicating the presence of CD9 on their surface. Native plasma EVs enriched by F68 were also able to be labelled with anti-CD9 gold particles (), indicating as a potential EV marker, tetraspanin CD9 were also associated with the native plasma EVs enriched by F68.
To confirm whether the CD9 EV marker was indeed enriched, the enriched plasma EV fraction recovered by F68 was further examined by a direct CD9 ELISA as shown in ). As expected, the cell-line EV-spiked plasma, after enriched by F68, showed significant higher signal compared to the same amount of plasma protein without enrichment (p < 0.05). Similarly, plasma EVs enriched by the copolymer also showed significant higher CD9 signals compared to the plasma control (p < 0.05), indicating EV marker CD9 was indeed enriched in the F68 precipitated fraction.
The EV recovery efficiency by the copolymer was also evaluated by the EV small RNA recovery from the precipitation of plasma samples with cell-line-generated EVs. Three distinct smRNA patterns (~140bp, ~90bp and ~60bp) could be detected from Vcap cell-line-generated EVs (). Such smRNA signature could be used to evaluate the recovery rate of EVs by densitometry analysis. We hypothesized that if the precipitate reagent is harmful to the EVs, for example, disrupting the membrane structure, internal material including the RNAs would be degraded or removed during the washes and reflect on the intensities of the smRNA signature bands. As shown in , patterns and intensity of the cell line EV in PBS precipitated by F68 are comparable to the direct RNA extraction from same amount of cell line EVs. At the same time, EV enriched from plasma sample with cell line EVs by F68 show same smRNA pattern as the cell line EV alone, and the intensities of those signature bands were also not that different compared to the cell line EV controls.
To further evaluate the cell line EV smRNA recovery rate by the precipitation more quantitatively, densitometry analysis was performed for all three individual smRNA bands and summarized in . As shown, no significant difference was observed from analysing respective smRNA bands between cell line EV, cell line EV precipitated by F68 and cell line EV in plasma precipitated by F68 samples (p > 0.05), nor by the combined density of all three signature bands between those three samples (p > 0.05). The recovery rate of each individual band for cell line EVs in PBS precipitated with F68 ranged from 93% to 100% with final combined rate of 97% in reference to the cell line EV control. Recovery rate of each individual band for cell line EVs in plasma precipitated with F68 also ranged from 97% to 102% with final combined rate of 98%. The average recovery rate in sample with cell line EVs in plasma is slightly more than the cell line EV in PBS alone. This may be partially due to some additional recovery of small RNAs from native EVs in plasma. High recovery rate of the spiked-in EVs smRNA suggested high recovery efficiency for spiked-in cell line EVs in presence of plasma, which in turn implies high recovery rate for the native plasma EVs.
miR let-7a has been reported to reside inside EVs [Citation23–Citation25] and it was highly expressed in our cell-line-generated EVs (Vcap). In addition to the evaluation of efficiency by the smRNA pattern and densities from bioanalyser, let-7a recovery rate was also examined by qPCR. No significant difference was observed in let-7a level between cell-line EV spiked plasma precipitated by F68 to same amount of cell line EV alone (Ct 22.3 ± 0.08 vs. Ct 22.8 ± 0.06, p > 0.05), indicating that the level of let-7a recovered by F68 was comparable to the level from same amount of original cell line EVs, consistent with the smRNA analysis that shows high recovery rate of EV smRNA from the F68 enrichment.
Let-7a level from native plasma EVs precipitated by F68 was also compared to the let-7a level from whole plasma extraction. There was no significant difference in recovered let-7a level in the plasma EVs enriched by F68 compared to same amount of plasma RNA extraction (Ct 31.6 ± 0.3 vs. Ct 31.4 ± 0.7, p > 0.05), indicating that the precipitation was able to fully recover most of the circulated plasma let-7a microRNAs. Meanwhile, relative enrichment of let-7a in comparison to the original plasma was also evaluated by ΔΔCt analysis by normalizing let-7a levels to miR-451a, one of the most abundant plasma miR reference [Citation17]. As shown in ), let-7a level in the plasma EVs fraction precipitated by F68 enriched more than 20-folds from the corresponding neat plasma, mostly because of the significant reduction in recovery of plasma high-abundant miR-451a (Ct 26.4 ± 0.5 vs. Ct 22 ± 0.7, p < 0.05). The results indicate that EV-related miR like let-7a was enriched by the F68 precipitation, while plasma-related miR was significantly reduced, suggesting that the high recovery of native plasma EVs could be obtained by the copolymer precipitation.
Alternatively, EV recovery efficiency was also analysed in terms of protein recovery rate. Cell line EVs in PBS were precipitated by F68 according to the above-mentioned protocol. Protein amount from before and after were then measured and the protein recovery rate was then calculated. As shown in ), about 80% of the cell line EV proteins (before: total protein amount is 9991 ± 1156 ng, after: 7852 ± 852 ng, 4 replicates for each sample) were recovered after the precipitation. The result is largely in agreement with the result that shows >90% recovery by smRNA densitometry analysis and let-7a qPCR analysis.
To further verify the EV identity of the particles recovered from F68 precipitation and the samples’ compatibility to downstream application, FL analysis was performed. EVs enriched by F68 precipitation were labelled with a fluorescence labelled anti-tetraspanin (CD9/63/81) antibody cocktail. shows FL analysis of the EVs enriched by F68 from plasma sample with cell line EVs: when the enriched particles were not labelled with any antibody, majority of the particles distributed horizontally along the SALS-area axis with very narrow LALS-area range (); similar pattern was also found for the same particles labelled with isotype antibody control (). In contrast, when the particles were labelled with anti-tetraspanin cocktail antibodies, a more condensed population was observed with an correlated LALS- area/SALS-area signal appeared on the plot and an angle against the horizontal minor population (). Such population was clearly distinct from the noise particles found in samples labelled with isotype antibody as well as non-labelled particles, suggesting that a positive binding by the tetraspanin antibody might have an effect on the integrated signal for the light scatter measurement on the EV size particles, indicating that the population of antibody-labelled EVs could be separated based on such plot from integrated area of light scatter signal.
Based on such findings, native plasma EVs enriched by F68 copolymer were also analysed by the same scheme. Similar pattern was found as shown in ; native EVs enriched from plasma, when labelled with tetraspanin antibody, show two distinct populations (), one aligned to the distribution from non-staining controls () as well as the sample stained with isotype antibody control (), and the other population show signal range similar to the positive control in .
Based on such findings on the light scatter plot, minimal and maximal threshold were determined manually (, green and red lines, for two-step gating see Supplement Figure 1) to select the particles events for fluorescence signal analysis. The selected populations were summarized in distribution histogram according to their PE fluorescence signals. EVs enriched from plasma sample with cell-line EVs showed that majority of the selected populations were tetraspanin positive (green) while the non-specific events that associated with isotype-antibody-PE labelling in the selected population were minimal (blue, almost not visible) (). In the native plasma EVs enriched by F68, similar pattern was also shown with more tetraspanin-positive events compared to the non-specific signal from isotype-PE labelling (), while the PE signal range in the selected population is very similar to that from cell line EV spiked plasma positive control shown in . This result further confirms that there is a subpopulation from native plasma EVs enriched by F68 which could be identified with similar tetraspanin expression pattern compared to the cell-line-generated EVs. (For more detailed description of the analysis and more controls, see Supplement Figure 1A-D.)
Proteomic profiling of plasma EVs enriched by pluronic copolymer
Our results have shown that the plasma particles enriched by F68 precipitation were EV-size membrane structures and contained RNA/miRNA, part of them contained EV marker tetraspanin proteins. While tetraspanins (CD9/63/81) are frequently used as potential EV markers, they are certainly not the universal markers for all EV populations from varieties of cell types [Citation22], especially in plasma. To evaluate what potential EV-related proteins could be detected and enriched by the copolymer method, shotgun semi-quantitative MS analysis was performed. In addition, in order to evaluate the purity of the plasma EV recovered, two commercially available PEG-based EV enrichment methods (Exoquick and TEI) were also used for comparison.
The EV fractions from same plasma were enriched from three different protocols: F68, Exoquick and TEI Kit. After the enrichment according to respective protocols, protein recoveries were first measured and compared: total protein recovery was 0.46% for F68 protocol, 16% from Exoquick protocol and 4.6% for TEI kit. As >99% of the protein mass in plasma were from high-abundant plasma proteins [Citation26], protein mass related to EV was not expected to be high. In contrast, higher yield might imply high-abundant plasma protein contamination instead.
Both high-abundant plasma proteins (including serum albumin as ALB, Alpha-2-macroglobulin as A2M and human plasma antibody as IgG) and the EV-related proteins (including β-actin as ACTB, Heat shock 70 as HSP70 and von Willebrand factor as VWF) were examined by the semi-quantitative MS analysis. ALB and IgG are the two most abundant plasma proteins, and A2M is also one of the high-ranking proteins in the plasma [Citation26]. High amount of ALB not only implies plasma protein contamination, but also might reduce the sensitivity of the MS by narrowing its dynamic range of analysis. On the other hand, CD9, ACTB, HSP70 and VWF were used as indicators of plasma EV enrichment. ACTB is cytoskeleton protein while HSP70 is cytosolic proteins and both were reported to be enriched in EVs [Citation27–Citation29]. VWF has been reported to be one of the protein markers found in platelet-derived EVs [Citation28,Citation29], which accounts for 70-90% of the EVs in the plasma. Protocols that could enrich plasma EV should be most likely to include this protein.
Western blots were first used to examine these general EV protein indicators. As shown in , the relative abundance of ALB in the neat plasma was obviously the highest of all; Exoquick and TEI kit were able to reduce that slightly but not very significantly. Level of ALB in plasma EV enriched by F68 dropped dramatically based on the intensity of the blotting. In comparison to A2M and IgG levels, EVs enriched by F68 methods consistently showed lowest contamination of these two proteins compared to other two methods. In contrast, Exoquick showed highly enrichment of A2M and IgG, while TEI kit showed slight reduction in A2M but almost same level of IgG compared to neat plasma.
Figure 2. Comparing different plasma EV enrichment methods. (a) Western blot comparison of plasma high-abundant protein and EV-related protein among three precipitation reagents used. Plasma high-abundant proteins include serum albumin (ALB), Alpha-2-macroglobulin (A2M), plasma antibody (IgG). Plasma EV-related proteins include CD9, β-Actin (ACTB), Heat Shock 70 (HSP70) and von Willebrand factor (VWF); (b) same comparison of the plasma high-abundant proteins and EV-related proteins by semi-quantitative shotgun proteomic analysis. (Exoq: Exoquick; TEI: Total Exosome Isolation Kit, 4 replicate per sample; *significantly lower compared to original plasma (p < 0.05); **significantly lower compared to Exoquick/TEI methods (p < 0.05); ***significantly enriched compared to original plasma; ****significantly enriched compared to Exoquick/TEI methods.)
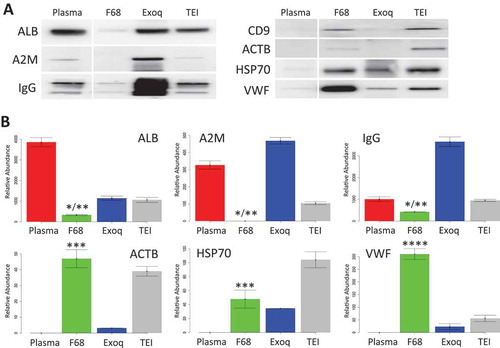
On the other hand, tetraspanin CD9 and ACTB were only detected in plasma EVs enriched by F68 and TEI kit but not detected in EVs enriched by Exoquick as well as neat plasma; HSP70 was enriched in all three methods compared to the neat plasma with highest level in EVs enriched by TEI kit, followed by EVs from F68 and Exoquick respectively. VWF was significantly enriched in plasma EVs enriched by F68, which is also higher than those from samples enriched by Exoquick and TEI kit respectively.
Semi-quantitative MS analysis of the same proteins as mentioned earlier is shown in ). As expected, the plasma contained the highest level of ALB. Plasma EVs enriched by Exoquick and TEI reduced ALB by about 70%, but both were still more than 400% higher than that from F68 method. A2M protein was significantly reduced by 65% in plasma EVs enriched by TEI kit compared to neat plasma (p < 0.05), A2M was completely removed from the plasma EVs enriched by F68; in contrast, plasma fraction enriched by Exoquick showed significant enrichment of A2M compared to others (p < 0.05). Plasma-enriched EVs by F68 method significantly reduced the recovery of IgG proteins to about 35% compared to the neat plasma (p < 0.05), while plasma fraction enriched by Exoquick again significantly enriched more IgG than the other two methods (p < 0.05).
Relative abundance of ACTB was enriched in plasma EV from both F68 and TEI protocols, while the enrichment of ACTB in Exoquick was significantly lower than the other two; HSP70 levels were also shown to be enriched by all three methods compared to neat plasma, with the highest by TEI and comparable level enrichment between Exoquick and F68. Most significantly, relative abundance of VWF was shown to be highly enriched in EV fraction by F68 protocol compared to others (p < 0.05), which was more than 16-folds higher than that from TEI Kit protocol and over 4-folds higher than that from Exoquick protocol.
The results between western blot and the semi-quantitative MS analysis were highly consistent, which gives the confidence of using such semi-quantitative method for global comparisons. Though CD9 was readily detected on the western blot, it and other tetraspanins were very difficult to be detected in MS, partially due to high hydrophobicity [Citation30]. However, the western blot of CD9 confirmed the enrichment of the tetraspanin protein in the plasma particles enriched by F68 precipitation, consistent with the result from ELISA, TEM and FL analysis.
Over 5000 proteins were identified by the shotgun proteomic analysis from all three methods. In ), all detected features regardless of the quantitation are all used in the Venn diagram. Set of features that are unique to each individual method that are not detectable in others are obtained. Over half of those proteins (2648) shared common features from all methods as well as in the corresponding plasma. Ninety-three unique proteins were identified from EVs enriched by F68 compared to others, which is quite similar to that from Exoquick (88) and slightly more than TEI kit (76). Compared to Exoquick and TEI kit, the unique protein numbers are quite even in either comparison (F68 vs. Exoquick: 629 vs. 614; F68 vs. TEI Kit: 587 vs. 595).
Figure 3. Categorization of plasma EVs proteins enriched from different enrichment method. (A) Venn diagram of unique and shared identified protein features (in terms of detectable and non-detectable) in MS analysis from F68, Exoquick, TEI kit as well as the corresponding plasma; (B) Venn diagram of unique and shared protein features identified from the semi-quantitative MS analysis from different EV enrichment protocols that are highly enriched from the corresponding neat plasma*; (C) **a/b: protein categorization for plasma EV enriched by F68, c/d: protein categorization for plasma EV enriched by Exoquick, e/f: protein categorization for plasma EV enriched by TEI. *The highly enriched feature is defined as the average of relative abundance is significantly higher (p < 0.05 by t-test) than the corresponding neat plasma by equal or over 10-folds from respective methods; **unique protein features for individual method identified in A and B were categorized by their GO term to extracellular exosome (Exo), cytoskeleton, cell surface, endosome, blood macromolecule, endoplasmic reticulum (ER), mitochondrial, Golgi apparatus and nucleosome. Potential EV includes the proteins from EV, cytoskeleton, cell surface, and endosome as well as proteins that matched in Exocarta. Potential contaminants include blood macromolecule, endoplasmic reticulum (ER), mitochondrial, Golgi apparatus and nucleosome category. Undetermined category includes the proteins that could be identified either as potential EV or as potential contaminants.
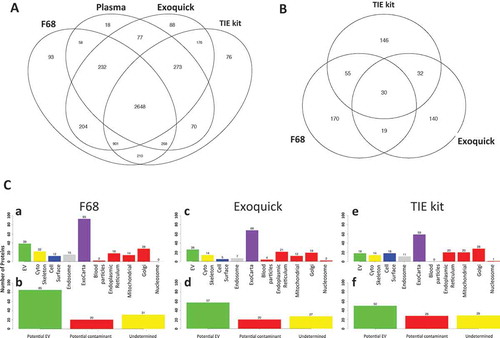
To find out what proteins were enriched in the precipitates recovered by different enrichment methods semi-quantitatively, features were first filtered by none-zero data points from individual methods as well as in the neat plasma, then the average relative abundance (from four technical replicates) were compared between individual method to the corresponding neat plasma to obtain fold change of particular feature in reference to the neat plasma. It gave a finite number of fold changes and at the same time t-tests were performed to gain statistical significance. The highly enriched features were defined as the average relative abundance should be significantly higher (p < 0.05 by t-test) than the corresponding neat plasma by equal or over 10-folds from respective methods. Therefore, sets of features with valid quantitative enrichment of equal or over 10-fold to neat plasma were obtained. These features from different methods were then used in the Venn diagram of ). Among the 592 shared protein features identified from all three EV enrichment methods with significant enrichment level from plasma, 170 are unique to F68 protocol, 140 proteins are unique to Exoquick protocol and 146 proteins from TEI kit.
To explore what kind of cellular functions that the enriched proteins could be involved, the identified proteins were then categorized according to their GO terms. Proteins were first categorized by their association with extracellular exosome (Exo), cytoskeleton, cell surface, endosome, blood macromolecule, endoplasmic reticulum (ER), mitochondrial, Golgi apparatus and nucleosome (). Cytoskeleton, cell surface and endosome-related proteins are ubiquitous, and they are most likely involved in the biogenesis of EV [Citation22]. Proteins were also queried against the EV protein database ExoCarta [Citation31] to match the EV proteins that have been identified from previous studies. These proteins were then categorized as ‘Potential EV’ proteins. In contrast, blood macromolecules, ER, mitochondrial, Golgi and nucleosome-related proteins are less unlikely to be present in EVs [Citation22] due to their different biogenesis pathway. They were then all categorized as ‘Potential Contaminant’. Meanwhile, proteins could be identified either as ‘Potential EV’ or as ‘Potential contaminant’ categories or are regarded as “Undetermined” ().
In highly enriched proteins from plasma EVs recovered by F68 (including the unique features for individual methods in ), 40 proteins were identified as potential EV proteins, 22 as cytoskeleton proteins, 12 as cell surface proteins, 15 as endosome related proteins and 93 proteins were found matched in ExoCarta EV protein database (). When categorized only by the three groups (‘Potential EV’, ‘Potential Contaminant’ and ‘Undetermined’), there are 85 EV-related proteins, 31 proteins are undetermined, and only 20 potential contaminants (). Same analysis was also applied to the samples from Exoquick and TEI kit preparations (). The EV-related proteins from F68 method showed 50% more than Exoquick (40 to 26) and over 2-folds more than TEI kit (40 to 18). Similarly, the number of highly enriched ‘Potential EV’ proteins in F68 protocol is about 50% more than corresponding Exoquick and TEI kit protocol (85 vs. 57 and 60, respectively). As the previous results showed that the F68 method significantly reduced the high-abundant plasma protein recovery in the enriched EVs fraction, we further showed that the F68 enrichment method was able to enrich more ‘Potential EV’ protein features compared to the other two precipitation-based protocol while dramatically reducing the plasma high-abundant protein contaminations.
NGS profiling of plasma EVs enriched by pluronic copolymer
Let-7a qPCR showed that the RNA inside plasma EVs enriched by F68 was well preserved. To further identify what RNAs species that exist in the plasma EVs enriched by F68, total RNA sequencing and smRNA sequencing were performed.
Total RNA profile is summarized in . The genes detected in the NGS were categorized according to the biotype from Ensemble GRCh38.85 RNA annotation in terms of RNA species count ()) as well as relative abundance according to FPKM (Fragment Per Kilo base of transcript Per Million mapped reads, )). Among all RNA species detected in the plasma EV enriched by F68, ~58.5% are protein coding RNA species (including protein coding 52%, alternative splicing species(retained_intron) ~6.5%); about 5.7% of the transcripts match the non-sense mediated degradation category (NMD), consistent with a previous study that showed RNA species subjected to RNA degradation could be found in EVs [Citation32]. All other species are different subtypes of non-coding RNAs, including 10% transcripts without valid Open Reading Frame (ORF); 4.3% are long, intervening noncoding RNA (lincRNA), which also have been reported to be packaged into EVs [Citation33,Citation34]; 2% MtRNA, including mitochondria-origin tRNA and rRNA, which are also reported in previous researches [Citation32]; other non-coding RNA species, such as multiple antisense RNA, snRNA, snoRNA, Y_RNA that have been reported to be packaged into EVs [Citation32,Citation33,Citation35], were also found in our study.
In contrast, the relative abundance analysis showed that Mt_tRNA was the most abundant RNA species from the plasma vesicle fraction precipitated by F68, accounted for more than 80%, followed by protein_conding transcripts (7.6%). Though quite some species of NMD RNA were identified, their levels are relatively low in the vesicle fraction, only accounts for less the 0.08%; Y_RNA has also relatively small amount of species number, but it accounts for more than 5% abundance of the total RNAs, consistent with the previous report that considerable amount of Y_RNA was found in EVs [Citation32].
Figure 4. NGS profiling of plasma EVs enriched by pluronic copolymer F68. Total RNA profiling were categorized according to their biotype (https://www.gencodegenes.org/gencode_biotypes.html) in two aspects: (A) RNA species numbers are summarized according to the RNA biotypes, frequencies of each RNA biotypes in reference to the total RNA species number are indicated in the pie chart; (B) frequency in the pie chart accounts for the combined relative expression level in terms of FPKM for each biotype. (C) Heatmap showing supervised hierarchical clustering of smRNA from plasma EV enriched by F68 and their corresponding plasma, from blue to red indicates smRNA expression level (log2 normalized expression). (D) Density plot of smRNAs relative abundance in comparison to plasma in terms of fold changes. Fold changes were indicated in log2 scale, red arrow to the smRNA population that are significantly enriched from the corresponding plasma.
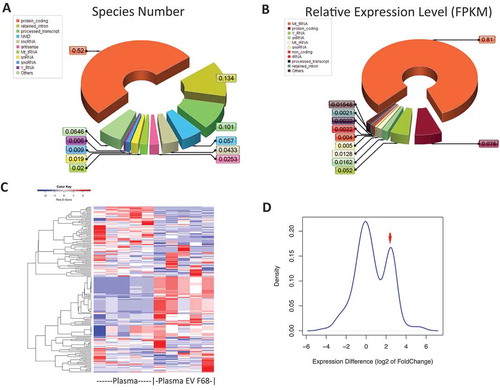
Since the total RNA sequencing have limited capability in examining all short RNA fragments, smRNA sequencing was also performed by a ligation-based sequencing method [Citation36], whose optimal templates are 5ʹ phosphorylated RNAs, such as miRNA and those smRNA derived from tRNA (tRFs) and Y_RNA (RNY) but act like miRNA [Citation37,Citation38]. Carious smRNA species were observed that mapped to miRNA, tRFs, RNY, piRNA as well and lincRNA with length range from 18 to 40 nucleotides. To evaluate if such smRNA profile could distinguish the enriched EVs from the corresponding plasma, a supervised-hierarchical clustering of the smRNA species was performed with the heat map shown in ). Two smRNA clusters were formed, one enriched and the other faded in the enriched EVs compared to the corresponding plasma profiles. In addition, relative quantitative measurement showed a bimodal distribution of smRNA in reference to plasma, with one set of smRNA features enriched from the plasma ()).
Comparing plasma EVs from advanced breast cancer non-cancer samples
The above-mentioned results proved that the purposed pluronic copolymer method was able to enrich plasma EV with high efficiency with less contamination of high-abundance plasma protein. To explore its potential utility, plasma EVs from 20 breast cancers with advanced clinical stages (clinical stage III and IV) and 20 age-matched non-cancers were enriched. The semi-quantitative MS profiles were then compared to find out whether protein signatures related to breast cancer at such clinical stage could be identified from the enriched plasma EVs by F68.
Total 2108 proteins were detected in both cancer and non-cancer groups, when categorized by their respective GO term as described earlier, over 300 proteins might directly be related to EV, 185 proteins related to cytoskeleton, 76 related to cell surface proteins, 74 related to endosome and total 786 could be found in ExoCarta database ()). Overall, 654 protein features were categorized as “Potential EV” features, 282 as “Undetermined” and 146 as “Potential Contaminant” that could be come from non-EV related organelles. Over 4 times of the potential EV proteins were identified compared to the potential non-EV contaminant, which is consistent with result from the above methodology characterization.
Figure 5. Clinical comparison between advanced breast cancer and non-cancer. (A) Age distribution in cancer and non-cancer group in Whiskers box plot; (B) the unique proteins identified in the patient sample (protein detected at least in 10 samples in each group) were categorized to EV, cytoskeleton, cell surface, endosome, blood macromolecule, endoplasmic reticulum (ER), mitochondrial, Golgi apparatus and nucleosome. Potential EV, potential contaminants and un-determined category are separated as described above by their GO term; (C) proteins overlapping between four breast cancer cell lines generated EVs and the clinical patient plasma sample EVs; (D) volcano plot of the cancer vs. non-cancer plasma EV samples, the t-test p-value (-log10) was plotted against the fold changes of the average relative abundance between cancer and non-cancer plasma EV samples; (E) relative abundance of protein enriched from plasma EV comparison between cancer and non-cancer group by Whiskers box plot, a: ACTB, b: VWF, c: ALB, d: A2M and e: IgG. Comparison of relative protein abundance from enriched plasma EV (blue) to the neat plasma(red) in dot plot from individual patients, f: ACTB, g: VWF, h: ALB, i: A2M and j: IgG. Pearson correlation between plasma EV and neat plasma was also calculated. Y axis is the log10 transformed relative abundance.
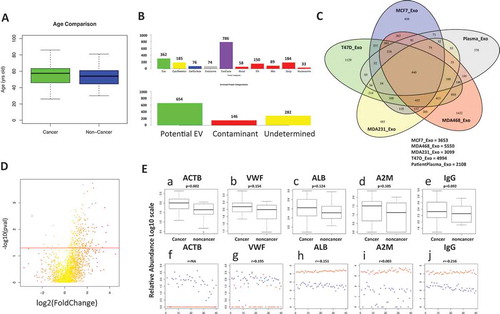
In order to obtain the features that could be most likely related to breast cancer and its EVs, proteomic profiling were also performed on the four EVs generated from breast cancer cell lines, including MCF7, MDA-MB-468, MDA-MB-231 and T47D ()). A total of 3653, 5550, 3099 and 4994 proteins were detected in respective cell-line-generated EVs. About 872 proteins are shown to be shared in all four kinds of EVs.
One thing in common for all four breast cancer cell lines is that they have all shown aggressive, metastasis and invasive behaviour in various studies. We hypothesized that there might be some common features related to such cancer cell aggression behaviour. If such common factors exist in cell line EVs, they might also likely exist in the breast cancer cells from patients. Ideally, they also might be detectable from the enriched plasma EVs. By overlapping the shared proteins from cell line EVs to the enriched plasma EVs from patients, 440 proteins were identified as common features between EVs generated by all four aggressive breast cancer cell lines and the enriched plasma EVs from patients. These 440 features were not only detectable in enriched plasma EVs, but also their potential existences in EVs as well as their relevance to breast cancer cells were verified by such overlapping, suggesting that these 440 features were the features most likely to be associated with breast cancer EVs in the plasma.
) shows the comparison between cancer and non-cancer groups of the 2108 features detected in the patient samples. About 217 features show statistically significant difference between cancer and non-cancer groups (p < 0.05). About 197 features show that the relative abundance are significantly higher in cancer group compared to non-cancer group by equal or more than 1.5-folds (p < 0.05), while six of these features show that relative abundance are significantly lower in the cancer group compared to non-cancer group by equal or less than 0.5-folds (p < 0.05). More features were on the elevated level side, which is consistent with the expectation of EVs enrichment.
General features found in plasma EVs and high-abundant plasma proteins were compared between cancer and non-cancer group (), as well as between plasma EV fraction and the neat plasma (). As general EV marker, ACTB showed statistically significant between cancer and non-caner group ( p < 0.05). In contrast, VWF showed no statistically significant difference ( p > 0.05). Similarly, the high-abundant plasma protein such as ALB, A2M and IgG also showed no statistically significant difference between cancer and non-cancer group (, p > 0.05), indicating the source of high-abundant plasma protein contaminations in the enriched EV fraction were roughly consistent across groups. At the same time, shows that the general EV markers ACTB and VWF are both significantly higher in the enriched EV fraction compared to the corresponding neat plasma (p < 0.05). In contrast, all plasma high-abundant proteins (ALB, A2M and IgG) show magnitudes higher in neat plasma sample compared to the corresponding enriched EV fraction, consistent with the above result that the EVs from the patient plasma were enriched by the F68 copolymer (p < 0.05). Meanwhile, there was little correlation in the high-abundant plasma proteins in the EV fractions with those from the corresponding neat plasma, suggesting trace of plasma leftover should not be the cause of such signal, especially for those proteins that were categorized as ‘Undetermined’ that showed potential in either EV or plasma proteins category.
In order to assess the potential classification power by the plasma EV proteomic profiles, a leave-one-out (LOO) cross-validation model was built. The prediction performance in terms of the AUC value was obtained. ) shows the overall AUC performance is 0.7625 with optimal specificity of 0.9 and sensitivity about 0.6. To examine whether such performance was due to a random chance, AUC performance was calculated from 10,000 randomly permutations of the sample label. Distribution of AUC performance from the permutations is shown in ). Compared to the permutation AUC performance, the AUC 0.7625 obtained from the correct sample permutation is statistically significant (), p < 0.05), indicating that the classification performance between the original cancer/non-cancer group was not due to a random chance, suggesting the features from enriched plasma EVs was capable of separating the advanced breast cancer patient from non-cancer controls.
Figure 6. Classification performance and feature selection by LOO cross-validation model. (A) Classification performance of the semi-quantitative mass spectrometry data was evaluated by a LOO cross-validation model based on random forest. The overall performance is AUC 0.7625; (B) classification performance on random permutations. Distribution of the AUC performance from all permutations was shown as blue, red vertical line marks the AUC performance of the correct sample label. p-Value is calculated by the percentage of permutation with equal of higher AUC performance than the original AUC; (C) non-supervised hierarchical clustering of the patient samples by the features selected from the prediction model above. Two clusters were clearly formed in the patient samples, cluster 1 contains 16 cancers and 3 non-cancers (80% sensitivity), cluster 2 contains 4 cancer and 17 non-cancers (85% specificity).
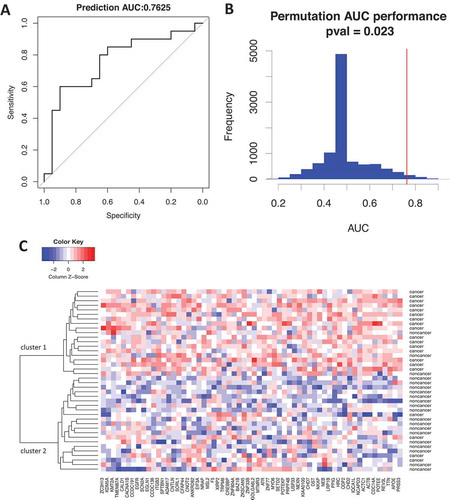
Sixty features that consistently contributed to the model in differentiating cancer from non-cancer sample were selected. An un-supervised hierarchical clustering was performed to classify the current patient samples. As shown in ), two clusters were clearly formed, one with mostly cancer sample (16 cancers vs. 3 non-cancers) and the other is mostly non-cancer (17 non-cancers vs. 4 cancers), with sensitivity of 80% and specificity of 85%, confirms the above feature selection process was able to screen features that separates advanced cancer patients from non-cancer controls.
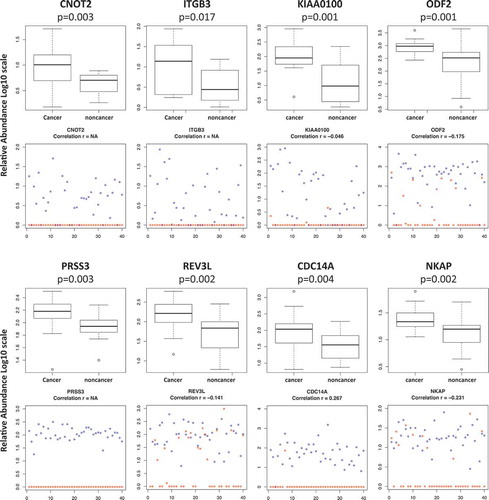
To further illustrate that the signal detected in the plasma EVs for the selected features was not from the trace of leftover plasma, shows some of those features with the most significant difference between advanced breast cancer and the non-cancer patients, as well as the comparison of their signals in plasma EVs to the corresponding neat plasma. Not only these features showed significantly higher relative abundance in advanced breast cancer group compared to the control group (p < 0.05), but also they were mostly only detected in the enriched plasma EVs but not the corresponding neat plasma. Little correlation was found between the signals in enriched plasma EVs and the neat plasma, indicating that the selected features were most likely to be enriched by the proposed procedure instead of trace of the plasma leftover.
Figure 7. Top features selected comparison between advanced breast cancer/non-cancer groups as well as comparison between enriched plasma EVs and the neat plasma. Whisker Boxplot comparison between cancer/non-cancer; dot plots comparison of individual enriched plasma EV and their corresponding neat plasma (blue: plasma EV, red: neat plasma).
Discussion
Secreted EV encompasses a very rapidly growing scientific field in biology and medicine. According to International Society for Extracellular Vesicles, it is yet technically challenging to obtain a totally pure EV fraction free from non-vesicular components for functional studies. Though EVs are proven to contain proteins, lipid, mRNA and non-coding RNA species, the field of EV has not yet matured to the point that a list of ‘specific markers’ could be given so that the EV population could be clearly separated from each subpopulation as well as the contaminants [Citation22].
An ideal plasma EV enrichment method should be that the EV fraction is enriched with high efficiency while containing as less as possible of the plasma protein contaminations. In terms of the efficiency, reproducibility and simplicity, precipitation-based methods are still more competitive compared to UC- or IP-based methods. However, the applications of EV profiling by precipitation-based methods depends on the selectivity of the precipitation reagent as well as the compatibility of the resulted EVs fraction to the downstream analysis. There is no single platform or characterization yet, by its own, sufficient to indicate the enrichment of EV. Multiple platforms and characterization might be more appropriate to evaluate the potential enrichment. In our study, we showed that the Pluronic copolymer F68 was able to enrich the plasma EVs with membrane structure, ranging from 20 to 100 nm in size, contains highly enriched set of EV-related proteins as well as varieties of RNA species. At the same time, with less high-abundant plasma proteins, contamination was detected in the enriched EV fraction. The enriched EVs were also proven to have broad compatibility for variety of downstream applications including TEM, FL and MS without any additional procedures to remove the copolymer. According to the minimal experimental requirements for definition of EVs, at least three proteins should be reported in at least semi-quantitative manner in any EV preparation [Citation22]. Here we reported not only the higher enrichment of EV related protein, including CD9, ACTB, HSP70 and VWF, but also lower the potential high-abundant protein contaminants (ALB, A2M and IgGs) from plasma by two semi-quantitative methods. Shotgun proteome further found that the method enriched more potential EV proteins than others. However, since unique features were still found in different enrichment methods, the existence of such EV subpopulation that only could be enriched by specific reagent could not be excluded.
In another remark, according to the minimal experimental requirements for definition of EVs, markers that are supposed to be absent or under-represented may also necessary to evaluate the purity of the enriched EVs[Citation22], semi-quantitative comparison for couple of such markers is shown in Supplement Figure 2, including cytochrome c (CYCS, mitochondria), calnexin (CANX, ER) and endoplasmin B1 (HSP90B1, ER). Compared to other methods, F68 precipitation was the only method that consistently showed significant lower enrichment of these mitochondria and endoplasmic reticulum protein markers in both comparisons to neat plasma and to other methods. However, it is worth to note that the meaning of interpreting absence or under-represented marker that is already absent or under-represented in plasma might be limited and controversial, partially because lack of a standard on what should be considered as normal for such markers in plasma sample as well as incomplete understanding of the cellular vesicles communications.
Almost half of the proteins that are highly enriched by F68 method (122 out of 263) were not able to match the categories described in ), further studies might be necessary to illustrate whether these proteins are cargos that are packaged by either specific or non-specific means into EVs other than through the EV biogenesis pathway. Interestingly, most of these proteins belong to three sub-categories, including integral components of membrane, cytoplasm (cytosol) and nucleus proteins. The integral components of membrane include those proteins that might involve in interaction with the membrane bound receptor signalling cascades, such as C-C chemokine receptor type 8 (CCR8), cysteinyl leukotriene receptor 2 (CYSLTR2), probable G-protein coupled receptor 151 (GPR151), ATP-binding cassette sub-family G member 5 (ABCG5); a lot of proteins were identified as cytoplasm/cytosol and nucleus proteins with RNA/DNA binding capability, including YTH domain-containing family protein 1 (YTHDF1), cysteine/serine-rich nuclear protein 1 (CSRNP1), PHD finger protein 21A (PHF21A), RNA-binding protein 42 (RBM42), zinc finger protein (ZFAT), transducin-like enhancer protein 1 (TLE1), homeobox-containing protein 1 (HMBOX1), single-stranded DNA cytosine deaminase (AICDA), Krueppel-like factor 17 (KLF17), which are involved in various functions from potential translation regulation, tumour suppressor to transcription factor activity. The finding is consistent with the study that reveals that transcriptional regulator proteins were highly abundant in EVs [Citation39], the potential biological implication of such factors being highly enriched in the plasma EVs that might deserve more investigation.
Although it has been shown that a variety of RNA species exist in EVs [Citation32], profiling of RNA/smRNA from plasma EVs has been challenging. The profile was highly dependent on the method used in preparing the EV fraction. This was further complicated by the fact that smRNAs are well-known to circulate in the bloodstream and other body fluids in a stable, cell-free status [Citation40], resulting in the RNA profiles variation by different methods and may contain undistinguishable contaminants by various degrees. Despite that, with highly enriched EV-related protein and much less enrichment for high-abundant plasma proteins in the current method, supporting improvement could be achieved in the current study.
In a broader view, the RNA/smRNA profiles for plasma EVs enriched by F68 were consistent with other PEG-based enrichment methods from other studies (either from Exoquick or from TEI kit preparations) [Citation32,Citation41]. miRNA, piRNA, tRNA, tRFs, Y_RNA, RNY, MtRNA, protein_coding RNA, rRNA, lincRNA as well as snRNA and snoRNA were all detectable. Interestingly, large amount reads were mapped to Mt_RNA. There might be two explanations: (1) small mitochondrial debris might still be co-precipitated with the copolymer, which is supported by the existence of small portion of particles with larger size, even in the UC cell line EV preparations; (2) alternatively, a recent study showed that mitochondria are also able to generate small vesicular carriers that transport mitochondrial contents to other intracellular organelles. One of the targets of such transportation from mitochondria was the late endosome, or MBV, where the EVs were formed [Citation42], suggesting communication between mitochondrial and endosome, or maybe MVB as a result, which might be one of the reason for such high level of mitochondrial RNA in the plasma EV fraction.
To explore the potential application for this enrichment method, proteomic profiling were performed and compared between the plasma EVs enriched from advanced breast cancer and non-cancer controls. The breast cancer plasma samples were all from advanced clinical stage (III and IV), the reasons of using such settings are in two-folds: (1) according to the definition of breast cancer stages (https://www.cancer.net/cancer-types/breast-cancer/stages), a major character of clinical stage III and IV is that cancer of any size has spread to 4-9 axillary lymph nodes or has spread to the chest wall or caused swelling, or ulceration of the breast, as well as further spread to other organs. Symptoms like these might imply at these two stages, cancer cells were actively spreading to distal tissue and maybe constantly in contact with the bloodstream, implying cancer-cell-generated EVs may be more likely expelled into the bloodstream. Therefore, proteins related to cancer aggression behaviour at such advanced stages might be more likely to be captured from plasma EVs. (2) By adopting such settings, features selected from the model were expected to be related to the cancer aggression, metastasis or invasion, characters that are generally associated with such advanced stages. Therefore, it provides a clear direction for potential result interpretation.
Feature selection process in the study also focused on those that were shared between enriched plasma EVs and breast cancer cell line EVs. This is because the purity of the enriched EVs is yet to be perfect even after the enrichment method had been improved. Therefore, without such screening, it might be difficult to ensure the association of the observed features to EVs. Additionally, EVs in plasma may come from may come from variety of sources but not necessary related to breast cancer cells. By selecting the features whose EV existence were verified from the breast cancer cell lines, the potential relevance of these features to the actual breast cancer status could be significantly increased. Combined with these two filters, the resulting features may have a better chance to associate with breast cancer at that stage.
Characterizations of the four different breast cancer cell lines, including MCF7, MDA-MB-231, MDA-MB-468 and T47D, have been done elsewhere [Citation43]. Though genotypes, morphologies as well as growth rates might be different for these cell lines, one character in common for these cell lines is that they are all derived from cancer metastasis/invasion sites [Citation44–Citation47] and they are all able to show aggression, metastasis and invasion behaviour in different models [Citation43,Citation48], implying certain common factor might be involved in regulating such aggression/metastasis/invasion behaviour. One of the expectations for the clinical comparison study was to find out whether such common features related to cancer aggression could be found in the plasma EV and whether these features could be used to differentiate the cancer patient from the non-cancer patients.
In the LOO cross-validation model, 60 core features were selected. They are features that were detected in both patient plasma EVs and the breast cancer cell-lines-generated EVs. These features were able to separate the advanced cancer sample population from non-cancer patient in either the cross-validation model or by un-supervised hierarchical cluster method. Interestingly, according to the information from The Human Protein Atlas database [Citation49–Citation51], as shown in , the expression of over 70% of these features (43 out of 60) have been confirmed by immunohistochemistry on the breast cancer tissues slides, only 17 proteins are yet to be confirmed, partially because lacking of suitable antibodies, consistent to our expectation by screening the initial features from enriched plasma EVs with features from EVs generated by breast cancer cell lines.
Table 1. Summary of 60 Features selected from the LOO model.
Also according The Human Protein Atlas database, the prognostic performances of these 60 features were also analysed by respective RNAseq data sets generated by The Cancer Genome Atlas (TCGA). The analysis was based on the FPKM value of each gene, patients were classified into two expression groups and the correlation between expression level and patient survival was examined by Kaplan–Meier survival estimators, and the survival outcomes of the two groups were compared by log-rank tests (https://www.proteinatlas.org/). Almost half of those protein (28 out of 60) features show significant prognostic values on various cancers, implying their potential relevance to breast cancer.
Also through literature searching, 28 out of 60 features show potential association to breast cancer aggression/metastasis/invasion () by previous studies. For example, dual specificity protein phosphatase (CDC14A) was shown to be recruited to the cell leading edge to regulate cell migration and adhesion in breast cancer cells [Citation97]; CCR4-NOT transcription complex subunit 2 (CNOT2) was shown to promote proliferation and angiogenesis via VEGF signalling in breast cancer cells [Citation98]; downregulation of Integrin beta-3 (ITGB3) modulates cell adhesion and invasion by interrupting Erk/Ets1 network in triple-negative breast cancer [Citation99]; tumour but not stromal expression of ITGB3 is essential and required early bone-metastatic breast cancer [Citation100]; high levels of antigen MLAA-22 (KIAA0100) expression were associated with poor prognosis in patients with invasive ductal carcinomas of the breast [Citation101]. Observing such large portion of features to be related to cancer aggression, metastasis and invasion is consistent to our initial expectation.
It is worth emphasizing that even though the EV fraction precipitated by the copolymer method was much cleaner, we still could not exclude the possibility of contamination from certain amount plasma or other organelle debris, as they might be indistinguishable from EV in terms of size as well as membrane properties. Indeed, our result showed the presence of a small percentage of larger vesicles and enrichment of some non-EV-related organelle proteins. On the other hand, lack of universal EV unique markers might raise some questions regarding the categorization accuracy, as proteins might locate in multiple organelles. As more studies are emerging, more explicit definition would be expected. Also in terms of detected EV related proteins, evaluating different enrichment method might be difficult since they all have their unique EV proteins subset, the possibility of having common and different EV populations targeted for different methods could not be excluded. However, despite these concerns, the simple procedure, high enrichment and much less high-abundant plasma protein contamination in the current method might offer more advantages.
Supplemental_files.zip
Download Zip (17 MB)Acknowledgments
We thank the following people who helped in preparing the experiment as well as collecting the raw data: Gerri Ortiz for preparing the cell line EVs as well as helping in NGS procedures and Janet Duncan for running the flow cytometry and collecting the raw data and Caris CMI sequencing facility.
Supplemental data for this article can be accessed here.
Disclosure statement
No potential conflict of interest was reported by the authors.
Related Research Data
References
- Orozco AF, Lewis DE. Flow cytometric analysis of circulating microparticles in plasma. Cytometry A. 2010;77:1–23.
- Stoorvogel W, Kleijmeer MJ, Geuze HJ, et al. The biogenesis and functions of exosomes. Traffic. 2002;3:321–330.
- Livshits MA, Khomyakova E, Evtushenko EG, et al. Isolation of exosomes by differential centrifugation: theoretical analysis of a commonly used protocol. Sci Rep. 2015;5:17319.
- Thery C, Amigorena S, Raposo G, et al. Isolation and characterization of exosomes from cell culture supernatants and biological fluids. Curr Protoc Cell Biol. 2006;30 (1):3.22.1–3.22.29.
- Antes TJ, Kwei K. Methods for microvesicle isolation and selective removal. System Biosciences LLC, US20130337440A1; 2013.
- Helwa I, Cai J, Drewry MD, et al. A comparative study of serum exosome isolation using differential ultracentrifugation and three commercial reagents. PLoS One. 2017;12:e0170628.
- Caradec J, Kharmate G, Hosseini-Beheshti E, et al. Reproducibility and efficiency of serum-derived exosome extraction methods. Clin Biochem. 2014;47:1286–1292.
- Van Deun J, Mestdagh P, Sormunen R, et al. The impact of disparate isolation methods for extracellular vesicles on downstream RNA profiling. J Extracell Vesicles. 2014;32858.
- Kabanov AV, Lemieux P, Vinogradov S, et al. Pluronic block copolymers: novel functional molecules for gene therapy. Adv Drug Deliv Rev. 2002;54:223–233.
- Shelat PB, Plant LD, Wang JC, et al. The membrane-active tri-block copolymer pluronic F-68 profoundly rescues rat hippocampal neurons from oxygen-glucose deprivation-induced death through early inhibition of apoptosis. J Neurosci. 2013;33:12287–12299.
- Firestone MA, Wolf AC, Seifert S. Small-angle X-ray scattering study of the interaction of poly(ethylene oxide)-b-poly(propylene oxide)-b-poly(ethylene oxide) triblock copolymers with lipid bilayers. Biomacromolecules. 2003;4:1539–1549.
- Lee RC, River LP, Pan FS, et al. Surfactant-induced sealing of electropermeabilized skeletal muscle membranes in vivo. Proc Natl Acad Sci U S A. 1992;89:4524–4528.
- Marks JD, Pan CY, Bushell T, et al. Amphiphilic, tri-block copolymers provide potent membrane-targeted neuroprotection. Faseb J. 2001;15:1107–1109.
- Melnichenko AA, Aksenov DV, Myasoedova VA, et al. Pluronic block copolymers inhibit low density lipoprotein self-association. Lipids. 2012;47:995–1000.
- Schneider CA, Rasband WS, Eliceiri KW. NIH Image to ImageJ: 25 years of image analysis. Nat Methods. 2012;9:671–675.
- Trapnell C, Williams BA, Pertea G, et al. Transcript assembly and quantification by RNA-Seq reveals unannotated transcripts and isoform switching during cell differentiation. Nat Biotechnol. 2010;28:511–515.
- Rekker K, Saare M, Roost AM, et al. Circulating microRNA Profile throughout the menstrual cycle. PLoS One. 2013;8:e81166.
- Chambers MC, Maclean B, Burke R, et al. A cross-platform toolkit for mass spectrometry and proteomics. Nat Biotechnol. 2012;30:918–920.
- Kim S, Pevzner PA. MS-GF+ makes progress towards a universal database search tool for proteomics. Nat Commun. 2014;5:5277.
- Krey JF, Wilmarth PA, Shin JB, et al. Accurate label-free protein quantitation with high- and low-resolution mass spectrometers. J Proteome Res. 2014;13:1034–1044.
- Sardiu ME, Washburn MP. Enriching quantitative proteomics with SI(N). Nat Biotechnol. 2010;28:40–42.
- Lotvall J, Hill AF, Hochberg F, et al. Minimal experimental requirements for definition of extracellular vesicles and their functions: a position statement from the International Society for Extracellular Vesicles. J Extracell Vesicles. 2014;3:26913.
- Ohshima K, Inoue K, Fujiwara A, et al. Let-7 microRNA family is selectively secreted into the extracellular environment via exosomes in a metastatic gastric cancer cell line. PLoS One. 2010;5:e13247.
- Hannafon BN, Carpenter KJ, Berry WL, et al. Exosome-mediated microRNA signaling from breast cancer cells is altered by the anti-angiogenesis agent docosahexaenoic acid (DHA). Mol Cancer. 2015;14:133.
- Zhang J, Li S, Li L, et al. Exosome and exosomal microRNA: trafficking, sorting, and function. Genomics Proteomics Bioinformatics. 2015;13:17–24.
- Hortin GL, Sviridov D, Anderson NL. High-abundance polypeptides of the human plasma proteome comprising the top 4 logs of polypeptide abundance. Clin Chem. 2008;54:1608–1616.
- Thery C, Zitvogel L, Amigorena S. Exosomes: composition, biogenesis and function. Nat Rev Immunol. 2002;2:569–579.
- Badimon L, Suades R, Fuentes E, et al. Role of platelet-derived microvesicles as crosstalk mediators in atherothrombosis and future pharmacology targets: a link between inflammation, atherosclerosis, and thrombosis. Front Pharmacol. 2016;7:293.
- Ge R, Tan E, Sharghi-Namini S, et al. Exosomes in cancer microenvironment and beyond: have we overlooked these extracellular messengers? Cancer Microenviron. 2012;5:323–332.
- Buschow SI, van Balkom BW, Aalberts M, et al. MHC class II-associated proteins in B-cell exosomes and potential functional implications for exosome biogenesis. Immunol Cell Biol. 2010;88:851–856.
- Keerthikumar S, Chisanga D, Ariyaratne D, et al. ExoCarta:a web-based compendium of exosomal cargo. J Mol Biol. 2016;428:688–692.
- van Balkom BW, Eisele AS, Pegtel DM, et al. Quantitative and qualitative analysis of small RNAs in human endothelial cells and exosomes provides insights into localized RNA processing, degradation and sorting. J Extracell Vesicles. 2015;4:26760.
- Raposo G, Stoorvogel W. Extracellular vesicles: exosomes, microvesicles, and friends. J Cell Biol. 2013;200:373–383.
- Hewson C, Capraro D, Burdach J, et al. Extracellular vesicle associated long non-coding RNAs functionally enhance cell viability. Noncoding RNA Res. 2016;1:3–11.
- Khurana R, Ranches G, Schafferer S, et al. Identification of urinary exosomal noncoding RNAs as novel biomarkers in chronic kidney disease. Rna. 2017;23:142–152.
- Shore S, Henderson JM, Lebedev A, et al. Small RNA library preparation method for next-generation sequencing using chemical modifications to prevent adapter dimer formation. PLoS One. 2016;11:e0167009.
- Venkatesh T, Suresh PS, Tsutsumi R. tRFs: miRNAs in disguise. Gene. 2016;579:133–138.
- Hizir Z, Bottini S, Grandjean V, et al. RNY (YRNA)-derived small RNAs regulate cell death and inflammation in monocytes/macrophages. Cell Death Dis. 2017;8:e2530.
- Ung TH, Madsen HJ, Hellwinkel JE, et al. Exosome proteomics reveals transcriptional regulator proteins with potential to mediate downstream pathways. Cancer Sci. 2014;105:1384–1392.
- Liang H, Gong F, Zhang S, et al. The origin, function, and diagnostic potential of extracellular microRNAs in human body fluids. Wiley Interdiscip Rev RNA. 2014;5:285–300.
- Huang X, Yuan T, Tschannen M, et al. Characterization of human plasma-derived exosomal RNAs by deep sequencing. BMC Genomics. 2013;14:319.
- Sugiura A, McLelland GL, Fon EA, et al. A new pathway for mitochondrial quality control: mitochondrial-derived vesicles. EMBO J. 2014;33:2142–2156.
- Holliday DL, Speirs V. Choosing the right cell line for breast cancer research. Breast Cancer Res. 2011;13:215.
- Soule HD, Vazguez J, Long A, et al. A human cell line from a pleural effusion derived from a breast carcinoma. J Natl Cancer Inst. 1973;51:1409–1416.
- Brinkley BR, Beall PT, Wible LJ, et al. Variations in cell form and cytoskeleton in human breast carcinoma cells in vitro. Cancer Res. 1980;40:3118–3129.
- Cailleau R, Olive M, Cruciger QV. Long-term human breast carcinoma cell lines of metastatic origin: preliminary characterization. In Vitro. 1978;14:911–915.
- Keydar I, Chen L, Karby S, et al. Establishment and characterization of a cell line of human breast carcinoma origin. Eur J Cancer. 1979;15:659–670.
- Fantozzi A, Christofori G. Mouse models of breast cancer metastasis. Breast Cancer Res. 2006;8:212.
- Uhlen M, Fagerberg L, Hallstrom BM, et al. Proteomics. Tissue-based map of the human proteome. Science. 2015;347:1260419.
- Uhlen M, Oksvold P, Fagerberg L, et al. Towards a knowledge-based Human Protein Atlas. Nat Biotechnol. 2010;28:1248–1250.
- Uhlen M, Bjorling E, Agaton C, et al. A human protein atlas for normal and cancer tissues based on antibody proteomics. Mol Cell Proteomics. 2005;4:1920–1932.
- Oliveira NC, Gomig TH, Milioli HH, et al. Comparative proteomic analysis of ductal and lobular invasive breast carcinoma. Genet Mol Res. 2016;15(2): gmr.15027701.
- Li Y, Rong G, Kang H. Taxotere-induced elevated expression of IL8 in carcinoma-associated fibroblasts of breast invasive ductal cancer. Oncol Lett. 2017;13:1856–1860.
- Liu YL, Zhang HM, Pan HM, et al. The relationship between apolipoprotein E gene epsilon2/epsilon3/epsilon4 polymorphism and breast cancer risk: a systematic review and meta-analysis. Onco Targets Ther. 2016;9:1241–1249.
- Stevens KN, Wang X, Fredericksen Z, et al. Evaluation of associations between common variation in mitotic regulatory pathways and risk of overall and high grade breast cancer. Breast Cancer Res Treat. 2011;129:617–622.
- Lucci MA, Orlandi R, Triulzi T, et al. Expression profile of tyrosine phosphatases in HER2 breast cancer cells and tumors. Cell Oncol. 2010;32:361–372.
- Russo J, Russo IH. Molecular basis of pregnancy-induced breast cancer prevention. Horm Mol Biol Clin Investig. 2012;9:3–10.
- Chu X, Guo X, Jiang Y, et al. Genotranscriptomic meta-analysis of the CHD family chromatin remodelers in human cancers - initial evidence of an oncogenic role for CHD7. Mol Oncol. 2017;11:1348–1360.
- Faraji F, Hu Y, Wu G, et al. An integrated systems genetics screen reveals the transcriptional structure of inherited predisposition to metastatic disease. Genome Res. 2014;24:227–240.
- Gonzalez-Conchas GA, Rodriguez-Romo L, Hernandez-Barajas D, et al. Epidermal growth factor receptor overexpression and outcomes in early breast cancer: a systematic review and a meta-analysis. Cancer Treat Rev. 2017;62:1–8.
- Qian W, Tao L, Wang Y, et al. Downregulation of integrins in cancer cells and anti-platelet properties are involved in holothurian glycosaminoglycan-mediated disruption of the interaction of cancer cells and platelets in hematogenous metastasis. J Vasc Res. 2015;52:197–209.
- Chi Y, Huang S, Wang L, et al. CDK11p58 inhibits ERalpha-positive breast cancer invasion by targeting integrin beta3 via the repression of ERalpha signaling. BMC Cancer. 2014;14:577.
- Gong Y, He T, Yang L, et al. The role of miR-100 in regulating apoptosis of breast cancer cells. Sci Rep. 2015;5:11650.
- Marcotte R, Sayad A, Brown KR, et al. Functional genomic landscape of human breast cancer drivers, vulnerabilities, and resistance. Cell. 2016;164:293–309.
- Abdelkarim M, Vintonenko N, Starzec A, et al. Invading basement membrane matrix is sufficient for MDA-MB-231 breast cancer cells to develop a stable in vivo metastatic phenotype. PLoS One. 2011;6:e23334.
- Cine N, Baykal AT, Sunnetci D, et al. Identification of ApoA1, HPX and POTEE genes by omic analysis in breast cancer. Oncol Rep. 2014;32:1078–1086.
- Qian L, Gao X, Huang H, et al. PRSS3 is a prognostic marker in invasive ductal carcinoma of the breast. Oncotarget. 2017;8:21444–21453.
- Ma R, Ye X, Cheng H, et al. PRSS3 expression is associated with tumor progression and poor prognosis in epithelial ovarian cancer. Gynecol Oncol. 2015;137:546–552.
- Hockla A, Radisky DC, Radisky ES. Mesotrypsin promotes malignant growth of breast cancer cells through shedding of CD109. Breast Cancer Res Treat. 2010;124:27–38.
- Yang L, Shi T, Liu F, et al. REV3L, a promising target in regulating the chemosensitivity of cervical cancer cells. PLoS One. 2015;10:e0120334.
- Varadi V, Bevier M, Grzybowska E, et al. Genetic variation in genes encoding for polymerase zeta subunits associates with breast cancer risk, tumour characteristics and survival. Breast Cancer Res Treat. 2011;129:235–245.
- Roger S, Gillet L, Le Guennec JY, et al. Voltage-gated sodium channels and cancer: is excitability their primary role? Front Pharmacol. 2015;6:152.
- Gau DM, Lesnock JL, Hood BL, et al. BRCA1 deficiency in ovarian cancer is associated with alteration in expression of several key regulators of cell motility - A proteomics study. Cell Cycle. 2015;14:1884–1892.
- Gur-Dedeoglu B, Konu O, Kir S, et al. A resampling-based meta-analysis for detection of differential gene expression in breast cancer. BMC Cancer. 2008;8:396.
- Song J, Yang W, Shih IM, et al. Identification of BCOX1, a novel gene overexpressed in breast cancer. Biochim Biophys Acta. 2006;1760:62–69.
- Schuetz CS, Bonin M, Clare SE, et al. Progression-specific genes identified by expression profiling of matched ductal carcinomas in situ and invasive breast tumors, combining laser capture microdissection and oligonucleotide microarray analysis. Cancer Res. 2006;66:5278–5286.
- Lee S, Stewart S, Nagtegaal I, et al. Differentially expressed genes regulating the progression of ductal carcinoma in situ to invasive breast cancer. Cancer Res. 2012;72:4574–4586.
- Michael M, Begum R, Fong K, et al. BPAG1-e restricts keratinocyte migration through control of adhesion stability. J Invest Dermatol. 2014;134:773–782.
- Kuchnio A, Dewerchin M, Carmeliet P. The PHD2 oxygen sensor paves the way to metastasis. Oncotarget. 2015;6:35149–35150.
- Bordoli MR, Stiehl DP, Borsig L, et al. Prolyl-4-hydroxylase PHD2- and hypoxia-inducible factor 2-dependent regulation of amphiregulin contributes to breast tumorigenesis. Oncogene. 2011;30:548–560.
- Singh M, Devi U, Roy S, et al. Prolyl hydroxylase mediated inhibition of fatty acid synthase to combat tumor growth in mammary gland carcinoma. Breast Cancer. 2016;23:820–829.
- Paolicchi E, Crea F, Farrar WL, et al. Histone lysine demethylases in breast cancer. Crit Rev Oncol Hematol. 2013;86:97–103.
- Hou J, Wu J, Dombkowski A, et al. Genomic amplification and a role in drug-resistance for the KDM5A histone demethylase in breast cancer. Am J Transl Res. 2012;4:247–256.
- Gale M, Sayegh J, Cao J, et al. Screen-identified selective inhibitor of lysine demethylase 5A blocks cancer cell growth and drug resistance. Oncotarget. 2016;7:39931–39944.
- Newbold RF, Mokbel K. Evidence for a tumour suppressor function of SETD2 in human breast cancer: a new hypothesis. Anticancer Res. 2010;30:3309–3311.
- Al Sarakbi W, Sasi W, Jiang WG, et al. The mRNA expression of SETD2 in human breast cancer: correlation with clinico-pathological parameters. BMC Cancer. 2009;9:290.
- Shen H, Li L, Zhou S, et al. The role of ADAM17 in tumorigenesis and progression of breast cancer. Tumour Biol. 2016;37(12):15359–15370.
- Narita D, Seclaman E, Ilina R, et al. ADAM12 and ADAM17 gene expression in laser-capture microdissected and non-microdissected breast tumors. Pathol Oncol Res. 2011;17:375–385.
- Zheng X, Jiang F, Katakowski M, et al. ADAM17 promotes breast cancer cell malignant phenotype through EGFR-PI3K-AKT activation. Cancer Biol Ther. 2009;8:1045–1054.
- Wang CY, Lai MD, Phan NN, et al. Meta-analysis of public microarray datasets reveals voltage-gated calcium gene signatures in clinical cancer patients. PLoS One. 2015;10:e0125766.
- Yamaga R, Ikeda K, Horie-Inoue K, et al. RNA sequencing of MCF-7 breast cancer cells identifies novel estrogen-responsive genes with functional estrogen receptor-binding sites in the vicinity of their transcription start sites. Horm Cancer. 2013;4:222–232.
- Bjorklund SS, Panda A, Kumar S, et al. Widespread alternative exon usage in clinically distinct subtypes of Invasive Ductal Carcinoma. Sci Rep. 2017;7:5568.
- Wang H, Wang B, Zhu W, et al. Lentivirus-mediated knockdown of myosin VI inhibits cell proliferation of breast cancer cell. Cancer Biother Radiopharm. 2015;30:330–335.
- De Marchi T, Timmermans AM, Smid M, et al. Annexin-A1 and caldesmon are associated with resistance to tamoxifen in estrogen receptor positive recurrent breast cancer. Oncotarget. 2016;7:3098–3110.
- Zou JX, Duan Z, Wang J, et al. Kinesin family deregulation coordinated by bromodomain protein ANCCA and histone methyltransferase MLL for breast cancer cell growth, survival, and tamoxifen resistance. Mol Cancer Res. 2014;12:539–549.
- Yuasa-Kawada J, Kinoshita-Kawada M, Rao Y, et al. Deubiquitinating enzyme USP33/VDU1 is required for Slit signaling in inhibiting breast cancer cell migration. Proc Natl Acad Sci U S A. 2009;106:14530–14535.
- Chen NP, Uddin B, Voit R, et al. Human phosphatase CDC14A is recruited to the cell leading edge to regulate cell migration and adhesion. Proc Natl Acad Sci U S A. 2016;113:990–995.
- Sohn EJ, Jung DB, Lee H, et al. CNOT2 promotes proliferation and angiogenesis via VEGF signaling in MDA-MB-231 breast cancer cells. Cancer Lett. 2017;412:88–98.
- Li W, Liu C, Zhao C, et al. Downregulation of beta3 integrin by miR-30a-5p modulates cell adhesion and invasion by interrupting Erk/Ets1 network in triple-negative breast cancer. Int J Oncol. 2016;48:1155–1164.
- Carter RZ, Micocci KC, Natoli A, et al. Tumour but not stromal expression of beta3 integrin is essential, and is required early, for spontaneous dissemination of bone-metastatic breast cancer. J Pathol. 2015;235:760–772.
- Liu T, Zhang XY, He XH, et al. High levels of BCOX1 expression are associated with poor prognosis in patients with invasive ductal carcinomas of the breast. PLoS One. 2014;9:e86952.