
ABSTRACT
Among extracellular vesicles, leukocyte-derived microvesicles (LMVs) have emerged as complex vesicular structures. Primarily identified as procoagulant entities, they were more recently ascribed to plasmin generation capacity (MV-PGC). The objectives of this work were (1) to develop a new hybrid bio-assay combining the specific isolation of LMVs and measurement of their PGC, and compare its performance to the original method based on centrifugation, (2) to validate MV-PGC in septic shock, combining increased levels of LMVs and fibrinolytic imbalance. Using plasma sample spiked with LMVs featuring different levels of PGC, we demonstrated that CD15-beads specifically extracted LMVs. The MV dependency of the test was demonstrated using electron microscopy, high speed centrifugation, nanofiltration and detergent-mediated solubilization and the MV-PGC specificity using plasmin-specific inhibitors, or antibodies blocking elastase or uPA. Thanks to a reaction booster (ε-ACA), we showed that the assay was more sensitive and reproducible than the original method. Moreover, it exhibited a good repeatability, inter-operator and inter-experiment reproducibility. The new immunomagnetic bio-assay was further validated in patients with septic shock. As a result, we showed that MV-PGC values were significantly lower in septic shock patients who died compared to patients who survived, both at inclusion and 24 h later (1.4 [0.8–3.0] vs 3.1 [1.7–18] A405 × 10−3/min, p = 0.02; 1.4 [1–1.6] vs 5.2 [2.2–16] A405 × 10−3/min, p = 0.004). Interestingly, combining both MV-PGC and PAI-1 in a ratio significantly improved the predictive value of PAI-1. This strategy, a hybrid capture bioassay to specifically measure LMV-PGC using for the first time, opens new perspectives for measuring subcellular fibrinolytic potential in clinical settings with fibrinolytic imbalance.
Background
Microvesicles (MVs) or microparticles constitute a heterogeneous population of extracellular vesicles that are released in response to cell activation or apoptosis. Originating from cell membranes by cell budding, they harbour a large variety of cell surface receptors and activities that are generally representative of their parent cells [Citation1–Citation3]. Although 70–90% of circulating MVs in the peripheral blood of healthy individuals are derived from platelets (PMVs) and erythrocytes (Ery-MVs), a growing interest has emerged regarding less represented subsets of MVs, such as leukocyte-derived MVs (LMVs), because of their recognition as biological effectors in the tuning of vascular homeostasis [Citation4–Citation6].
Increased circulating LMV levels have been reported in the bloodstream of patients with sepsis [Citation7–Citation9] or with high atherothrombotic risk, such as diabetic [Citation10,Citation11] or hypertensive patients [Citation12]. Plasmatic levels of LMVs have been associated with unstable plaques in asymptomatic patients with high-grade carotid stenosis [Citation13] or with progression of diabetic retinopathy [Citation14]. LMVs are ambivalent bioactive structures affecting both proinflammatory [Citation15,Citation16] and anti-inflammatory processes [Citation17]. LMVs have been primarily ascribed procoagulant properties because of the tissue factor (TF) exposure [Citation18,Citation19] together with procoagulant phospholipids such as phosphatidylserine (PS). However, anticoagulant proteins are also present on the surface of LMVs, including thrombomodulin [Citation20], endothelial protein C receptor [Citation21] and TF pathway inhibitor (TFPI) [Citation22]. Moreover, LMVs have been more recently described to have plasmin generation capacity (MV-PGC) [Citation6,Citation23].
MV-dependent plasmin generation capacity (MV-PGC) involves the binding of plasminogen and its activator urokinase (uPA), at the MV surface via its membrane receptor uPAR/CD87 [Citation24]. MV-PGC is measurable in plasma from healthy donors and is modulated in pathological conditions in which increased levels of LMVs have been reported, such as atherosclerosis [Citation25]. However, the clinical relevance of this new activity has not been evaluated to date due to a lack of reliable methods to measure MV-PGC in patient plasma. To overcome this limitation, the objective of the present study was to design a new assay that combines the specific isolation of LMVs among other circulating MV subsets and the measurement of their capacity to generate plasmin (MV-PGC). Using normal blood spiked with LMVs, we determined the analytic performance of the new immunomagnetic bio-assay, which was further validated in patients with septic shock, a clinical situation that combines increased levels of LMVs and fibrinolytic imbalance [Citation26,Citation27].
Materials and methods
IMS-MV-PGC assay design
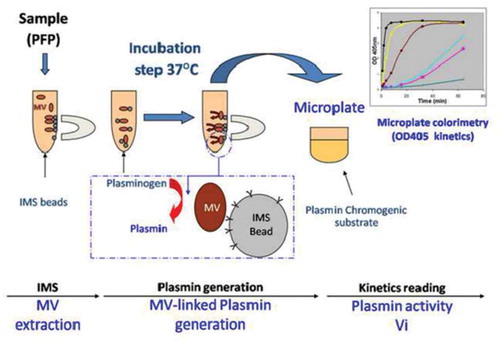
A new assay to measure MV-PGC in human plasma samples was developed based on (1) immunomagnetic separation assay (IMS) combining a specific isolation and a conveniently wash of microvesicles (MVs) and (2) a chromogenic assay to quantify the MV dependent plasmin generation capacity. Briefly, 400 μL of PFP were diluted (1:2) in PBS, 0.1% bovine serum albumin and 0.1% NaN3 buffer (PBS/BA); this suspension was then incubated for 1 h at RT under mild rotative with a previously optimal amount of CD15 magnetic beads (20 µL at 4 × 10⁸ µS/mL M450 Dynabeads, InVitrogen/Dynal, Oslo, Norway) (Figure 1(a)). The beads were separated from the supernatants using a magnet (Dynamag, InVitrogen Dynal, Oslo, Norway). The MV-loaded beads were then washed with PBS/BA and incubated for 24 h at 37°C in the presence of plasminogen (4 μM, Stago, Asnières, France) and ε-aminocaproic acid (ε-ACA, 5 mM, Sigma-Aldrich, St. Louis, MO, US), which was used as an enhancer of the Glu- to Lys-plasminogen transformation (Figure 1(b)). After this incubation, the amount of generated plasmin was quantified as described above by adding a plasmin-selective chromogenic substrate ([methyl-malonyl]-hydroxypropylarginine-p-nitroaniline, CBS0065, Stago, 2 mM). The chromogenic substrate was cleaved by the plasmin which had formed from the MV-bound plasminogen. Plasmin activity was measured as the time-dependent release of p-nitroaniline detected by absorbance at 405 nm (A405nm). The kinetic was followed for 2 h at 37°C, and Vmax was measured in the linear part of each curve (Figure 1(c)). The results were expressed in units of A405nm × 10−3/min.
Figure 1. Schematic sketch of the immunomagnetic separation-based microvesicle-dependent plasmin generation assay.
A. Microvesicles (MVs) were extracted from platelet-free plasma (PFP) using magnetic beads coated with specific antibodies. B. Plasminogen was added, and its cleavage to plasmin was activated by urokinase present on the MV surface during incubation at 37°C. C. The generated plasmin was quantified by colorimetry using a specific chromogenic substrate (CBS0065, Stago), and the optical density (OD) at 405 nm was measured. IMS = immunomagnetic separation.
Sample processing
Blood samples for MV-PGC measurement of septic shock (SS) patients and age-and sex-matched healthy controls were collected and processed according to the current International Society on Thrombosis and Haemostasis guidelines [Citation28,Citation29]. Briefly, after a light tourniquet was applied, samples were drawn from the antecubital vein using a butterfly device with a 21-gauge needle. Blood was collected into 5 mL Vacutainer tubes containing 0.129 mol/L sodium citrate (BD Diagnostics, Franklin Lakes, NJ, US), and the first few millilitres were discarded. The samples were subjected to two successive centrifugations (2500 × g for 15 min at room temperature (RT)) to prepare platelet-free plasma (PFP). The PFP was homogenized before being aliquoted and stored at −80°C until use.
MV sample preparation
To produce control samples, LMVs were generated from human circulating monocytes or polymorphonuclear (PMN) cells of normal blood and then spiked in a normal microvesicle-free plasma (MVFP) (culture supernatants centrifuged three times at 70,000 × g, 90 min, RT; Beckman Coulter Avanti J-30 I, JA-30.50). Briefly, peripheral blood mononuclear cells were isolated by a density gradient separation method with Ficoll-paqueTM (lymphocyte separation medium; p = 1.077 g/mL; Sigma-Aldrich). Monocytes were labelled with anti-CD14-allophycocyanin antibody (clone HCD14, Biolegend, San Diego, CA) and PMN with anti-CD66b-allophycocyanin antibody (clone 80H3, Beckman Coulter, Marseille, France). After incubation with microbeads conjugated to monoclonal antibody antiallophycocyanin, monocytes or PMN were isolated by immunomagnetic separation on an LS column (Miltenyi Biotec, Bergisch Gladbach, Germany). The purity was greater than 95%. PMNs were stimulated with N-formylmethionylleucyl-phenylalanine (1 mM) and monocytes with lipopolysaccharides (1 µg/mL) (Sigma-Aldrich). MVs were isolated from the supernatant as described above. In selected experiments, PMVs were generated from human platelets and activated by ionophore A23187 (1 mM; Sigma-Aldrich) as previously described [Citation30].
In experiments comparing the efficiency of the MV-PGC assay conducted via IMS with that of the assay conducted via high-speed centrifugation, MVs were purified from the same PFP sample by IMS-CD15 or centrifugation at 24,000 × g for 90 min which is the reference speed used in the original method [Citation24,Citation25]. Pelleted MVs were washed twice (24,000 × g for 90 min at RT) and resuspended in phosphate-buffered saline (PBS). To assess the yield of high-speed centrifugation, three centrifuges with different rotors were compared (F15-6x100y, Thermo Fisher Scientific, Waltham, MA, USA; FA45-24–11, Eppendorf, Hamburg, Germany; JA-30.50, Beckman Coulter, Brea, CA, USA).
Immunomagnetic separation specificity
For the assay design and control experiments, all tested IgG-mAbs were indirectly coated on goat anti-mouse IgG beads (GAM-M450) according to the manufacturer’s instructions. These mAbs included CD235a (KC16, Beckman Coulter), CD41 (clone PL2-49), CD45 (clone FL3A11), CD11b (clone Bear-1) or CD146 (S-Endo 1), IgG (clone 2H11/2H12), and all were from BioCytex (Marseille, France) and as well as CD15 (clone W6D3, Becton Dickson, Franklin lakes, NJ, USA). CD15-IgM-mAbs were directly coated onto M450 Dynabeads by the vendor. Quality control of the beads included checking (i) the presence of mAbs on the beads with an anti-mouse IgG (H + L) fluorescein (FITC) conjugate by flow cytometry (FCM) and (ii) the efficient capture of cells bearing the targeted antigen (bead:cell ratio of 20:1). Negative control tests (IgG-IMS) were performed in parallel using beads coated with a non-specific antibody (anti-DNP IgG1, BioCytex). The beads bearing captured MVs were separated from the supernatants using a magnet (DynaMag, InVitrogen/Dynal) and washed once with PBS-BA prior to being assayed for plasmin generation.
To determine whether the plasmin generation originated from MVs bound to the beads and not from soluble molecules such as uPA or uPA-uPAR complexes adsorbed onto beads, PFP was depleted from MVs by either a 10 min treatment with 0.5% Triton (Triton X-100, Sigma-Aldrich, St Louis, MO, US), filtration (0.1 µm ×2) or high-speed centrifugation (70,000 × g for 90 min ×3; Beckman Coulter Avanti J-30 I, JA-30.50).
Chromogenic test measuring plasmin generation capacity specificity
To check the plasmin specificity, the chromogenic substrate was tested in the presence of different enzymes: urokinase (uPA) (25 × 10−2 UI/mL) (Hyphen Biomed, Neuville-sur-Oise, France), tissue plasminogen activator (t-PA) (25 × 10−2 UI/mL, Actilyse*, Boerhinger, Ingelheim, Germany), elastase (42 × 10−2 UI/mL, Sigma-Aldrich), thrombin (0.5-32 × 10−2 UI/mL, Stago) and plasmin (0.5–32 × 10−2 UI/mL, Hyphen Biomed) were used to control for selectivity.
To verify the specificity of the MV-PGC assay toward plasmin and its activator urokinase, CD15-MVs were incubated with plasminogen in the presence or absence of inhibitors of plasmin (alpha2-antiplasmin, 275 nM, Abcam, Cambridge, MA, US), thrombin (hirudin, 10 U/mL, Cryopep, Montpellier, France), uPA (mouse anti-human uPA monoclonal antibody, 25 μg/mL, American Diagnostica, Greenwich, UK), neutrophil elastase (anti-neutrophil elastase antibody, 10 µg/mL, Invitrogen, Carlsbad, CA, USA) or an irrelevant control.
To evaluate the impact of soluble PAI-1 on the assay, MV-PGC was measured in three samples featuring three levels of plasmin-generation capacity (high level: HL; medium level: ML; low level: LL) in the presence of a range of PAI-1 concentrations (0.5–500 ng/mL) (R&D systems, Minneapolis, USA).
MVs enumeration by flow cytometry
The antibodies included CD15-PB (Pacific Blue), CD15-PE (Phycoerythrin) (clone 80H5), CD11b-PE (clone Bear-1), CD66b-allophycocyanin (clone 80H3) and their respective controls: IgG1 (clone 679.1Mc7), IgM (clone 11E10, Beckman Coulter), CD41-PE (clone PL2-49) and its IgG1-PE control conjugate, and anti-DNP-PE (clone 2H11, BioCytex). These reagents were used at their optimal final concentrations (0.8–3 μg/mL). All the isotype controls were matched with their relevant antibody conjugates in terms of fluorescence background. AnnV-FITC was purchased from Tau Technology (Kattendijke, NL).
MVs were enumerated by highly sensitive FCM (Navios, Beckman-Coulter, Miami, FL, US) as previously described [Citation31]. PMVs, PMN-MVs and Mono-MVs were defined, respectively, as AnnV+/CD41+, AnnV+/CD66b+ and AnnV+/CD11b+ events localized in the standardized scatter-based MV gate.
Scanning electron microscopy and transmission electron microscopy
For transmission electron microscopy, magnetic beads were fixed in a solution of 2.5% glutaraldehyde in 0.1 M sodium cacodylate buffer, pH 7.4. After centrifugation, the pellet was washed three times, and the specimen was postfixed in osmium tetroxide 2% in the same buffer. The pellet was dehydrated in graded alcohol solutions and embedded in an EMBed-812 embedding Kit (E.M.S., Hatfield, PA, US). Ultrathin sections (50–60 nm) were obtained under an ultramicrotome (Ultracut E, Reichert-Jung), mounted on copper grids and counterstained with 5% uranyl acetate and lead citrate before observation with a JEM-1400 electron microscope (JEOL, Akishima, Japan) at an accelerating voltage of 80 kV. The images were captured with a CCD camera (Megaview III, SYS OlyMVus) and iTEM five software.
For scanning electron microscopy, each sample was fixed (PFA 4%) and deposited on scanning electron microscope studs (QUANTA D200, FEI, Eindhoven, NL). After drying at RT for 30 min, each specimen was coated with a thin layer of gold under a vacuum (2 nm) (FINE COAT JFC-1100, JEOL).
Clinical validation: patients and controls
Thirty-four consecutive adult patients (mean age: 62 years; range: 19–93 years) with a diagnosis of SS according to the guidelines of the International Sepsis Definition Conference [Citation28] were prospectively enrolled after admission in an intensive care unit. Written informed consent was obtained from the patients or their relatives, and the study was approved by a local medical ethics committee (CPP Sud Méditerranée N° 13–67) according to the Declaration of Helsinki. Patient outcome at day 30 was recorded. The main characteristics of the patients are summarized (supplemental ). For the initial design and validation of the assay, as well as for use as a control group in comparison to the patients, blood was also collected from healthy donors who signed an informed consent form. To measure MV-PGC in patients, IMS-CD15 was performed directly on PFP thawed in a water bath.
Table 1. Reproducibility and repeatability of the immunomagnetic separation-based microvesicle-dependent plasmin generation capacity assay. The experiments were performed using two levels of plasmin (high level HL and low level LL).
PAI-1 activity test
The STACHROM® PAI manual assay (Stago) was adapted into a microplate format to measure PAI-1 activity in a small volume of PFP samples. Briefly, 10 µL of an undiluted plasma sample were pre-incubated at 37°C for 5 min. Thereafter, uPA was added (0.5 nkat) and incubated at 37°C for 4 min. Then, plasminogen was added (4 µM, containing alpha2-antiplasmin and alpha2-macroglobulin inhibitors) and incubated at 37°C for 4 min. This process was followed by incubation (37°C, 1 min) with a plasmin selective chromogenic substrate (CBS 0065, 2 mM). The absorbance was measured at 405 nm. PAI-1 activity was inversely proportional to the amount of generated plasmin. The results are expressed as arbitrary units (a.u.)/mL.
Statistical analysis
All statistical analyses were performed with GraphPad Prism software version 5.0 (GraphPad Software, San Diego, CA, US). Significant differences were determined using a nonparametric Mann–Whitney test or a paired t-test. A p-value less than 0.05 was considered statistically significant. Spearman’s rank correlations were used as a measure of the correlations between MV-PGC and PAI-1.
Results
As illustrated in , a functional test combining specific isolation of LMVs using IMS and measurement of the associated plasmin generation capacity (PGC) was designed to reproducibly measure MV-dependent fibrinolytic activity of LMVs. Briefly, MVs were extracted from platelet-free plasma (PFP) using magnetic beads coated with specific antibodies as described in detail in the materials and methods section (page 4).
Immuno-capture specificity
To determine the best antibody specificity able to capture LMVs with high plasmin generation activity, we performed extraction experiments on human PFP using magnetic beads coated with antibodies against leukocyte surface antigens including CD45, CD11b and CD15, and measured plasmin generation activity (Figure 2(a)). Among the tested capture antibodies, anti-CD15 produced the highest level of activity (taken as 100%) compared with CD11b (40 ± 20%) and CD45 (5.6 ± 3%). Interestingly, after a first CD15-IMS, a second IMS driven by either CD11b or CD45 beads on the same PFP failed to generate plasmin, indicating that the CD15 beads had already extracted most of the plasminogenolytic MVs. This result was confirmed by a reverse experiment in which a second IMS with CD15 beads following CD11b- or CD45-IMS generated a significant level of residual plasmin activity. We also compared the efficiency of IMS using two different CD15 beads (primary or secondary bound). As illustrated in Figure 2(b), no difference was observed for IMS-MV-PGC, demonstrating the lack of a significant impact of the anti-CD15 antibody coating process. In contrast, when IMS was performed with beads binding platelet- (CD41), erythrocyte- (CD235a) or endothelium-derived (CD146) MVs, no detectable PGC was measured. Thus, CD15 specificity was selected to perform the immuno-capture of plasminogenolytic MVs in human plasma samples. Interestingly, CD15 was only detectable by FCM on MVs generated from granulocytes and not monocytes (Figure 2(c)), suggesting that LMVs captured by a CD15-IMS were of granulocytic origin.
Figure 2. Immuno-capture specificity.
A comparison of the efficiency of magnetic beads coated with various antibodies for isolating MVs with plasmin-generation capacity. MV-PGC was measured after IMS either on the spiked PFP or the plasma remaining after the first round of IMS. The IMS-CD15 was used as a reference (100%). Ctl = control. IMS was performed using magnetic beads coated with an irrelevant (anti-DNP) antibody. B. Impact of the coating of CD15-beads on MV-PGC. MV-PGC using primary or secondary bound CD15-beads was compared. Beads coated with an irrelevant antibody were used as control (n = 4). NS: no significant. C. Flow cytometry analysis of CD15 expression on purified PMN-MVs (CD66b+/AnnV+ events) or Mono-MVs (CD11b+/AnnV+ events) spiked in MVFP. D. Residual Leu-MVs (AnnV+/CD15+) and PMVs (AnnV+/CD41+) were detected by flow cytometry after sequential IMS on human PFP enriched with purified PMN-MVs (with the Leu-MV:PMV ratio being close to 1, i.e., 50%:50%): 1. IMS-IgG; 2. IMS-CD15; and 3. IMS-CD41.
CD15-IMS specificity was monitored by FCM using plasma samples containing large amounts of spiked LMVs (AnnV+/CD15+) and PMVs (AnnV+/CD41+), as illustrated in Figure 2(d). No major decrease in LMVs or PMVs was observed after sham-IMS (<20% depletion). LMVs were selectively removed after CD15-IMS (efficiency >90%), and the remaining PMVs were selectively removed when CD41-IMS was performed using the supernatant from CD15-IMS (efficiency >90%). The specificity of the IMS depletion was also confirmed by the reverse experiment, in which CD41 IMS was first applied followed by CD15 IMS (data not shown).
Microvesicle-PGC specificity
To demonstrate that the MV-PGC assay was indeed MV-derived, we first visualized MVs on the magnetic beads incubated with purified PMN-MVs. As illustrated in the scanning electron microscopy images ()), only CD15-beads were covered by small vesicular structures in the presence of PMN-MVs, in contrast to the control beads. A similar result was obtained by transmission electron microscopy ()). These results were also confirmed by FCM (Figure 3(c)), demonstrating the presence of CD66b+ PMN-MV bound to the surface of CD15-beads only.
Figure 3. Microvesicle-dependent plasmin specificity.
A–B. Purified PMN-MVs spiked in MVFP were characterized after an immunomagnetic separation using magnetic beads coated with CD15 (CD15-IMS) or an irrelevant antibody (IgG-IMS) using scanning electron microscopy (A) and transmission electron microscopy (B) Ctl: Control condition was represented by bead-CD15 with buffer HEPES/BA. C. The presence of PMN-MVs on the surface of different beads was confirmed by flow cytometry using CD66b+ labelling. Scale bar: 2 µm. D. Platelet-free plasma (PFP) was depleted from MVs by either 0.5% Triton treatment or 0.1 µm filtration or high speed centrifugation (HSC). MV depletion efficiency was checked by flow cytometry measuring the annexin V + (AnnV+ MVs) events. E. The plasmin generation capacity (MV-PGC) using the immunomagnetic separation method was compared before and after MV depletion. n = 3. F. Different fibrinolytic enzymes were tested with the chromogenic substrate: uPA (25 × 10−2 UI/mL), t-PA (25 × 10−2 UI/mL), elastase (elast; 42 × 10−2 UI/mL), thrombin (0.5–32 × 10−2 UI/mL) and plasmin (0.5–35 × 10−2 UI/mL), Ctl: negative control was represented by PBS/BA buffer. G. The respective contribution of plasminogen activation and urokinase activity in the plasmin-dependent chromogenic test was evaluated using control samples (PFP enriched with LMVs). MVs captured by the CD15-beads were incubated in the presence or absence of different inhibitors of plasmin (alpha2-antiplasmin (α2AP), 275 nM), thrombin (hirudin, 10 U/mL), uPA (anti-uPA antibody, 25 µg/mL) or neutrophil elastase (anti-neutrophil elastase antibody, 10µg/mL) or an isotype control; Ctl = MPFP; n = 3. *** p ≤ 0.001, NS = p > 0.5.
Figure 3. (Continued).
To determine whether the plasmin generation originated from MVs bound to the beads and not from soluble molecules such as uPA or uPA-uPAR complexes adsorbed onto beads, MVs were removed from PFP samples spiked with LMVs before CD15-IMS using three independent approaches: high-speed centrifugation, nanofiltration (0.1 µm) and detergent-mediated solubilization of lipid membranes [Citation32]. The efficacy of MV depletion was controlled by FCM (Figure 3(d)). In all three tested approaches, MV-PGC was completely abolished (Figure 3(e)). Altogether, these results confirmed that MV-PGC is indeed MV-derived.
To demonstrate the plasmin selectivity of the colorimetric substrate, the chromogenic test was performed with various enzymes implicated in the fibrinolytic system: uPA, tissue plasminogen activator (t-PA), elastase and thrombin were compared to plasmin. As shown in Figure 3(f), the colorimetric signal obtained in the presence of plasmin was clearly plasmin concentration-dependent (r2 = 0.99). No signal was measured in the presence of uPA, t-PA or elastase; whereas, a very low, albeit dose-dependent, rate of substrate cleavage did exist in the presence of thrombin. As illustrated in Figure 3(g), this cleavage was negligible for PFP because MV-PGC was not significantly affected when the chromogenic step of the assay after MV extraction by IMS was achieved in the presence of hirudin. In contrast, when the assay was performed in the presence of alpha2-antiplasmin, the MV-PGC was completely blocked. The MV-PGC was also inhibited when blocking plasmin generation by an anti-uPA inhibitor antibody. Moreover, because neutrophil elastase can act as an alternative enzyme for fibrinolysis [Citation33], MV-PGC was measured in the presence or absence of an anti-neutrophil elastase antibody. No difference was observed between the two conditions, demonstrating the absence of impact of neutrophil elastase on the MV-PGC assay (Figure 3(g)).
Microvesicle-PGC sensitivity
Because LMVs were the focus of the present study, we took advantage of plasminogen being exclusively activated into plasmin by the uPA/uPAR system in this subset of MVs [Citation25] to increase the sensitivity of the method using ε-ACA as a reaction booster. Indeed, ε-ACA is known to interact with “lysine-binding sites” (LBS) of plasminogen. On the one hand, it induces a switch from Glu- (closed) to Lys- (open) plasminogen conformations that accelerate plasminogen cleavage into plasmin by uPA. On the other hand, it inhibits the binding of plasminogen to the MV surface [Citation34]. The optimal concentration of ε-ACA able to amplify plasmin-generation activity was 5 mM, as determined using purified PMN-MVs (Figure 4(a)). Figure 4(b) illustrates how ε-ACA (5 mM) enhanced MV-PGC according to the LMV concentration in the sample. This concentration was subsequently used to evaluate the assay sensitivity.
Figure 4. Sensitivity of the IMS-based MV-PGC assay.
A. A range of ε-ACA concentrations (0.25–500 mM) was evaluated in the plasmin chromogenic test in the presence of PMN-MVS (80 × 103 and 24 × 103). Ctl: negative control was represented by phosphate buffered saline (PBS), 0.1% bovine serum albumin and 0.1% NaN3 buffer (PBS/BA). B. Representative dose–response kinetics of plasmin generation generated by a range of normal plasma containing PMN-MVs (650.103/µL) with or without ε-ACA; n = 3. C. Comparison of MV-PGC of the same PFP centrifuged at 24,000 × g, 90 min, at room temperature on three different centrifuges with different rotors (F15-6 × 100y; FA45-24-11; JA-30.50). n = 6. D. Comparison of two methods for isolating MV with plasmin generation capacity, CD15-IMS versus centrifugation to measure MV-PGC on two plasmas with different levels of plasmin (HL: high level; LL: low level). n = 6
The efficiency of IMS to isolate MVs was then compared to high-speed centrifugation. As illustrated in Figure 4(c), using the same PFP, we showed that MV-PGC after high-speed centrifugation was very heterogeneous and not reproducible between different centrifuges (1: 71 ± 8 A405nm × 10−3/min vs 2: 18 ± 3 A405nm × 10−3/min vs 3: 117 ± 8 A405nm × 10−3/min). Moreover, regardless of the level of plasmin generation in the plasma sample, MV-PGC was significantly superior when isolating MVs with IMS compared to high-speed centrifugation (Figure 4(d), respectively, HL: 140 ± 40 A405nm × 10−3/min vs 68 ± 45 A405nm × 10−3/min; p < 0.05; LL: 32 ± 5 vs 10 ± 7 A405nm × 10−3/min; p < 0.001; n = 6).
Repeatability and reproducibility of the MV-PGC assay
Currently, the purification of MVs by the IMS method remains a manual technique. However, as shown in , the IMS-based MV-PGC has a good repeatability (3–4%). We also assessed the inter-operator reproducibility through the use of three independent operators performing the MV-PGC assay in triplicate on the same PFP sample with different levels of activity (low LL, n = 4 and high HL, n = 4). Variation below 10% was obtained for each MV-PGC level (HL, CV = 9.3%, Figure 5(a), and LL CV = 9.8%, ).
Figure 5. Validation of the MV-PGC assay in septic shock patients. A. Microvesicle-dependent plasmin generation capacities (MV-PGCs) at inclusion (H0) and at H24 of the surviving (S) and non-surviving (NS) septic shock patients compared to MV-PGC of MVs isolated from healthy donors (n = 24). The boxes and whiskers represent the medians and 25—75th percentiles of each population. B. Plasmin activator inhibitor type 1 (PAI-1) levels of the S and NS septic shock patients at inclusion (H0) and at H24. C. Impact of a range of PAI-1 concentrations (0.5–500 ng/mL) on MV-PGC of three samples of MVs with different levels of plasmin generation activity (high level: HL; medium level: ML; LL: low level). n = 3. D. Ratio of IMS-MV-PGC to PAI-1 concentration in SV and NSV (at H0 and H24). p ≤ 0.05 was considered significant. * p ≤ 0.05; ** p ≤ 0.01; *** p ≤ 0.001.
The inter-experiment reproducibility was also evaluated by regular testing of different aliquots of the same PFP (n = 8) over an 8-month period. As shown in , the mean variability was 16.1% ± 4.3% (11.8%, 13.8% and 17.3% for samples C, D and E, respectively) and reached 18.8% ± 2.3% for the samples with the highest level of activity (20% and 16.8% for samples A and B, respectively). Altogether, the new hybrid assay displays a good repeatability, inter-operator and inter-experiment reproducibility, at low and high plasmin levels.
Validation of the MV-PGC assay in patients with septic shock
The MV-PGC assay was evaluated in septic shock, a clinical situation combining increased levels of LMVs and fibrinolytic imbalance [Citation26,Citation27]. MV-PGC and PAI-1 were measured in 34 consecutive adult patients with a diagnosis of septic shock who were prospectively enrolled after admission to an intensive care unit. Mortality at 30 days was 38%. No significant differences were found between survivors and nonsurvivors with respect to anteriority, medications, sepsis origin or infectious agents (supplemental ). Interestingly, in our series of septic patients, we found that survivors had significantly higher MV-PGC values both at inclusion and 24 h later than healthy controls (Figure 5(a)) and nonsurvivors (3.1 [1.7–18] vs 1.4 [0.8–3.0] A405nm × 10−3/min, p = 0.02, H0; 5.2 [2.2–16] vs 1.4 [1–1.6] A405nm × 10−3/min, p = 0.004, H24). As expected, PAI-1 activity was significantly lower at admission in the patients who survived (S) compared with those who died (NS) (median [interquartile range]; 3 [Citation2–Citation37] vs 43 [Citation34–55] a.u. (arbitrary units)/mL, p = 0.008, Figure 5(b)). This result was confirmed 24 h after admission (3 [Citation2–Citation27] vs 53 [Citation24–55] a.u., p = 0.007, Figure 5(b)).
Because of the link between PAI-1 and the plasmin generation, we measured the impact of PAI-1 on the MV-PGC assay. As a result, the PAI-1 concentration clearly impacted the assay results (Figure 5(c)). However, very interestingly, the inhibitory effect of PAI-1 was only partial, and the results remained dependent on the initial MV-PGC activity regardless of the PAI-1 concentration. Indeed, even under conditions of high PAI-1 levels representing sepsis conditions (50 µg/mL), we still observed a significant difference between the HL and LL samples (12.9 ± 3.8 A405nm × 10−3/min vs 3.1 ± 0.35 A405nm × 10−3/min; p < 0.05, respectively). Interestingly, this difference remained within extraphysiologic PAI-1 concentration (500 µg/mL) (2.1 ± 0.8 A405nm × 10−3/min HL vs 0.6 ± 0.16 A405nm × 10−3/min LL; p < 0.05). Moreover, in the septic shock cohort, PAI-1 and MV-PGC values were not correlated (r2 = −0.17; p = 0.36, H0; r2 = −0.29; p = 0.16, H24). Combining both MV-PGC and PAI-1 in a ratio (MV-PGC/PAI-1) resulted in the highest discrimination between the two groups of patients (SV: 1.0 [0.2–2.2] vs NSV: 0.03 [0.02–0.1] a.u., p = 0.0004, H0; SV: 1.3 [0.3–3.9] vs NSV: 0.03 [0.02–0.07] a.u., p = 0.0007, H24; Figure 5(d)). Interestingly, these results were confirmed for survival within a shorter time at 7 days (supplemental ).
Discussion
Most of the previously described functional assays measuring the MVs activity have been related to their procoagulant potential. The novelty of the present study is the development of an innovative strategy based on a hybrid capture bioassay combining the specific immunocapture of MVs from human plasma and measurement of their plasmin generation capacity. Combining IMS with a plasmin generation functional assay boosted with ε-ACA improves the measurement MV-PGC in clinical samples, with a significant gain in sensitivity and reproducibility. This original bio-assay open the way for reproducibly measuring the microvesicular fibrinolytic potential (LMV-PGC) in pathological settings. We demonstrated for the first time that LMV-PGC was higher in septic shock patients who survived, both at inclusion and 24 h later, than patients who died. Combining PAI-1 with MV-PGC increased the prognostic value of PAI-1 alone in septic shock patients.
The developed assay specifically extracts a MV subset from plasma samples, which is mainly granulocytic in origin and bears most of the MV-associated fibrinolytic activity. Taken together, the results demonstrate that the newly developed hybrid capture assay specifically measures MV-dependent plasmin generating activity. Moreover, compared with IMS-based assay based on high-speed centrifugation showed a higher efficiency for MV extraction, with higher sensitivity and reproducibility, while ensuring a very good specificity for MV associated plasmin activity.
Immuno-capture has already been advantageously used in different methods to extract MVs from plasma samples. Most of these methods aim at phenotypically quantifying MVs subpopulations. For instance, the extracellular vesicle microarray (EV array) or surface plasmon resonance imaging (SPRi) combined with protein microarray technology have recently been applied to MVs [Citation35]. Functional assays such as Zymuphen-MV (Hyphen Biomed, Andresy, F) combine solid-phase capture of MVs on annexin V or antibodies and determination of prothrombinase activity [Citation36]. However, these methods are limited by the passive sedimentation of MVs and a limited contact surface. Alternatively, to overcome these issues, beads can be used to specifically capture MVs. For example, micro-NMR technology using tetrazine-labelled magnetic nanoparticle-captured EVs has also been successfully used to detect tumoural EGFRv3+ EVs in glioblastoma patients [Citation37]. In agreement with these results, the present study demonstrates the ability of antibody-coated magnetic beads to specifically isolate MVs of a definite cellular origin independently of the coating process. Using electron microscopy, high speed centrifugation, nanofiltration and detergent mediates solubilization of lipids, we demonstrated that the MV-PGC is indeed MV derived. Compared with IMS, the differential high speed centrifugation method, which is a more general approach for MV isolation, is a more tedious approach that requires several labour-intensive steps and costly equipment. We demonstrated that high speed centrifugation reproducibility is significantly affected by the rotor used for centrifugation and is significantly less sensitive to IMS. These results indicate that IMS is more appropriate than high speed centrifugation to isolate MVs probably because it is less dependent on the MV size and density. Moreover, high speed centrifugation fails to discriminate MVs from contaminating structures such as protein/lipid aggregates [Citation38] and induces the aggregation of MVs [Citation39]. In contrast, our direct immuno-magnetic isolation technique requires minimal hands-on time and produces purified MVs, enabling downstream analysis with good reproducibility. The long incubation time still remains a limitation to translate the assay to the clinics. However, future automation will provide an opportunity to optimize this parameter.
The sensitivity of the MV-PGC assay was optimized by adding ε-ACA as a reaction booster. Moreover, ε-ACA allows a better recovery of the plasmin at the final step of the method after separation with the magnetic beads. Indeed, due to the presence of ε-ACA, the plasmin generated by the MVs is mainly released in the bead supernatant rather than being retained on the MVs surface on plasminogen receptors such as α-enolase. This addition allows the measurement of all the plasmin generated by the MVs in the bead supernatant in the final step of the assay without the magnetic beads which may interfere with the absorbance reading. The addition of ε-ACA is therefore a major component in explaining the good performance of the developed MV-PGC assay. Such optimization increases the sensitivity to detect not only basal MV-PGC levels in healthy donors but also to measure a significant alteration in MV-PGC in pathological settings.
Regarding the specificity of the assay, because the active sites of thrombin and plasmin are very close which can induce a lack of substrate specificity, we checked the absence of significant impact of thrombin. In addition, because neutrophil elastase is richly present in leukocytes and play a role in fibrinolysis, we also verified the absence of significant impact of this enzyme on the assay. In fine, the MV-PGC assay proved to be specific for the plasmin generated by the urokinase vectorized by the MVs and does not depend on thrombin or elastase.
The MV-PGC was developed to measure the plasmin generation capacity of LMVs because of clinical interest in this specific subset of MVs and because we have shown here that most circulating MV-PGC is of leukocytic origin. Among the tested leukocytic specificities, CD15 showed the best efficiency for the extraction of MV-PGC. This result is in agreement with the FCM-based staining intensities of CD11b and CD45 on PMN-MVs, which are lower than those observed for CD15. Interestingly, although CD15 is expressed both on monocytes and granulocytes, its expression level is too low on monocyte-derived MVs to be detected by FCM, strongly suggesting that most of the MV-PGC measured by this new assay is of granulocytic origin. We cannot exclude the possibility that in pathological settings or in other biological fluids, a proportion of MV-PGC could be supported by other MV subsets, such as endothelium- [Citation25] or tumour cell-derived [Citation40] MVs. This MV-PGC assay may easily be extended to detect MVs from other cellular origin by substituting or complementing CD15 antibodies with other antibodies such as anti-CD146 or anti-EpCAM [Citation41].
Using the new assay, we reproducibly measured MV-PGC in septic shock patients, a clinical situation associated with fibrinolytic imbalance and we found that MV-PGC values were dramatically higher in those who survived than in patients who died, conversely to the variation in PAI-1. According to the current understanding, inflammatory cytokines induce an exaggerated release of PAI-1 during severe infections, thereby resulting in decreased levels of plasmin activity in plasma [Citation26]. As confirmed by our results, PAI-1 activity levels are very heterogeneous among patients and have been shown to be inversely correlated with survival, [42, 43]. The present data show that PAI-1 activity in plasma impacts MV-PGC, but the PAI-1 concentration alone is not the only parameter controlling MV-PGC. Indeed, fibrinolytic activity vectorized by MVs is partially protected from its physiologic inhibitors [Citation24]. These data corroborate the lack of correlation between soluble PAI-1 activity and MV-PGC in septic shock patients. PAI-1 activity and MV-PGC therefore provide complementary information that may explain why a ratio of the two parameters improves the discrimination between the two groups of patients in septic shock.
In conclusion, we have developed a new strategy that utilizes, for the first time, a hybrid capture bioassay to specifically measure LMV-PGC from human plasma. This strategy allows the evaluation of a microvesicle functional signature according to cell origin and opens new perspectives to specifically measure subcellular fibrinolytic potential in clinical settings with fibrinolytic imbalance.
Supplemental Material
Download Zip (5.7 MB)Acknowledgments
We are grateful to Dr J. Courageot and A. Altié (Electron Microscopy Department, Medicine Faculty of La Timone, Aix-Marseille University) for their contribution to the microscopy pictures.
Disclosure statement
P. Poncelet, T. Bouriche and C. Judicone are full-time employees of BioCytex Company.
Supplementary Material
Supplemental data for this Article can be accessed here.
Additional information
Funding
Related Research Data
References
- Piccin A, Murphy WG, Smith OP. Circulating microparticles: pathophysiology and clinical implications. Blood Rev. 2007;21:1–13.
- Raposo G, Stoorvogel W. Extracellular vesicles: exosomes, microvesicles, and friends. J Cell Biol. 2013;200:373–383.
- van der Pol E, Böing AN, Gool EL, et al. Recent developments in the nomenclature, presence, isolation, detection and clinical impact of extracellular vesicles. J Thromb Haemost JTH. 2016;14:48–56.
- Angelillo-Scherrer A. Leukocyte-derived microparticles in vascular homeostasis. Circ Res. 2012;110:356–369.
- Halim ATA, Ariffin NAFM, Azlan M. Review: the Multiple Roles of Monocytic Microparticles. Inflammation. 2016;39:1277–1284.
- Lacroix R, Dubois C, Leroyer AS, et al. Revisited role of microparticles in arterial and venous thrombosis. J Thromb Haemost JTH. 2013;11(Suppl 1):24–35.
- Reid VL, Webster NR. Role of microparticles in sepsis. Br J Anaesth. 2012;109:503–513.
- Nieuwland R, Berckmans RJ, McGregor S, et al. Cellular origin and procoagulant properties of microparticles in meningococcal sepsis. Blood. 2000;95:930–935.
- Zhang Y, Meng H, Ma R, et al. Circulating microparticles, blood cells, and endothelium induce procoagulant activity in sepsis through phosphatidylserine exposure. Shock Augusta Ga. 2016;45:299–307.
- Diamant M, Nieuwland R, Pablo RF, et al. Elevated numbers of tissue-factor exposing microparticles correlate with components of the metabolic syndrome in uncomplicated type 2 diabetes mellitus. Circulation. 2002;106:2442–2447.
- Omoto S, Nomura S, Shouzu A, et al. Detection of monocyte-derived microparticles in patients with Type II diabetes mellitus. Diabetologia. 2002;45:550–555.
- Nomura S, Inami N, Shouzu A, et al. Correlation and association between plasma platelet-, monocyte- and endothelial cell-derived microparticles in hypertensive patients with type 2 diabetes mellitus. Platelets. 2009;20:406–414.
- Sarlon-Bartoli G, Bennis Y, Lacroix R, et al. Plasmatic level of leukocyte-derived microparticles is associated with unstable plaque in asymptomatic patients with high-grade carotid stenosis. J Am Coll Cardiol. 2013;62:1436–1441.
- Ogata N, Nomura S, Shouzu A, et al. Elevation of monocyte-derived microparticles in patients with diabetic retinopathy. Diabetes Res Clin Pract. 2006;73:241–248.
- Mesri M, Altieri DC. Endothelial cell activation by leukocyte microparticles. J Immunol Baltim Md. 1950;1998(161):4382–4387.
- Mesri M, Altieri DC. Leukocyte microparticles stimulate endothelial cell cytokine release and tissue factor induction in a JNK1 signaling pathway. J Biol Chem. 1999;274:23111–23118.
- Dalli J, Norling LV, Renshaw D, et al. Annexin 1 mediates the rapid anti-inflammatory effects of neutrophil-derived microparticles. Blood. 2008;112:2512–2519.
- Morel O, Toti F, Hugel B, et al. Procoagulant microparticles: disrupting the vascular homeostasis equation? Arterioscler. Thromb Vasc Biol. 2006;26:2594–2604.
- Owens AP, Mackman N. Microparticles in hemostasis and thrombosis. Circ Res. 2011;108:1284–1297.
- Satta N, Freyssinet JM, Toti F. The significance of human monocyte thrombomodulin during membrane vesiculation and after stimulation by lipopolysaccharide. Br J Haematol. 1997;96:534–542.
- Pérez-Casal M, Downey C, Fukudome K, et al. Activated protein C induces the release of microparticle-associated endothelial protein C receptor. Blood. 2005;105:1515–1522.
- Bajaj MS, Ghosh M, Bajaj SP. Fibronectin-adherent monocytes express tissue factor and tissue factor pathway inhibitor whereas endotoxin-stimulated monocytes primarily express tissue factor: physiologic and pathologic implications. J Thromb Haemost JTH. 2007;5:1493–1499.
- Vallier L, Cointe S, Lacroix R, et al. Microparticles and Fibrinolysis. Semin Thromb Hemost. 2017;43:129–134.
- Lacroix R, Sabatier F, Mialhe A, et al. Activation of plasminogen into plasmin at the surface of endothelial microparticles: a mechanism that modulates angiogenic properties of endothelial progenitor cells in vitro. Blood. 2007;110:2432–2439.
- Lacroix R, Plawinski L, Robert S, et al. Leukocyte- and endothelial-derived microparticles: a circulating source for fibrinolysis. Haematologica. 2012;97:1864–1872.
- Gando S. Role of fibrinolysis in sepsis. Semin Thromb Hemost. 2013;39:392–399.
- Levi M, de Jonge E, van der Poll T. van der Poll T. Sepsis and disseminated intravascular coagulation. J Thromb Thrombolysis. 2003;16:43–47.
- Coumans FAW, Brisson AR, Buzas EI, et al. Methodological Guidelines to Study Extracellular Vesicles. Circ Res. 2017;120:1632–1648.
- Lacroix R, Judicone C, Mooberry M, et al. Standardization of pre-analytical variables in plasma microparticle determination: results of the International Society on Thrombosis and Haemostasis SSC Collaborative workshop. J Thromb Haemost JTH. 2013;11:1190–1193.
- Dubois C, Steiner B, Kieffer N, et al. Thrombin binding to GPIbalpha induces platelet aggregation and fibrin clot retraction supported by resting alphaIIbbeta3 interaction with polymerized fibrin. Thromb Haemost. 2003;89:853–865.
- Robert S, Lacroix R, Poncelet P, et al. High-sensitivity flow cytometry provides access to standardized measurement of small-size microparticles–brief report. Arterioscler Thromb Vasc Biol. 2012;32:1054–1058.
- György B, Módos K, Pállinger E, et al. Detection and isolation of cell-derived microparticles are compromised by protein complexes resulting from shared biophysical parameters. Blood. 2011;117:e39–48.
- Heiden M, Seitz R, Egbring R. The role of inflammatory cells and their proteases in extravascular fibrinolysis. Semin Thromb Hemost. 1996;22:497–501.
- Dejouvencel T, Doeuvre L, Lacroix R, et al. Fibrinolytic cross-talk: a new mechanism for plasmin formation. Blood. 2010;115:2048–2056.
- Zhu L, Wang K, Cui J, et al. Label-free quantitative detection of tumor-derived exosomes through surface plasmon resonance imaging. Anal Chem. 2014;86:8857–8864.
- Jy W, Horstman LL, Jimenez JJ, et al. Measuring circulating cell-derived microparticles. J Thromb Haemost JTH. 2004;2:1842–1851.
- Shao H, Chung J, Balaj L, et al. Protein typing of circulating microvesicles allows real-time monitoring of glioblastoma therapy. Nat Med. 2012;18:1835–1840.
- Tauro BJ, Greening DW, Mathias RA, et al. Comparison of ultracentrifugation, density gradient separation, and immunoaffinity capture methods for isolating human colon cancer cell line LIM1863-derived exosomes. Methods San Diego Calif. 2012;56:293–304.
- Linares R, Tan S, Gounou C, et al. High-speed centrifugation induces aggregation of extracellular vesicles. J Extracell Vesicles. 2015;4:29509.
- Graves LE, Ariztia EV, Navari JR, et al. Proinvasive properties of ovarian cancer ascites-derived membrane vesicles. Cancer Res. 2004;64:7045–7049.
- Roca E, Lacroix R, Judicone C, et al. Detection of EpCAM-positive microparticles in pleural fluid: A new approach to mini-invasively identify patients with malignant pleural effusions. Oncotarget. 2016;7:3357–3366.