
ABSTRACT
To comprehensively study extracellular small RNAs (sRNA) by sequencing (sRNA-seq), we developed a novel pipeline to overcome current limitations in analysis entitled, “Tools for Integrative Genome analysis of Extracellular sRNAs (TIGER)”. To demonstrate the power of this tool, sRNA-seq was performed on mouse lipoproteins, bile, urine and livers. A key advance for the TIGER pipeline is the ability to analyse both host and non-host sRNAs at genomic, parent RNA and individual fragment levels. TIGER was able to identify approximately 60% of sRNAs on lipoproteins and >85% of sRNAs in liver, bile and urine, a significant advance compared to existing software. Moreover, TIGER facilitated the comparison of lipoprotein sRNA signatures to disparate sample types at each level using hierarchical clustering, correlations, beta-dispersions, principal coordinate analysis and permutational multivariate analysis of variance. TIGER analysis was also used to quantify distinct features of exRNAs, including 5ʹ miRNA variants, 3ʹ miRNA non-templated additions and parent RNA positional coverage. Results suggest that the majority of sRNAs on lipoproteins are non-host sRNAs derived from bacterial sources in the microbiome and environment, specifically rRNA-derived sRNAs from Proteobacteria. Collectively, TIGER facilitated novel discoveries of lipoprotein and biofluid sRNAs and has tremendous applicability for the field of extracellular RNA.
Introduction
High-throughput small RNA sequencing (sRNA-seq) is a state-of-the-art method for profiling sRNAs and is widely used across many disciplines. The most extensively studied class of sRNAs is microRNAs (miRNA) [Citation1] and current sRNA-seq analysis tools are limited to only miRNA quantification [Citation2]. Intriguingly, many other classes of sRNAs beyond miRNA are present in sRNA-seq datasets [Citation3]. These include sRNAs derived from parent transfer RNAs (tRNA), ribosomal RNAs (rRNA), small nucleolar RNAs (snoRNA), small nuclear RNAs (snRNA), long non-coding RNAs (lncRNA), Y RNAs and several other miscellaneous non-coding RNAs[Citation4,Citation5]. For consistency in nomenclature, here, we will refer to these novel sRNA classes as tRNA-derived sRNAs (tDR), rRNA-derived sRNAs (rDR), lncRNA-derived sRNAs (lncDR), snRNA-derived sRNAs (snDR), snoRNA-derived SRNAs (snoDR), Y RNA-derived sRNAs (yDR) and other miscellaneous sRNAs (miscRNA). Outside of miRNAs and tDRs, the biological function(s) of other sRNAs are largely unknown [Citation3,Citation5]. Nevertheless, similar to miRNAs, many of these endogenous sRNAs are present in biological fluids as extracellular RNA (exRNA) and hold great potential as disease biomarkers or intercellular communication signals [Citation6,Citation7]. However, the lack of proper tools to identify, quantify and analyse the depth of exRNA in sRNA-seq datasets is limiting for scientific discovery. This void is only deepened by reports that many exRNA datasets are heterogeneous pools of host (e.g. human) and non-host (e.g. bacteria) sRNAs [Citation8–Citation10].
In plasma and other biofluids, exRNAs are carried by extracellular vesicles, lipoproteins and ribonucleoproteins, which protect exRNAs against RNase-mediated degradation [Citation11,Citation12]. Previously, we reported that lipoproteins – low-density lipoproteins (LDL) and high-density lipoproteins (HDL) – transport miRNAs in plasma, and lipoprotein miRNA signatures are distinct from exosomes [Citation13]. Using real-time PCR-based TaqMan arrays, we further identified HDL-miRNAs that were significantly altered in hypercholesterolemia and atherosclerosis [Citation13]. Currently, it is unknown if lipoproteins transport other sRNAs in addition to miRNAs. In a previous study, we reported that HDL transfer miRNAs to recipient cells and this process is regulated by HDL’s receptor, scavenger receptor BI (SR-BI), in hepatocytes [Citation13]. SR-BI is a bidirectional transporter of cholesterol and a critical factor in reverse cholesterol transport pathway in which HDL returns excess cholesterol to the liver for excretion to bile. Unlike the LDL-receptor, which promotes receptor-mediated uptake, SR-BI performs selective cholesterol ester uptake at the plasma membrane, allowing HDL particles to release after lipid transfer. Currently, it is unknown if miRNAs, and potentially other sRNAs, on lipoproteins follow selective cholesterol uptake and are transported to the liver for secretion to bile. Likewise, as SR-BI can export cholesterol to HDL, it is unclear whether SR-BI directly influences sRNAs on lipoproteins or in biofluids.
To assess the role of SR-BI in lipoprotein-sRNA trafficking we performed sRNA-seq of lipoprotein pools (HDL and apolipoprotein-B [APOB]), bile, urine and liver obtained from wild-type and SRBI-deficient mice. To overcome analytical challenges for these datasets, we developed a novel data analysis pipeline entitled, “Tools for Integrative Genome analysis of Extracellular sRNAs (TIGER)”, which integrates host and non-host sRNA analysis through both genome and database alignments, and greatly improved the ability to identify, quantify and compare reads from sRNA-seq datasets. Using TIGER, we found that lipoproteins transport a wide-variety of host and non-host sRNAs, most notably bacterial rDRs and tDRs. Using TIGER, we identified that lipoproteins had distinct host sRNA signatures relative to liver, bile and urine. Moreover, comparative analysis outputs from TIGER revealed only a minimal impact of SRBI-deficiency at the parent RNA level (i.e. tRNA/rRNA). Yet, when reads were organized at the individual fragment level, we found that loss of SR-BI in mice resulted in many significant changes to specific sRNA classes in different sample types. TIGER was designed to maximize assignment of reads in sRNA-seq analysis of endogenous and exogenous origins, particularly for exRNA, and its application uncovered many novel observations for sRNAs on lipoproteins and in liver and biological fluids.
Material and methods
Animal studies
Plasma, basal bile, urine and livers were collected from wild-type (WT) and SR-BI-deficient (B6;129S2-Scarb1tm1Kri/J, SR-BI KO) mice, as previously described [Citation14]. Mice were anaesthetized with urethane (1g/kg, i.p.). The common bile duct was ligated and the gall bladder cannulated to divert bile into collection tubes. Basal bile was collected for a period of 30 min. Mice were then exsanguinated, blood was collected from the abdominal aorta in EDTA coated tubes and placed on wet ice, and tissues were dissected and snap frozen in liquid nitrogen. To limit the possibility of bacterial growth in blood samples, blood was stored on ice for a period of no longer than 30 min prior to plasma separation. Plasma, biofluids and tissues were immediately stored at −80°C after collection and until analysis. All animal procedures were completed under active and approved IACUC protocols.
Lipoprotein isolation
To separate HDL and APOB-containing lipoproteins from mouse plasma, 200 µL of 0.22-µm filtered-plasma samples were diluted to 500 µL in size-exclusion chromatography (SEC) running buffer (10 mM Tris-HCl, 0.15 M NaCl, 0.2% NaN3) and injected an ÄKTA SEC system (GE Healthcare) with three in-series Superdex-200 Increase gel filtration columns (10/300 GL; GE Healthcare). Importantly, NaN3 functions to limit bacterial growth in samples and within the FPLC system. Samples were applied to the column with a flow rate of 0.3 mL/min at room temperature and eluate collected as 72 × 1.5 mL fractions using a F9-C 96-well plate fraction collector (GE Healthcare). Each fraction was analysed for total protein (BCA; Pierce), total cholesterol (Raichem) and triglycerides (Raichem) to identify fractions corresponding with HDL and APOB particles. Due to the SEC set-up, overlap between VLDL and LDL particles led us to collected fractions covering both lipoprotein classes, referred to here as APOB. Fractions corresponding with each lipoprotein group were pooled, concentrated with Amicon Ultra-4 10 kDa centrifugal filters (Millipore) to <200 µL volume, and protein concentrations were quantified by BCA assays (Pierce). Based on the distribution of total cholesterol, triglycerides and protein, fractions corresponding to HDL and APOB were collected, pooled and concentrated. Similar procedures were used to isolate lipoproteins from freshly collected human plasma (purchased from The Interstate Companies; 2 donors; EDTA collected).
DNA isolation and assessment of bacterial DNA
To isolate total DNA we used a standard protocol described by Kogan et al. [Citation15]. To generate bacterial source material, an overnight culture of DH5a E. coli was diluted 1:100 in PBS. Ten microliters of diluted E. coli, or 30 μL of mouse plasma (n = 8) was then brought up to a volume of 100 μL with Gitschier buffer and incubated at 95°C for 5 min. Subsequently, samples were allowed to cool, spiked with 1 mg/mL Proteinase K, incubated at 60°C for 1 h and then inactivated at 95°C for 5 min. DNA isolates were then concentrated to 10 μL with DNA Clean and Concentrate-5 (Zymo). To measure bacterial DNA content, 1 ng of E. coli DNA was serially diluted (1:5) 5 times for an effective detection range of 1 ng to 0.32 pg and bacterial DNA was amplified by real-time PCR using a previously described [Citation16] eubacteria primer set: Forward 5ʹ-ACTCCTACGGGAGGCAGCAGT-3ʹ and Reverse 5ʹ-ATTACCGCGGCTGTGGC-3ʹ. Likewise, bacterial DNA content was assessed from 4 μL of plasma DNA isolates (40%) or 4 mL of molecular grade water.
Transcriptomics
To differentiate lipoprotein sRNA signatures from liver and biofluids, and determine the impact of SR-BI-deficiency, samples were collected from Scarb1−/- (SR-BI KO) and WT mice. Total RNA was extracted from HDL (WT N = 7, SR-BI KO N = 7) and APOB (WT N = 7, SR-BI KO N = 7) particles, as well as livers (WT N = 7, SR-BI KO N = 7), bile (WT N = 7, SR-BI KO N = 6) and urine (WT N = 5, SR-BI KO N = 6). RNA was isolated from equal inputs of either bile (volume), liver (mg), HDL (protein) or APOB (protein) using miRNEasy Mini kits (Qiagen). Specifically, 30 µL of primary bile, 120 μg of APOB, 180 μg of HDL or 20 mg of liver were added to 1 mL of Qiazol. Livers were homogenized in Qiazol with High-Impact Zirconium beads using a Bead Bug Homogenizer (Benchmark Scientific). After removal of beads, subsequent steps for liver RNA extraction were followed according to manufacturer’s protocol. Bile, APOB and HDL RNA isolations were processed according to manufacturer’s protocol, except that after addition of ethanol, samples were incubated at −80°C overnight before application to isolation columns and were eluted with a volume of 50 μL. Liver RNA samples were quantified by Take3 plates (BioTek) and screened for quality by NanoChip Bioanalyzer (Agilent). All liver samples met standards of RNA quality with RIN > 7.0.
Total RNA from equimolar amounts of HDL or APOB protein and equivolume amounts of bile or urine samples were diluted 1:10; 50 ng of total RNA from liver was used for reverse transcription using either miRCURY LNA universal RT kit (Exiqon) or TaqMan miRNA Reverse Transcription kit, as per manufacturer’s instructions. Real-time PCR was performed with the QuantStudio 12K Flex Real-Time PCR System (Life Technologies) using either: (A) miRCURY LNA SYBR Green PCR kit (Exiqon) and either miRNA-specific or custom-sequence specific LNA probes (Exiqon) or (B) TaqMan miRNA-specific probes. Relative quantitative values (RQV) were determined for both HDL and cellular miRNA analyses. RQV = 2−dCt. exo_rDR_Pflo23S 5ʹ-AGAGAACTCGGGTGAAGGAACT-3ʹ, exo_rDR_Vsp 5ʹ-TGGGTGTGACGGGGAAGCAGG-3ʹ, exo_rDR_Jliv 5ʹ-GACCAGGACGTTGATAGGCTGGGTGTGGAAGTG-3ʹ, miscRNA_Rpph1 5ʹ-CGGGCCTCATAACCCAATTCAGACTACTCTCCCCCGCCCTC-3ʹ, snDR_Gm26232 5ʹ-GCGGGAAACTCGACTGCATAATTTGTGGTAGTGGGGGACTGCGTTCGCGCTCTCCCCTG-3ʹ, snDR_Gm22866 5ʹ-ATAATTTGTGGTAGTGGGG-3ʹ, tDR-GluCTC 5ʹ-TCCCTGGTGGTCTAGTGGTTAGGATTCGGCGCTCTC-3ʹ and tDR-GlyGCC 5ʹ-GCATTGGTGGTTCAGTGGTAGAATTCTCGC-3ʹ. For HDL, APOB, bile and urine samples, an arbitrary housekeeping Ct = 32 was applied, and RQVs for liver sRNAs were normalized by U6.
NEXTflex Small RNA Library Preparation Kits v3 for Illumina® Platforms (BioO Scientific) were used to generate cDNA libraries for sRNA-seq. Briefly, 1 µg of liver total RNA was used as input for adapter ligation, as per manufacturer’s protocol. For bile, APOB and HDL RNA, 10.5 μL (21%) of the RNA isolation eluate was used as input for adapter ligation. Library generation was performed according to manufacturer’s protocol (BioO Scientific) with a modification to the amplification step, as liver libraries received 18 cycles and bile, APOB and HDL libraries received 25 cycles. After amplification, samples were size-selected using a Pippin-Prep (Sage Science) – set for a range of 135–200 nts in length – and subsequently purified and concentrated using DNA Clean and Concentrator 5 kit (Zymo). Individual libraries were then screened for quality by High-Sensitivity DNA chips using a 2100 Bioanalyzer (Agilent) and quantified using High-Sensitivity DNA assays with Qubit (Life Technologies). Equal concentrations of all individual libraries were pooled for multiplex sequencing runs, and concentrated using DNA Clean and Concentrator 5 kit (Zymo). For rigour in downstream comparisons, all 66 sequencing libraries were randomized and run independently on 3 individual sequencing lanes (22 samples/lane; randomized). Single-end sequencing (75 cycles) of multiplexed libraries were performed on an Illumina NextSEQ 500 at the Vanderbilt Technologies for Advanced Genomics (VANTAGE) core laboratory. We recommend targeting 12–20 million total reads per sample with the expectation that >85% of those reads are of sufficient quality for mapping. However, we have had successful results with as little as 5 million quality reads. In the present study, each library was sequenced at an average depth of 16.28 million reads/sample.
Data analysis
The TIGER pipeline has many unique analysis features built into seven modules for low-level and high-level analyses with data visualization packages. The first module contains pre-processing steps (green) prior to data analysis (). To assess raw data quality, FastQC was performed at the raw read level to check for base quality, total read counts and adapter identification (www.bioinformatics.babraham.ac.uk/projects/fastqc). Cutadapt was then used to trim 3ʹ adapters from processed reads (-a TGGAATTCTCGGGTGCCAAGG). Although this pipeline can analyse sRNA-seq data prepared by different library generation methods, TIGER was optimized to analyse sRNA-seq data prepared by ligation of adapters containing four terminal degenerate bases, which reduce ligation bias (e.g. BioO Scientific NEXTflex Small RNA-seq kit v3). Cutadapt was then used to remove the first and last 4 bases from the trimmed reads and all trimmed reads < 16 nts in length were removed (-m 16 -u 4 -u -4) [Citation17]. After trimming, read length distributions were plotted and FastQC was performed on trimmed reads to validate the efficiency of adapter trimming. The processed reads were then summarized and plotted. To generate identical read files, trimmed reads in each sample were collapsed into non-redundant “identical” reads in FASTQ format and copy numbers were recorded for downstream analysis. Pre-processed reads were then analysed by the Host Genome & Database (blue) and Class-Independent (red) modules in parallel (). In the Host Genome & Database alignment module (blue), bowtie (v1.1.2) was used to map reads to a custom database with option (-a -m 100 -best -strata -v 1) which allows 1 mismatch (MM) and 100 multimapped loci, and only the best matches were recorded [Citation18]. Bowtie is an ultrafast, memory-efficient short read aligner geared towards quickly aligning large sets of short DNA sequences to large genomes. We feel that features of bowtie (e.g. does not allow gapped sequences) provide enhanced specificity to limit false positives. The custom database was constructed by the host genome and known sequences of host mature transcripts curated in specific library databases – tRNAs (http://gtrnadb.ucsc.edu/GtRNAdb2/) and rRNA (http://archive.broadinstitute.org/cancer/cga/rnaseqc_download). A small number of parent tRNA genes contain introns and the mature transcript differs from the genomic sequence; therefore, the incorporation of mature tRNA transcripts from GtRNAdb database into the genomic alignment overcame these limitations. This approach allows for the detection of tDRs spanning exon junctions and allows reads the chance to be mapped to other non-tRNA loci in the genome with best alignment score which reduces the false-positive tDR reads that can result from database only alignment strategies. Counting and differential expression analysis of miRNAs, tDRs, rDRs, snDRs, snoDRs and other miscellaneous sRNAs (miscRNA), including yDRs and lincDRs, were performed in ranking order, respectively. The pipeline by default does not quantify Piwi-interacting RNA (piRNA), due to their restricted expression within germline cells [Citation19]. However, this function can be amended by the user. All prepossessed quality reads were assigned to different classes of annotated sRNAs using distinct rules – miRNA: 1 MM, ≥ 16nt, offset −2, −1, 0, 1, 2 and tDR, snDRs, snoDRs, yDRs and miscRNAs: 1 MM, ≥16nt, overlap ≥ 0.9 overlap. Based on the extensive genomic coverage of lncRNAs and repetitive elements and conservation of rRNAs, the TIGER pipeline applies more stringent assignment rules for lncDRs and rDRs – perfect match, ≥20 nt and ≥90% overlap with parent lncRNAs or rRNAs. Furthermore, reads assigned to lncDRs must only be aligned to lncRNA coordinates and not to any other loci in the genome. The need for such criteria arose from our observation that short reads (<20 bp) map promiscuously to the genome when allowing one mismatch. This was largely corrected for by mapping only to defined non-coding RNA loci. However, we observed that lncRNA loci, which often span many kilobases, frequently contained mapped reads that met only the minimum requirement for mapping (i.e. 16 nts in length with 1 mismatch). Moreover, mapped reads were nearly always within introns. Increased stringency on these longer ncRNAs resulted in a precipitous drop in lncRNA reads. All reads ≥ 20 nts in length and not aligned to this custom database was extracted and tested for alignment as non-host reads. Afterward, tabulation of read counts, high-end analyses were performed on host sRNAs. These include categorical analysis and visualization, principal component analysis, hierarchical clustering and correlation of samples and groups at the parent and individual fragment levels. sRNAs can be normalized by reads per million total reads (RPM) or reads per million class reads, e.g. total miRNA reads (RPM miR). Differential expression detection of tabulated read counts were performed by DEseq2 [Citation20]. In addition, miRNAs were analysed at the canonical, isomiR, non-templated addition (NTA), NTA base and isomiR NTA levels. Non-host reads were then analysed using the Non-Host Genome (Purple) and Non-Host Library (Gold) modules in parallel (). In the Non-Host Genome module, reads were aligned in parallel to two collections of bacterial genomes: a human microbiome (HMB) collection and a hand-curated list of environmental bacteria observed during sequencing of human and mouse lipoproteins. The HMB list was compiled by reducing 3055 bacterial genomes available from the Human Microbiome Project (www.hmpdacc.org) to single non-redundant genera, and extracting the largest available complete genome for each genera. Conversely, to generate the environmental bacteria list, the top 100 most abundant sequences in a control HDL cohort, that were not mapped to the host genome, were submitted to NCBI for BLASTn. All hits that showed 100% coverage and 100% identity were then compiled; non-redundant genera were extracted; redundant genera to the HMB were removed. Representative genomes from the remaining species were then compiled to the environmental bacteria list (ENV). Additionally, a small group of fungal genomes associated with the human pathology were also collected. The HMB, ENV and fungal modules contain 206, 167 and 8 representative genomes, respectively. Due to high conservation between bacterial genomes and multimapping issues, a different bowtie option (-a -m 1000 -best -strata -v 0) was used which allowed perfect match only and 1000 multimapped loci. Perfect match only mapping provides the strongest argument for the validity of exogenous sRNA in samples; however, this restriction can be loosened in the software if desired by the user. We caution though that the large number of genomes used for mapping in this module can result in many false positives using less strict criteria. Reads were aligned to the HMB, ENV and fungal groups in parallel and, thus, the same reads could have been counted in multiple groups. The fraction of reads that align to both databases (HMB, ENV) and the reads that are unique to specific databases were plotted. Differential expression and high-end analyses, as described above, were performed at the genome level (total normalized read count for each genome) and at the individual read level. In parallel, non-host reads were also analysed by the Non-Host Library (Gold) module where they were aligned to non-coding RNA databases with same bowtie option as non-host genome analysis. To identify possible non-host miRNAs (xenomiRs) in sRNA-seq datasets, all non-host reads were aligned perfectly to annotated miRNAs in miRBase (miRBase.org) and tabulated. Similarly, non-host reads were aligned to all tRNAs in the GtRNAdb database (GtRNAdb2). Extensive categorical analysis of parent non-host tRNAs were performed at the kingdom, genome (species), amino acid, anti-codon and fragment (read) levels. All assigned non-host tDRs underwent differential expression analysis, high-end analysis and data visualization, as described above. Non-host reads were also aligned to prokaryotic and eukaryotic rRNA transcripts in SILVA database (https://www.arb-silva.de). TIGER limits the analysis of non-host rDR to the kingdom level for counting, differential expression analysis and high-end analysis. Of note, some users may seek to avoid a defined host genome and map all quality reads to the provided non-host genome and library modules, as has been demonstrated by the exceRpt pipeline [Citation21]. To perform this function with TIGER, define “search_host_genome = 0” during configuration.
Figure 1. Schematic of the TIGER sRNA-seq analysis workflow. Total reads from sRNA-seq platform are filtered through pre-processing steps (green) to yield total quality reads. Filtered reads are then applied to a class-independent analysis (red), which compares the most abundant reads of each sample/group, regardless of mapping identity. Independently, filtered reads are aligned to the host genome (e.g. mouse; light blue) and categorized by sRNA type for analysis. Quality reads that are >19 nt that failed to align to the host genome are then separately aligned to either bacterial and fungal genome databases (purple) or exogenous rRNA, RNA and miRNA databases (gold). Results of host and non-host segments of the pipeline are summarized and plotted (navy). Lastly, reads that fail to map in host and non-host segments are sorted by abundance for comparison and submitted for BLASTn to identify putative origins (orange).
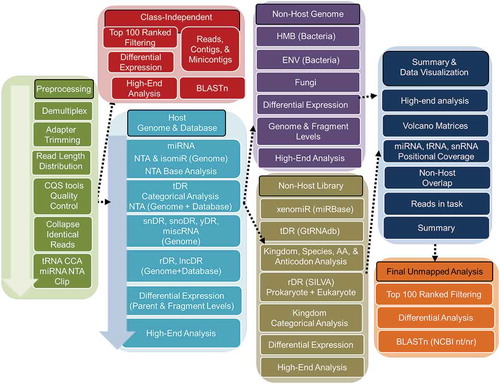
The TIGER pipeline also analysed the top most abundant reads independent of class or annotation in parallel of the host genome, non-host genome and database modules. The Class-Independent module (red) ranked and filtered the top 100 most abundant reads in each sample independent of genomic annotation. The list of top 100 reads from all samples were combined, a count file table was generated and top 100 overall reads were used to perform hierarchical clustering and correlations at the individual sample and group levels. Differential expression analyses were performed by DEseq2, and significantly altered sequences were searched in NCBI nucleotide database using BLASTn to identify possible sources (species). All results from the host genome, class-independent, non-host genome and non-host database modules were then analysed by the Summary & Data Visualization (dark blue) module (). In this module, TIGER summarized and organized many of the individual comparisons. For example, individual volcano plots were graphed into larger matrices grouping different classes of sRNAs and/or genomic groups (e.g. bacteria and fungi). This module also generated a comprehensive table for all mapped reads listing the assignments for each read across modules. Moreover, positional coverage of sRNAs against host parent RNAs were plotted for miRNAs, tDRs, snDRs and rDRs. Positional base coverages were also plotted for individual samples, groups and significantly altered tDRs and snDRs. For groups, the means of normalized positional coverage counts (base positional counts per million mapped total reads) for individual samples in the groups were plotted. Furthermore, this module identified sRNA classes and genomes for the top 100 ranked reads (analysed earlier in the Class-Independent module) and graphed the linkages by circos plots. Finally, this module summarized the read counts in each task and determined the fraction of total reads that were assigned to any module, genome or database. For example, pie charts and stacked bar charts were generated to illustrate the fraction of reads mapped to the host genome and non-host genome and the fraction of unmapped reads. All unmapped and unaccounted for reads entered the Final Unmapped Analysis (orange) module (). In this module, the top 100 analysis was reapplied to all unmapped and unaccounted reads, as described above. After ranking, filtering and tabulation, differential expression analysis was performed and the significantly altered unmapped reads were searched in BLASTn to identify possible genomes not contained in the TIGER analysis. These unique features were designed to extensively and exhaustively analyse sRNA-seq data on lipoproteins (e.g. HDL and apoB particles) and extracellular fluids (e.g. bile and urine) which have many different types of sRNAs and diverse species.
Read counts were reported as both raw counts and normalized count per million total counts (RPM). RPMs were used for stacked bar plots in each module. Cluster analysis were performed and visualized by heatmap3 [Citation22]. Principle component analysis was performed based on normalized expression value calculated by the variance stabilizing transformation in DESeq2. DESeq2 was used to perform miRNA, tDR and other sRNA differential expression analyses. Significantly differential expressed sRNAs with adjusted p-value < 0.05 and absolute fold change > 1.5 will be highlighted in volcano plot (red, increased; blue, decreased) and outputted as tabulated file for further validation. Differential expression results were plotted as volcano plot, Venn diagram and heatmap. Categorical analyses of tDRs based on amino acid and anti-codons of the parent tRNAs were also quantified and plotted. Likewise, categorical analysis of snDRs based on U class were analysed and plotted. Non-metric multidimensional scaling of Bray–Curtis dissimilarity indexes, homogeneity analysis of group dispersions and principal coordinate analysis visualization were performed using R package “vegan”. R Packages ggplot2, vegan, ggraph, igraph, reshape2, data.table, RColorBrewer, circlize, ggtern and XML were used for data visualization.
Statistics
For continuous variables, mean and standard error of the mean (S.E.M.) were used. Comparisons with two variables were calculated using Welch two sample t-tests, two-way Student’s t-tests, or Mann–Whitney nonparametric tests. For comparisons with more than two variables, linear one-way analysis of variance (ANOVA) was used. Spearman ranked method was used for calculating the correlation coefficient (R). Two-sided p value < 0.05 was considered statistically significant. Statistical analyses were performed using R version 3.4.3.
Results
TIGER identifies distinct miRNA signatures of lipoproteins relative to tissue and biofluids
The full-compendium of exRNAs on lipoproteins has not been investigated and an unbiased approach to identifying and quantifying sRNAs on lipoproteins was warranted. To address this gap, high-throughput sRNA-seq was used to profile sRNAs on HDL and apoB-containing particles (APOB) purified from mouse plasma by SEC (Supplementary Figure 1), and lipoprotein profiles were compared to mouse liver, bile and urine. To compare endogenous (mouse) miRNA content between groups, real-time PCR was performed for nine miRNAs across all samples and correlations between PCR results and sRNA-seq results based on each normalization method were compared by rank correlations. For these data, normalization by RPM (R2 = 0.45) showed a higher correlation between PCR and sequencing results than RPM miR (R2 = 0.17) (, Supplementary Table 1) Lipoproteins, specifically APOB particles, were found to have less miRNA content, as reported by total miRNA counts (RPM), than livers which had the largest fraction of miRNAs per total reads (RPM) (). To compare miRNA signatures across sample types, Principal Coordinate Analysis (PCoA) was used, and lipoprotein and biofluid clusters were distinct from livers (). To quantify differences in the homogeneity of the miRNA profile multivariable distributions (miRNAs) within each group, PERMANOVA tests were performed, and miRNA profiles of lipoproteins (HDL and APOB) and biofluids (bile and urine) were significantly different than livers (wild-type, WT, mice) – APOB (F = 9.57, p = 0.001), HDL (F = 7.11, p = 0.001), bile (F = 5.56, p = 0.001) and urine (F = 8.42, p = 0.001) (Supplementary Table 2). Next, beta-dispersion tests were used to determine that lipoprotein (high-dispersions) and biofluid (high-dispersions) samples were significantly (ANOVA p < 0.05) more dispersed (less consistent) than livers (low-dispersion) – APOB (F = 31.03, p < 0.0001), HDL (F = 23.20, p < 0.0001), bile (F = 17.09, p < 0.0001) and urine (F = 15.47, p < 0.0001) (). To further compare miRNA signatures between groups, high-end analyses were performed using hierarchical clustering and correlations of group means. Lipoprotein profiles clustered separately from liver and biofluids, and lipoproteins displayed high correlations between HDL and APOB groups and modest correlations to liver, bile and urine groups (). These results suggest that HDL and APOB transport unique miRNA signatures that are distinct from liver with decreased homogeneity and increased dispersion.
Figure 2. Endogenous miRNA profiles are unique among lipoproteins, biofluids and tissue. WT: wild-type mice; SR-BI KO: Scavenger receptor BI Knockout mice (Scarb1−/-). (a) Correlation of sRNA-seq reads per million total reads (RPM, blue) and miRNA reads (RPM miR, grey) to real-time PCR relative quantitative values (RQV). Spearman correlation. HDL, APOB, liver, bile and urine samples, N = 66. (b-f) Results from sRNA-seq analysis of murine miRNA. HDL WT, N = 7; HDL SR-BI KO N = 7; APOB WT, N = 7, APOB SR-BI KO N = 7; Liver WT, N = 7; Liver SR-BI KO, N = 7; Bile WT, N = 7; Bile SR-BI KO, N = 6; Urine WT, N = 5; Urine SR-BI KO, N = 6. (b) Summary of total miRNA counts per million total (quality) sequencing reads. Mean ± S.E.M. (c) Principal Coordinate Analysis (PCoA) of canonical miRNA profiles for samples from WT (empty circles) and SR-BI KO (filled circles) mice. NMDS1: Non-metric multidimensional scaling. (d) Heatmap of hierarchical clustered pairwise correlation coefficients (Spearman, R) between group means for canonical miRNAs. (e) Start position analysis of 5ʹ miRNA variants (isomiR) for combined (WT and SR-BI KO) mouse samples. (f) Ratio of non-templated U (uridylation) to A (adenylation) for miRNAs. Mean ± S.E.M. One-way ANOVA. *p < 0.05; **p < 0.01.
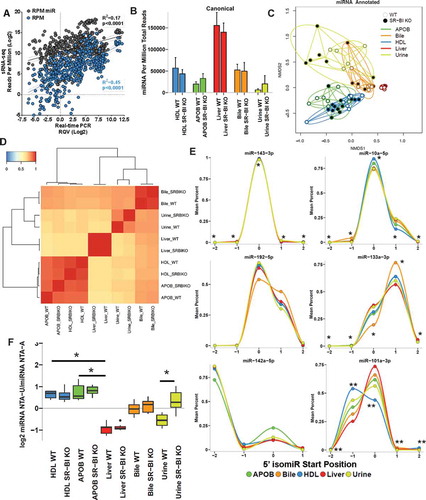
Due to imprecise cleavage of miRNAs from precursor miRNA hairpins [Citation23–Citation25], one miRNA locus can produce multiple isoforms, termed isomiRs, which can differ by one or two nts at the 5ʹ start position. Consequently, the canonical miRNA “seed” sequence is altered, potentially conferring recognition of different mRNA targets [Citation24–Citation26]. Therefore, it is important that miRNA analysis includes quantification of isomiRs. All samples in our study contained 5ʹ isomiRs, with the largest fraction found on HDL (8.42%) followed by urine (7.2%), APOB (6.53%), bile (4.54%) and liver (4.34%) (Supplementary Figure 2). In addition, we found specific examples of miRNAs with different 5ʹ terminal start positions than their reported canonical forms, e.g. miR-142-5p (−2), miR-133a-3p (+ 1) and miR-192-5p (+ 1), and these patterns were consistent across all sample types (). Most interestingly, we found evidence that some miRNAs may be partitioned to cellular and extracellular pools by their isomiR forms, as lipoproteins and biofluids contained significantly more 5ʹ (−1) isomiRs of miR-101a-3p than liver samples (). Mature miRNAs also harbour extensive variability on their 3ʹ terminal ends due to imprecise processing and NTAs, e.g. extra non-genomic 3ʹ nts added by cytoplasmic nucleotidyltransferases [Citation27,Citation28]. A substantial fraction of miRNAs (17–32%) across all sample types were modified with NTAs (Supplementary Figure 2). As a percentage of total miRNAs, APOB particles contained significantly more miRNAs harbouring NTAs than liver samples (Supplementary Figure 2). A previous study proposed that poly-uridylation (NTA-U) was increased on extracellular miRNAs (released in exosomes) and miRNA poly-adenylation (NTA-A) was associated with cellular retention [Citation29]. To determine if lipoproteins and/or biofluids are similarly enriched for poly-uridylation, NTA patterns were compared between groups, and similar to exosomes, HDL and APOB samples were indeed observed to be significantly enriched with NTA-U compared to liver samples which were enriched with NTA-A (). Intriguingly, extracellular miRNAs in bile and urine from WT mice were not enriched for either NTA; however, in urine, loss of SR-BI (KO mice) was found to significantly increase the NTA-U/A ratio (). Collectively, these results demonstrate that miRNAs on lipoproteins are distinct for many features from hepatic miRNAs, including 5ʹ isomiRs and 3ʹ NTAs.
Fragmentation of non-miRNA small RNAs distinguish lipoproteins, biofluids and tissue
Although miRNA were well detected by sRNA-seq and validated by real-time PCR, we were struck by the observation that miRNA explained less than 5% of quality sequencing depth of lipoproteins and only ~15% of liver sequencing depth (). Most, if not all, non-coding RNAs are processed to smaller fragments creating an enormously diverse pool of sRNAs in cells and extracellular fluids [Citation3]. To determine whether non-miRNA sRNAs accounted for the remaining sequencing depth, reads were aligned to the host (mouse) genome, as well as to mature transcripts for specific RNA classes with genes containing introns, e.g. tRNAs and rRNAs [Citation30]. For liver samples, the most abundant class of sRNAs was rDRs, which were predominantly 42–45 nts in length (). rDRs were also present on HDL and APOB particles; however, their lengths were variable (). We also detected snoDRs (57–64 nts in length) in livers; however, snoDRs were largely absent from lipoproteins and biofluids, suggesting that the liver and other tissues may not export this class of sRNAs to lipoproteins or into bile or urine (). Both lipoproteins and biofluids contained tDRs 28–36 nts in length which suggests that these sRNA are likely tRNA-derived halves, a sub-class of tDRs approximately 31–35 nts in length ()42, 47. Most tDRs on lipoproteins and in biofluids aligned to the 5ʹ halves of parent tRNAs, particularly amino acid anticodons for glutamate (GluCTC), glycine (GlyGCC), aspartate (AspGTC) and valine (ValCAC) (, Supplementary Figure 3). Strikingly, 68.9% of tDR reads on HDL and APOB particles from WT mice aligned to the parent tRNA GluCTC (, Supplementary Figure 4). A key feature of the TIGER pipeline is the ability to analyse sRNAs based on their parent RNAs or individually as fragments. At the parent level for tDR signatures, all groups overlapped; however, at the fragment level, tDR signatures for lipoproteins, bile and urine were found to be clearly delineated from livers ()). These results were supported by PERMANOVA analysis which indicated that lipoprotein and biofluids were significantly distinct from liver based on tDR fragments: APOB (F = 5.32, p = 0.001), HDL (F = 2.94, p = 0.014), bile (F = 10.22, p = 0.001) and urine (F = 7.08, p = 0.001) (Supplementary Table 2). Hierarchical clustering and correlation analyses further support that the profile of individual fragments, rather than parent tRNAs, define tDR expression across sample types (Supplementary Figure 5). Strikingly, this pattern where groups are defined by organizing sRNAs based on individual fragments instead of parent RNAs was consistent for other host sRNAs, including rDRs and snDRs (Supplementary Figures 5, 6, Supplementary Table 2). The overlap of the tDR parent dispersion, and other parent RNA, is likely due to the consistency of contributing parent species; e.g. tDRs are generally products of tRNAs Glu, Gly and Lys. For tDR fragments, each parent tRNA can be processed to many different fragments, and thus, unique patterns for each sample are formed which define each sample type. This could be evidence of tissue-specific or extracellular environment-specific RNAses that could produce distinct types of tDR fragments. Furthermore, RNA modifications, RNA-binding proteins, scaffolding or cellular trafficking proteins could also influence parent tRNA processing to yield distinct sets of tDR fragments for different tissues. In either case, we hypothesize that extracellular tDRs on lipoproteins originate from multiple tissues, which results in the low correlations at the fragment level. On the contrary, the high correlation of liver tDRs at the fragment level supports an underlying biological mechanism that influences the processing of parent tRNAs and the patterning of tDR fragments.
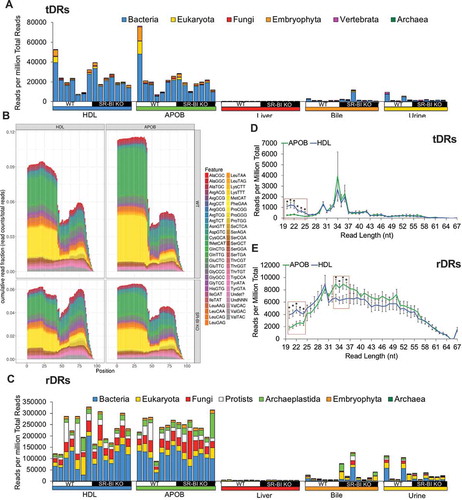
Figure 3. The non-miRNA, host sRNAs landscape distinguishes lipoproteins, biofluids and tissue. WT: wild-type mice; SR-BI KO: Scavenger receptor BI Knockout mice (Scarb1−/-). (a–f) Results from sRNA-seq analysis. HDL WT, N = 7; HDL SR-BI KO N = 7; APOB WT, N = 7, APOB SR-BI KO N = 7; Liver WT, N = 7; Liver SR-BI KO, N = 7; Bile WT, N = 7; Bile SR-BI KO, N = 6; Urine WT, N = 5; Urine SR-BI KO, N = 6. Host tDRs (yellow), rDRs (red), miRNAs (blue), snoDRs (purple), snDRs (green), other small (os)RNA (pink) and unannotated genome (black). (a) Alignment summary of endogenous sRNA classes relative to total reads. Mean ± S.E.M. (b-f) Distribution of read lengths for host sRNA classes (colours) displayed upon the distribution of total reads (grey), as reported by reads per million total reads. Mean ± S.E.M. (b) Liver. (c) APOB. (d) HDL. (e) Bile. (f) Urine.
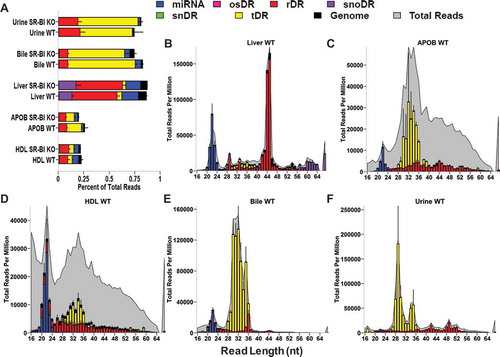
Figure 4. Fragment analysis of tRNA-derived sRNAs provides resolution between sample types with similar tRNA composition. WT: wild-type mice; SR-BI KO: Scavenger receptor BI Knockout mice (Scarb1−/-). (a–c, f) Results from sRNA-seq analysis. (a) Positional coverage maps of tDRs for parent tRNA amino acid anti-codons, as reported as mean cumulative read fractions (read counts/total counts). (b–c) Principal Coordinate Analysis (PCoA) of tDR profiles based on (b) parent tRNAs and (c) individual tDR fragments for samples from WT (white circles) and SR-BI KO (black circles) mice. NMDS: non-metric multidimensional scaling. (d–f) Real-time PCR analysis of candidate tDRs with predicted folding structures and sequences for (d) tDR-GluCTC and (e) tDR-GlyGCC. WT: white circles; SR-BI KO: red circles. Note: Buffer sample corresponds with total RNA extracted from SEC buffer used to isolate lipoproteins. (f) Heatmaps of correlation coefficients (Spearman, R) for tRNA parents and individual tDR fragments across samples within each group. HDL WT, N = 7; HDL SR-BI KO N = 7; APOB WT, N = 7, APOB SR-BI KO N = 7; Liver WT, N = 7; Liver SR-BI KO, N = 7; Bile WT, N = 7; Bile SR-BI KO, N = 6; Urine WT, N = 5; Urine SR-BI KO, N = 6.
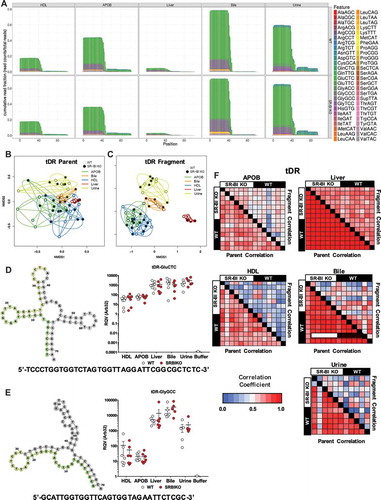
To validate candidate host sRNAs on lipoproteins and in biofluids identified by sRNA-seq, real-time PCR using custom locked-nucleic acid (LNA)-based assays (Exiqon) were completed. For tDRs, both tDR-GluCTC (38 nts in length) and tDR-GlyGCC (32 nts in length) were confirmed to be highly abundant on HDL and APOB particles, and were not detected in the negative control (buffer) solution used to isolate the lipoproteins (). Furthermore, two novel snDRs and a candidate sRNA cleaved from a ribozyme (miscRNA) were also detected by PCR on lipoproteins at comparable levels to a previously reported miRNA on lipoproteins (miR-223-3p) (Supplementary Figure 7). Although the general, regional cleavage patterns for specific parent RNAs were consistent for tRNAs (Supplementary Figure 3) and snRNAs (Supplementary Figure 8), and specific candidate sRNAs can be quantified by PCR as single products (based on melting curves), most individual fragments were variable across samples due to slight differences in length or sequences. To more clearly illustrate this point, we performed correlations at both the parent RNA and individual fragment levels within each sRNA class. For tDRs () and other RNA classes (Supplementary Figure 9), we found high correlation between samples at the parent level and poor correlation between samples at the fragment level for HDL, APOB, bile and urine. For liver samples, high correlation was detected for sRNAs at both the parent and fragment levels (, Supplementary Figure 9). These results suggest that, although individual fragments define sRNA classes across groups, further investigation of individual candidate sRNAs (fragments) may be challenging due to variability across samples.
Lipoproteins are enriched in exogenous sRNAs
The most striking difference between sRNA of lipoproteins and other sample types is the abundance of reads that failed to align to the host genome (). Reads aligning to non-human transcripts have previously been detected in human plasma samples [Citation8]; however, it is unknown which carriers transport non-host sRNAs in host circulation. To determine if lipoproteins carry exogenous sRNAs, reads > 20 nts in length that failed to map to the host (mouse) genome were aligned in parallel to (A) Annotated non-host transcripts curated in GtRNAdb (tRNA), SILVA (rRNA) and miRBase (miRNA) databases, and (B) Genomes of bacteria and fungi of the microbiome (HMB) or environment (ENV) (). To identify exogenous miRNAs (xenomiRs), reads were aligned (perfect match only) to non-host mature miRNA sequences (miRBase.org); however, only a few xenomiRs were detected within our datasets and overall contributions to each profile were minimal: total mean 16.0 rpm APOB, 48.2 rpm bile, 15.0 rpm HDL, 0.8 rpm liver and 2.6 rpm urine; Supplementary Table 3). To determine the levels of exogenous tDRs on lipoproteins, non-host reads were aligned to parent tRNAs curated in the GtRNAdb library. Both HDL and APOB particles were found to transport a diverse set of exogenous tDRs across multiple kingdoms, which accounted for approximately 2.5% of sRNAs (total reads) circulating on each lipoprotein class (, Supplementary Table 4). Bacterial tDRs were the most represented taxon, and the most abundant bacterial species were Pseudomonas fluorescens, Pseudomonas aeruginosa and Acinetobacter baumanni (Supplementary Figure 10). The parent tRNAs (based on amino acid anticodons) with the highest normalized read counts were fMetCAT, GluTTC, AspGTG and AsnGTT (Supplementary Figure 10). In contrast to host tDRs that predominantly aligned to the 5ʹ halves of parent tRNAs (, Supplementary Figure 3), positional coverage analysis demonstrated that bacterial tDRs aligned across the entirety of tRNA transcripts (, Supplementary Figures 12, 13). To identify exogenous rDRs on lipoproteins, non-host reads were separately aligned to known rRNA transcripts curated in the SILVA database, and remarkably, non-host rDRs accounted for approximately 25% of total reads in each of the HDL and APOB datasets (, Supplementary Figure 12). Although rDRs from every taxonomical kingdom were present on lipoproteins, bacterial rDRs were the most abundant (, Supplementary Figure 13, Supplementary Table 5). The overall content of non-host sRNAs on HDL and APOB particles were similar; however, HDL were found to be enriched for shorter length non-host tDRs and rDRs compared to APOB particles (). Collectively, these results suggest that lipoproteins transport exogenous tDR and rDRs, most of which are likely bacterial in origin.
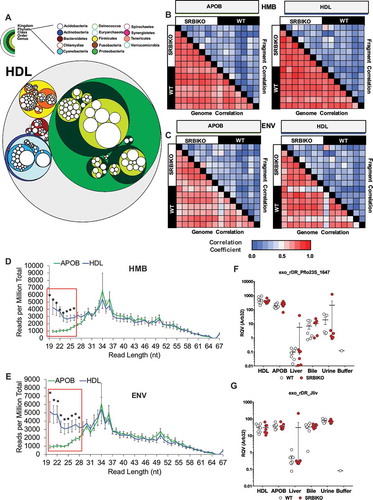
Figure 5. Lipoproteins are enriched for exogenous non-host tDRs and rDRs. WT: wild-type mice; SR-BI KO: Scavenger receptor BI Knockout mice (Scarb1−/-). (a) Stacked bar plots of non-host tDRs aligned to parent tRNAs across kingdoms and higher organizations – bacteria, blue; eukaryota, yellow; fungi, red; embryophyta, orange; vertebrata, purple; archaea, green – as reported as reads per million total reads. (b) Positional coverage maps of non-host tDRs for parent tRNA amino acid anti-codons, as reported as mean cumulative read fractions (read counts/total counts) for HDL and APOB particles. (c) Stacked bar plots of non-host rDRs aligned to parent rRNAs across kingdoms and higher organizations – bacteria, yellow; eukaryota, red; fungi, white; protists, purple; archaeplastida, dark blue; embryophyta, light blue; archaea, green – as reported as reads per million total reads. (d–e) Distribution of read lengths, as reported reads per million total reads, for all non-host (d) tDRs and (e) rDRs. Two-tailed Student’s t-tests. *p < 0.05. HDL WT, N = 7; HDL SR-BI KO N = 7; APOB WT, N = 7, APOB SR-BI KO N = 7; Liver WT, N = 7; Liver SR-BI KO, N = 7; Bile WT, N = 7; Bile SR-BI KO, N = 6; Urine WT, N = 5; Urine SR-BI KO, N = 6.
Aligning reads to transcripts in databases is biased in that only known (annotated) RNAs are queried, and thus, limits the power of discovery in sRNA-seq datasets. To comprehensively analyse exogenous sRNAs, non-host reads were also aligned to bacterial genomes within the NIH HMB Project (hmpdacc.org). The HMB database currently holds 3055 genomes, many of which are closely related; therefore, to address potential multimapping issues, we collapsed these species into 206 representative genomes that spanned 11 phyla and accounted for every genera within the HMB. Alignment of non-host reads to HMB genomes identified many bacterial sRNAs on lipoproteins and in biofluids, reported as summarized genome read counts per million total reads (RPM) (Supplementary Figure 14, Supplementary Table 6). To perform taxonomical analyses of lipoprotein-associated bacterial sRNAs, circular tree maps were generated. As shown by concentric rings in the tree maps, the vast majority of both HDL and APOB bacterial reads mapped to the Proteobacteria phylum (green), followed by the Actinobacteria (blue) and Firmicutes (yellow) phylums (, Supplementary Figure 15). Within the Proteobacteria phylum, the majority of reads aligned to the Gammaproteobacteria class, particularly the orders of Pseudomonadales and Enterobacteriales. Among individual genera (inner-most circles), counts for the genus Pseudomonas (Proteobacteria phylum) were consistently high, as were Micrococcus (Actinobacteria phylum) (, Supplementary Figure 15).
Figure 6. Exogenous sRNAs on lipoproteins are predominantly derived from Proteobacteria in the microbiome and environment. WT: wild-type mice; SR-BI KO: Scavenger receptor BI Knockout mice (Scarb1−/-). (a) Circular tree maps for non-host bacterial sRNAs on HDL from WT mice, as organized by taxonomy. Diameter is proportional to the mean number of reads at the genome level (counts). (b–c) Heatmaps of correlation coefficients (Spearman, R) for non-host sRNAs (on HDL and APOB particles) for bacterial genomes and individual bacterial fragments across samples grouped by (b) human microbiome (HMB) and (c) environment (ENV) species. (d–e) Distribution of read lengths, as reported as percent of total reads, for non-host bacterial sRNAs grouped by (d) HMB and (e) ENV species. Two-tailed Student’s t-tests. *p < 0.05. (f–g) Real-time PCR analysis of candidate non-host bacterial sRNAs for (f) exogenous rDR Pseudomonas fluorescens 23S (exo_rDR_Pflo23S) and (g) exogenous rDR Janthinobacterium lividum 23S (exo_rDR_Jliv). Note: Buffer sample corresponds with total RNA extracted from SEC buffer used to isolate lipoproteins. WT: white circles; SR-BI KO: red circles. HDL WT, N = 7; HDL SR-BI KO N = 7; APOB WT, N = 7, APOB SR-BI KO N = 7; Liver WT, N = 7; Liver SR-BI KO, N = 7; Bile WT, N = 7; Bile SR-BI KO, N = 6; Urine WT, N = 5; Urine SR-BI KO, N = 6.
Most interestingly, many reads that aligned to bacterial rRNA transcripts failed to align to the HMB genomes, thus suggesting that some sRNAs may originate from bacteria not presently curated in the HMB database. Using BLASTn (NCBI), many highly abundant reads were perfect matches to bacterial genomes of environmental bacterial species of soil and water, but could be associated with opportunistic infections. Therefore, to increase our non-host coverage, 167 additional bacterial genomes representing non-redundant genera of 8 taxonomical phyla were added, termed here as environmental bacteria (ENV). The ENV species with the highest normalized genome counts for WT lipoproteins were Pseudomonas fluorescens, Pseudomonas putida, Propionibacterium acnes and Stenotrophomonas maltophilia (Supplementary Figure 14,15, Supplementary Table 7). Although many non-host reads aligned to both HMB and ENV genomes, a majority of all non-host bacterial reads could be assigned exclusively to only one database, suggesting a complex origin for bacterial sRNAs on circulating lipoproteins (Supplementary Figure 16). In addition to bacterial sRNAs, we also identified fungal sRNAs on lipoproteins, and the highest normalized genome counts for fungal species on WT HDL were Fusarium oxysporum, Histoplasma capsulatum, Cryptococcus neoformans (Supplementary Figure 17, Supplementary Table 8).
We reasoned that reads aligned to non-host sources could be host sRNAs that were misidentified due to stringent host mapping criteria. To this end, we compiled all reads that mapped to any segment of the non-host modules and performed alignment to the host genome with 0, 1 or 2 mismatches, similar to the methods described by Wang et al. [Citation8]. Our results demonstrate that relatively few non-host sRNAs were able to re-align to the host genome with 1 or 2 mismatches (on average <10% for lipoproteins; Supplementary Figure 18). Thus, we conclude that high-stringency of host and non-host sRNA alignment is necessary for confident identification and categorization.
To assess bacterial sRNA profiles across samples, non-host sRNAs (HMB and ENV) on lipoproteins were correlated between samples. For both databases, we identified high correlations between samples at the genome level and low correlations at the fragment level (). These data suggest that similar bacteria are contributing sRNAs to circulating lipoproteins across all mice. Nevertheless, these bacteria may contribute different sRNAs (sequences) to HDL and APOB particles in different mice or the processing of bacterial sRNAs before and/or during HDL and APOB trafficking is differentially regulated. A key difference between HDL and APOB bacterial sRNAs was length, as HDL were enriched for shorter sRNAs than APOB particles; this pattern was evident for both HMB and ENV sRNAs (). A similar trend was observed for reads mapping to fungal genomes (Supplementary Figure 19). To determine if HDL and APOB particles transport different exogenous (non-host) sRNA signatures, PCoA and PERMANOVA analyses were completed. At the genome level, the HDL and APOB particles were indistinguishable for HMB and ENV bacteria (Supplementary Figure 20); however, HDL and APOB profiles clustered separately at the fragment level and HDL and APOB profiles were distinct (F = 1.7, p = 0.048) for ENV bacterial sRNAs by PERMANOVA (Supplementary Figure 20, Supplementary Table 9).
The lack of strong correlation at the fragment level for non-host sRNAs is likely due to differences in read lengths and sequences (e.g. terminal nts) for similar reads due to imprecise processing of parent RNAs, and thus variable read counts across samples. These observations present unique challenges to study individual sRNAs for biological function; however, many candidate sRNAs do exist within the very large pool of non-host reads. Using real-time PCR, we quantified candidate bacterial sRNAs on lipoproteins and confirmed that HDL and APOB particles transport a 22 nt rDR (5ʹ-AGAGAACUCGGGUGAAGGAACU-3ʹ) likely from bacteria of the Proteobacteria phylum (, Supplementary Figure 21). Likewise, HDL and APOB were also found to transport another rDR of the Proteobacteria phylum, likely from the order of Burkholderiales (33 nts, 5ʹ-GACCAGGACGUUGAUAGGCUGGGUGUGGAAGUG-3ʹ) (, Supplementary Figure 22). In addition to bacterial sRNAs, real-time PCR was also used to confirm that lipoproteins transport a fungal rDR from the Verticillium genus (21 nts 5ʹ-UGGGUGUGACGGGGAAGCAGG-3ʹ) (Supplementary Figure 23). Crucially, we also performed RNA isolation from buffer used to separate lipoproteins in SEC and performed real-time PCR as well as used non-template controls. For most probes, no template controls resulted in no amplification, whereas buffer controls showed expression that was often lower than reliable limits of quantification. In either case, lipoprotein and biofluid PCR amplification was often orders of magnitude above these controls. These results suggest that HDL and APOB transport non-host sRNAs derived from bacterial and fungal sources in the microbiome and environment. Bile and urine samples also contained non-host sRNAs, albeit a lesser fraction of total reads. Collectively, these observations support the need to include non-host sRNAs in the analysis of sRNA-seq data.
Lipoproteins, tissues and biofluids can be defined by their most abundant sRNAs
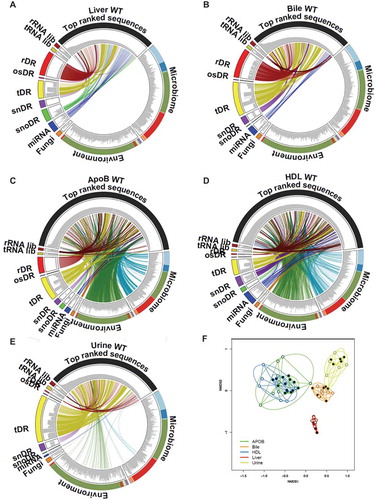
To determine which RNA class and species contribute to the most abundant sRNAs in each sample type, the top 100 ranked reads for each sample were filtered and redundant reads were removed for each group. For liver and bile samples, the top ranked reads were predominantly host sRNAs (). On the contrary, the top most abundant reads on lipoproteins were composed of both host and non-host sRNAs (). The top ranked reads in urine samples were found to be largely host sRNAs (e.g. tDRs); however, many links to exogenous bacterial sRNAs were identified (). Although our host and non-host analyses were thorough, many of the top ranked sequences remained unidentified. Therefore, we sought to further analyse sRNA profiles using a class-independent strategy, in which we focused on only the most abundant reads for each group. To assess the similarity of profiles between groups for the top ranked sRNAs, hierarchical clustering and correlations were performed, and lipoproteins displayed modest correlations with other groups and clustered separately from livers, bile and urine (Supplementary Figure 24). These observations were confirmed by PCoA, as lipoprotein samples overlapped and clustered together, separately from bile, urine and liver samples (). PERMANOVA analysis found that every group was significantly distinct from each other based on the most abundant sRNAs (Supplementary Table 10). These results suggest that each sample type can be defined by their most abundant sRNAs independent of parent RNA class or contributing host or non-host species which is highly appropriate for the study of heterogeneous pools of exRNAs.
Figure 7. Class-independent analysis defines sRNA content across lipoproteins, biofluids and tissues. (a–e) Circos plots linking the most abundant (top 100) sequences to assigned groups for non-host libraries (rRNA lib, tRNA lib), host sRNAs (rDR, osRNA, tDRs, snDRs, snoDRs and miRNAs) and non-host genomes (fungi, environment, and microbiome) for (a) liver, (b) bile, (c) APOB, (d) HDL and (e) urine. (f) Principal Coordinate Analysis (PCoA) of sRNA profiles based on class-independent analyses. Wild-type mice, WT (open circles); Scavenger receptor BI Knockout mice (Scarb1−/-), SR-BI KO (filled circles). HDL WT, N = 7; HDL SR-BI KO N = 7; APOB WT, N = 7, APOB SR-BI KO N = 7; Liver WT, N = 7; Liver SR-BI KO, N = 7; Bile WT, N = 7; Bile SR-BI KO, N = 6; Urine WT, N = 5; Urine SR-BI KO, N = 6.
Advances in sRNA-seq analysis
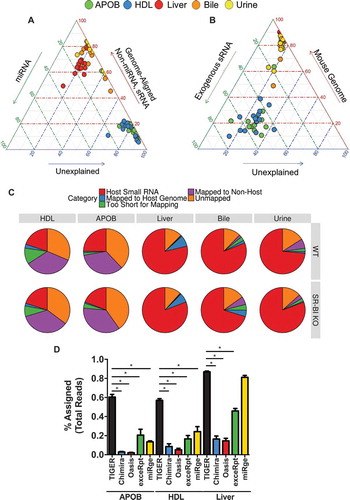
To compare the TIGER pipeline to other sRNA-seq analysis software, APOB, HDL and liver samples from WT mice were analysed by Chimira [Citation2], Oasis [Citation7], ExceRpt [Citation31] and miRge [Citation6] software (Supplementary Table 11). Although the pipelines are designed for different outputs, each can quantify host miRNAs for which we used to compare analyses, and we found that all the pipelines were comparable in their ability to quantify host canonical miRNAs for different sample types and the pipelines were highly correlated for miRNAs (Supplementary Figure 25). Most available software for sRNA-seq data analysis are restricted to miRNAs or endogenous (host) sRNAs, including Chimira, Oasis and miRge (Supplementary Table 11). This approach may be suitable for liver samples (red circles), as demonstrated by ternary plots, but HDL (blue circles) and APOB (green circles) samples remain largely unexplained (). Incorporation of both endogenous and exogenous sRNAs, a key feature of the TIGER pipeline, is essential to studying lipoprotein sRNAs as this strategy accounts for substantially more reads in the datasets, as depicted by the left shifts of blue and green circles in the ternary plots (, Supplementary Table 12). A key metric for comparing pipelines is the amount of (useable) information extracted from the data by the software, i.e. the percent of assigned quality reads. Remarkably, the TIGER pipeline accounted for 87.95% bile, 87.9% of liver, 85.3% urine, 71.5% HDL and 62.2% APOB reads in WT mice (, Supplementary Table 13). In comparison to other pipelines, the TIGER pipeline accounted for significantly more reads in lipoprotein datasets and significantly more reads than Chimira, Oasis and ExceRpt for liver datasets which are largely host sRNAs (). After the TIGER pipeline performs the non-host read analyses, the top ranked most abundant sequences of the unexplained reads that remain were searched using BLASTn (). Collectively, the TIGER pipeline provides an opportunity to analyse sRNA-seq with increased depth and detail which is particularly suited for analysis of exRNA and sRNAs on lipoproteins.
Figure 8. TIGER analysis pipeline identifies more sequencing depth than other software. (a–b) Ternary plots of sRNA profiles for all samples displayed as (a) percent unexplained (blue axis), miRNAs (green axis) and non-miRNA host sRNAs (red axis); (b) percent unexplained (blue axis), exogenous sRNAs (green axis) and host genome (red axis). WT: wild-type mice; SR-BI KO: Scavenger receptor BI Knockout mice (Scarb1−/-). (c) Pie charts illustrating the mean fraction of reads assigned to host sRNA (red), host genome (blue), non-host (purple), too short for exogenous mapping (green) and unmapped (orange). HDL WT, N = 7; HDL SR-BI KO N = 7; APOB WT, N = 7, APOB SR-BI KO N = 7; Liver WT, N = 7; Liver SR-BI KO, N = 7; Bile WT, N = 7; Bile SR-BI KO, N = 6; Urine WT, N = 5; Urine SR-BI KO, N = 6. (d) Comparisons of sRNA-seq data analysis pipelines, as reported as percent assigned per total reads for TIGER (black), Chimira (blue), Oasis (red), ExceRpt (green), and miRge (yellow) for HDL, APOB, and liver samples from WT mice. HDL WT, N = 7; APOB WT, N = 7, Liver WT, N = 7. Mann–Whitney non-parametric tests. *p < 0.05.
Next, we sought to compare the output of TIGER with that of the recently published sRNAnalyzer pipeline, which also considers extensive non-host alignments. First, we analysed a series of sRNA-seq libraries featured in the analysis by Wu et al. [Citation32], in which sRNA-seq was performed on E.coli cell lysates, E.coli-derived extracellular outer membrane vesicles (OMV) and various controls (original experimentation described by Ghosal et al. [Citation33]. For this analysis, we configured TIGER to consider E coli strain K-12 as the host genome, as the sample was cultured under control conditions in the laboratory. Overall, we identified very similar results to that of sRNAnalyzer with nearly 94% of reads obtained from cell lysates correctly identified as E.coli (Supplementary Figure 26). Equally impressive, we observed less than 0.01% of nearly 15 and 22 million reads obtained from cell-free uncultured and cultured media mapping to E.coli. Most interestingly, we obtained highly similar results for sRNA-seq of OMV, where less than 2% of sRNA-seq reads were identified as E.coli and the overall profile was rich in fungi, especially S. cerevisiae, highly similar to media controls (Supplementary Figure 26). However, unlike sRNAnalyzer, we did not observe substantial mapping beyond fungi (i.e. mammals/vertebrates), potentially due to more stringent mapping criteria for exogenous sRNA. We also compared the output of TIGER with that of sRNAnalyzer for sRNA-seq of human plasma (originally described in Wang et al. [Citation8]). Here, results of TIGER drastically differed as on average only 4% of reads were assigned as human, relative to nearly 65% of reads identified as human by sRNAnalyzer (Supplementary Figure 27A). Even when considering only mapped reads by TIGER (i.e. host and non-host) only 12% of reads could be reliably detected as human (Supplementary Figure 27B). This is likely the influence of rRNA and tRNA filtering performed by the sRNAnalyzer pipeline, a key difference between these pipelines. Furthermore, TIGER detected substantially more reads aligned to fungi (genome, tRNA and rRNA modules; Supplementary Figure 27C,D). Most interestingly, fungal genome alignment with TIGER identified the majority of these reads to be linked to F. oxysporum, a common soil fungus not typically associated with human disease (Supplementary Figure 27E). Of note, F. oxysporum is also the most abundant fungal species detected on mouse lipoproteins. Furthermore, TIGER identified a unique bacterial composition from the HMB genome alignment module in which Firmicutes was the most abundant phyla in all samples (Supplementary Figure 27F). In contrast, the original description of these samples reported that Proteobacteria and Bacteroidetes were the more abundant phyla [Citation8]. Meanwhile, the ENV module identified almost exclusively Proteobacteria (Supplementary Figure 27G). When comparing HMB and ENV modules, it is revealed that the vast majority of bacterial sRNA reads were unique to the ENV module (Supplementary Figure 27H). Most importantly, similar patterns were observed for mouse lipoproteins.
Differential expression analysis of endogenous and exogenous sRNA fragments identifies an influence of SR-BI to lipoprotein and bile sRNA pools
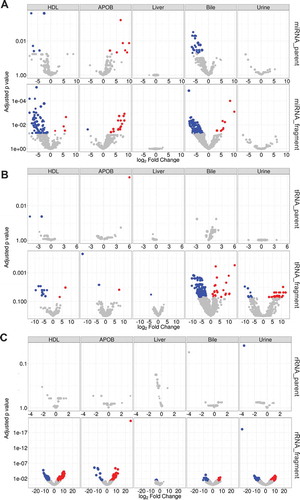
SR-BI is highly-expressed in the liver and plays a fundamental role in reverse cholesterol transport mediating selective uptake of cholesteryl esters and promoting biliary cholesterol secretion [Citation34–Citation36]. Loss-of-function variants in human SCARB1 (SR-BI) were associated with increased in circulating HDL-C levels [Citation37]. Likewise, Scarb1 mutations in mice also resulted in increased HDL-C levels [Citation38]. We have previously reported that HDL-delivery of miRNAs to hepatocytes in vitro requires SR-BI [Citation13]. Based on these observations, we hypothesized that SR-BI may regulate sRNA levels on lipoproteins as well as miRNAs in liver and bile. To quantify the impact of SRBI-deficiency on exRNAs in vivo, host sRNAs were compared at both the parent and fragment levels. For parent miRNA, loss of SR-BI in mice did not alter total miRNA content in liver, urine, bile, HDL or APOB particles. Yet, we did observe that many parent miRNAs were altered and were primarily decreased in HDL and bile of SR-BI KO mice (a), Supplementary Table 14). Strikingly, miRNA NTAs were found to be significantly increased in urine of SR-BI KO mice (p < 0.001) relative to WT mice (Supplementary Figure 2). Moreover, we found a significant (p = 0.0021) change in NTA-A/U ratios in urine from SR-BI KO mice compared to WT mice, as urine samples from WT mice were enriched for adenylated miRNAs (NTA-A) and samples from SRBI KO mice were enriched for uridylated miRNAs (NTA-U) (). We also identified a limited number of significantly altered non-miRNA host sRNAs at the parent level in SR-BI KO mice compared to WT mice (, Supplementary Table 14, Supplementary Figure 28). We reasoned that the impact of SR-BI-deficiency may be more apparent at the fragment level than the parent level, as we previously observed this perspective to provide more resolution between sample types. Therefore, we performed differential expression analysis at the fragment level within each host sRNA class (, Supplementary Figure 28). Most interestingly, this approach increased the number of significantly altered miRNAs for HDL and bile, even after correction for multiple comparisons (, Supplementary Table 15). However, the most striking results were observed for biliary tDRs, which had no changes at the parent level, but had 159 unique tDR fragments significantly altered in SR-BI KO mice, most of which were down regulated. Conversely, we found 73 snDR fragments that were significantly increased on HDL (Supplementary Table 15). In livers from SR-BI KO mice, we found 16 rDRs that were significantly decreased at the fragment level, although only one of these sequences were found to be altered in another sample type (Urine; , Supplementary Table 15). These results suggest that SR-BI is not essential for HDL-sRNA export or clearance and likely has a limited role in shaping the sRNA profile of lipoproteins. Yet, it does appear that SR-BI deficiency subtly influences the biliary and HDL-sRNA profiles, the biological significance of which remains unresolved. Nevertheless, these results strongly support the need to analyse host sRNAs not just at the parent level, but also the fragment level, as potentially critical observations may be lost in the grouping of similar sequences for parent analysis.
Figure 9. Differential expression analysis at the fragment level identifies differences between SR-BI KO and wild-type mice. Differential expression analysis by DEseq2. Volcano plots demonstrating significant (adjusted p > 0.05) differential (>1.5-absolute fold change) abundances for (a) miRNAs, (b) tDRs and (c) rDRs at the parent and individual fragment levels – red, increased; blue, decreased. HDL WT, N = 7; HDL SR-BI KO N = 7; APOB WT, N = 7, APOB SR-BI KO N = 7; Liver WT, N = 7; Liver SR-BI KO, N = 7; Bile WT, N = 7; Bile SR-BI KO, N = 6; Urine WT, N = 5; Urine SR-BI KO, N = 6.
Although bacteria may regulate SR-BI expression [Citation39], SR-BI regulation of the gut microbiome is unclear, and the role of SR-BI in regulating circulating non-host bacterial sRNAs on lipoproteins is completely unknown. To determine if SR-BI contributes to exogenous sRNAs on lipoproteins and in biofluids, differential expression analysis was performed at both the genome and fragment levels. Only one bacterial species was found to be significantly altered between SR-BI KO and WT mice; decreased Streptomyces (HMB module) in urine, as determined by genome counts (Supplementary Figure 29. Remarkably though, 94 bacterial sRNAs identified in the HMB module were significantly altered by SR-BI-deficiency after correcting for the false-discovery rate; 21 among APOB particles and 73 among HDL particles (Supplementary Figure 29, Supplementary Table 16). Likewise, 126 bacterial sRNA were identified in the ENV module; 38 among APOB particles and 84 among HDL particles, many of which were unique to the ENV module. Similarly, 103 fungal sRNA were identified as being differentially abundant between wild-type and SR-BI knockout mice lipoproteins (Supplementary Figure 29). These results suggest that SR-BI may have a modest role in regulating non-host bacterial and fungal sRNAs on lipoproteins. Lastly, to determine if SR-BI-deficiency in mice results in changes to the most abundant sequences in each group, independent of RNA class or genotype, differential expression analysis was performed for the top 100 reads filtered in the class-independent analysis. Many significant changes to the most abundant reads on lipoproteins and bile were observed in SR-BI KO mice compared to WT mice (Supplementary Figure 30, Supplementary Table 17).
Rigour and reproducibility
To meet expectations for rigour and reproducibility, we first assessed the possibility that plasma samples were contaminated with bacteria during blood isolation or storage. Although we perform rigorous steps to prevent bacterial growth (i.e. rapid sample processing and storage at −80C; NaN3), we reasoned that a small degree of contamination could influence our results. Therefore, we isolated total DNA from 30 µL of plasma input (n = 8) and performed real-time PCR for a highly conserved 16S rRNA sequence. As a positive control, we also performed PCR on 1 ng of E.coli DNA and serial 5-fold dilutions to an equivalent of 0.3 pg, and water as a negative control. Our results demonstrate that detection of bacterial DNA in plasma was very low and on par with that of water (Supplementary Figure 31). Based on a calculated standard curve, the amount of DNA input in plasma samples, or water, would be equivalent to 0.1–5 fg. Therefore, we believe that it is unlikely that bacterial sRNA detected by sRNA-seq and real-time PCR are due to contamination.
Next, we assessed whether lipoprotein enrichment for non-host sRNA was exclusive to mice by isolating human lipoproteins from 500 μL of plasma input via the same SEC-methods. For these experiments, we isolated new RNA from SEC buffer and included a new control for the miRNeasy isolation column, as a recent study has shown that these columns can be a source of contaminant RNA. Of crucial importance, we spiked in low levels (30 fM) of an exogenous miRNA (Cel-miR-39) to RNA isolations after the Qiazol (Qiagen) step in which RNAses are inactivated. This concentration of spike-in was determined to be equivalent of approximately 55,000 copies per RNA isolation and was used as a quantitative comparison for miRNA levels typically observed on lipoproteins by qPCR. By way of standard curve for Cel-miR-39, we calculated RNA-extraction efficiency to be approximately 96%. Expression of hsa-miR-223 were near this target level RQV in human APOB and HDL samples, but not buffer and column controls (Supplementary Figure 32). Most interestingly, one human sample had expression of tDR-Gly-GCC in both APOB and HDL, whereas lipoproteins from the other individual did not exceed controls. When we assessed the expression of exogenous sRNAs, one bacterial sRNA (exo_rDR_Pflo23S) and one fungal sRNA (exo_rDR_Vsp) were expressed at equivalent levels to mouse lipoproteins, several orders of magnitude above buffer and column controls (Supplementary Figure 32). In contrast, the bacterial sRNA exo_rDR_Jliv, which was strongly expressed in mouse lipoproteins, bile and urine, did not exceed background levels for human lipoproteins (although it was nearly 10-fold more abundant than buffer and column controls; Supplementary Figure 32). Thus, we conclude that both mouse and human lipoproteins are enriched with exogenous sRNAs that are not the result of contamination.
Lastly, we asked whether bacterial sRNA were detectable in unfractionated plasma. For this, we isolated total RNA from 30 µL of mouse plasma (n = 10; matched to samples described above) or 50 uL of human plasma (n = 8; not matched to samples above) and performed real-time PCR for selected probes of host and non-host target sRNA. Intriguingly, we observed striking differences in the expression of host sRNAs miR-223-3p and tDR-Gly-GCC, which are fully conserved between mice and humans (Supplementary Figure 33). Most interestingly, these differences in expression were consistent with results of lipoprotein analysis described above. Expression of non-host sRNAs was also detected in these preparations at levels consistent with host sRNAs in human plasma (Supplementary Figure 33).
Discussion
High-throughput sequencing of sRNAs has revealed a complex landscape of various types of sRNAs in cells and extracellular fluids, many of which have not been studied. Currently, there is a great need for tools that can extract many types of sRNAs and their distinct features from sequencing datasets. Here, we used sRNA-seq and TIGER to profile most sRNA classes on HDL and APOB particles and compared these profiles to liver, bile and urine. Using this approach, we found that HDL and APOB particles transport a wide-variety of host sRNAs, including tDRs, rDRs, snDRs and many other miscRNAs. Moreover, we found that exRNAs on lipoproteins harboured unique features, such as, enrichment of poly-uridylation NTA events on miRNAs and discrete length distributions for HDL and APOB particles. Furthermore, lipoproteins were found to transport a multitude of non-host sRNAs likely derived from bacterial and fungal species of the microbiome and environment. Many of these non-host sRNAs were found to be likely processed from parent tRNAs and rRNAs. Using TIGER, we were also able to define each sample type by their most abundant sRNAs independent of class or species, which is particularly suited for the study of exRNA. Furthermore, the TIGER pipeline allows for the quantification and differential expression analysis of sRNAs at both the parent and fragment levels. This strategy enabled resolution between tissue, lipoproteins and biofluids, which would not have been feasible with other analysis strategies. This was most observable with tRNA/tDR (). We interpret these findings to indicate that mechanisms for parent sRNA release or secretion are highly conserved, but extracellular degradation/fragmentation is shaped locally by RNAses and trafficking proteins of the local environment. These strategies also allowed our determination that loss of SR-BI has a multitude of effects on sRNA expression in tissue and biofluids. We speculate that the effects observed at the fragment level between wild-type and SR-BI KO mice could be the influence of changes in lipoprotein homeostasis and the biliary and circulatory environment. Of note though, we observed broadly consistent sRNA levels between HDL of WT and SR-BI KO mice, suggesting that SR-BI may not be a critical regulator of HDL-sRNAs in vivo. Overall, this study demonstrates the power of expanding sRNA-seq analysis beyond canonical miRNAs and exploring the full breadth of host and non-host sRNAs in every dataset.
Although many researchers are using high-throughput sequencing to quantify sRNAs, many investigators do not take advantage of the enormous amount of information contained within sRNA-seq datasets. The mammalian transcriptome is immensely diverse and complex, and thus, requires new analytical tools and novel strategies to address the many distinct features of different sRNA classes and contributing species [Citation3,Citation4,Citation40]. TIGER is designed to incorporate both host and non-host sRNA analysis into a modular design that allows for custom prioritization and parallel alignments to both genomes and transcripts (libraries), and organizes data at the parent RNA, fragment and class-independent levels. The seven modules include pre-processing, host genome and database, non-host library, non-host genome, class-independent, summary and unmapped. For host miRNAs, we expanded miRNA analysis to include 5ʹ and 3ʹ terminal isomiRs and 3ʹ NTAs. Furthermore, we extended our analysis of annotated host sRNAs to include tDRs, rDRs, snDRs, snoDRs, lncDRs and many other less studied classes, e.g. yDRs. A key feature of TIGER is the alignment strategy for host tDRs and rDRs which includes mapping to the host genome and mature transcripts in corresponding databases, which overcomes challenges posed by introns [Citation30,Citation41]. Another key advance in our pipeline is the parallel analysis of host sRNAs at the parent and individual fragment levels. Organization of sRNAs at the parent level allows for categorical analysis and positional coverage alignments which provides information on parent RNA processing (cleavage). Conversely, analysis of sRNAs at the individual sequence (fragment) level aids biomarker discovery and is critical to determining biological functions. Collectively, these features represent a substantial advance for the analysis of endogenous host sRNAs across all types of samples.
A critical difference between cellular RNA and exRNA profiles is the presence of non-host sRNAs present in exRNA samples [Citation8,Citation42,Citation43]. ExRNAs hold great potential as disease biomarkers, indicators of specific cell phenotypes and damage, intercellular communication signals and drug targets for future therapies [Citation44–Citation46]. Current sRNA-seq analysis pipelines are not particularly suitable for the study of exRNAs as many are restricted to only canonical miRNAs, or a limited number of host sRNAs, and lack analysis of non-host sRNAs, which will likely be a major focus of future investigations. Based on a previous study reporting that bacterial sRNAs are present in human plasma, TIGER was designed to identify exogenous bacterial and fungal sRNAs. Strikingly, we found that the majority of sRNAs on HDL and APOB particles are likely from bacteria present in the microbiome and environment. Many of these non-host sRNAs are not likely contamination products due to several observations. First, non-host sRNA were detected in two different isolations of lipoproteins from different organisms, but were not detected in control samples in which RNA were isolated (or sequenced) from buffer used for lipoprotein isolation. Recently, it has also been reported that RNA isolation columns themselves can be a source of non-host sRNA [Citation47]. We also tested this possibility, and although we partially confirm their results, we demonstrated that non-host sRNA of lipoproteins are distinct from these contaminants. Moreover, reads aligning to bacterial and fungal genomes were not likely contamination of reagents used for sequencing preparation as most of these reads were not present in liver datasets. However, this is not to say that sequencing preparation does not introduce some artefacts that can be scored as quality reads. Next, we found very low correlation between lipoprotein samples for non-host bacterial and fungal sRNAs suggesting that there was not a common source of bacterial or fungal RNA in the preparation reagents. In addition, we found that bacterial and fungal sRNAs on HDL were enriched for short length sRNAs as compared to APOB particles, a pattern that was also observed for host sRNAs, thus supporting a common mechanism of loading or association for sRNAs that is different for HDL and APOB particles. Moreover, we found that non-host bacterial sRNA profiles were distinct for HDL and APOB at the fragment level, as demonstrated by PCoA and PERMANOVA. Collectively, these results strongly support that HDL and APOB particles transport distinct sets of non-host sRNAs that are biological in origin, and not solely due to bacterial and fungal contamination or foreign RNA in reagents or the research environment. It should be stressed that the biological function of these exogenous sRNA, and likewise, the reason for their enrichment on lipoproteins is the subject of further investigation.
The inclusion of non-host reads in our analysis greatly increased our ability to account for reads in lipoprotein datasets. A primary difference between TIGER and sRNAnalyzer, a separate pipeline by the Wang and Galas labs that considers non-host reads [Citation32], is how to handle exogenous rDR and tDR. As this group points out, the inherent short length of reads obtained from sRNA-seq and the highly conserved nature of rRNA and tRNA loci represents a significant challenge for confident alignment to host genomes. Thus, the approach by this group has been to filter out rDR and tDR reads and only consider sequences that map to other parts of non-host genomes. However, it is our experience that the vast majority of non-host reads on lipoproteins are derived from rDR and tDR. As such, we have chosen to include rDR and tDR with application of stringent alignment criteria (i.e. >19 nt in length and no mismatches) to increase our confidence. The reason for rDR and tDR bias among non-host reads of lipoproteins is unclear and is the focus of ongoing investigation. Nevertheless, there are many sRNAs that could be neither processed from annotated transcripts in databases nor originate from species currently represented in the HMB project. Therefore, another key feature of the TIGER pipeline is the ability to analyse data independent of species identification or library annotation. As such, class-independent analysis extracts more data and eliminates a potential barrier to the discovery of biomarkers and intercellular communication signals. Notably, class-independent analysis of exRNAs captures sRNA sequence, length and abundance which are the important defining characteristics of biomarkers in extracellular fluids and bioactivity in recipient cells. The TIGER pipeline also advances sRNA-seq analysis through the incorporation of high-end comparative analyses and data visualizations, including PCoA, PERMANOVA, hierarchical clustering and correlations, positional coverage maps, circular tree maps, circos linkage maps and ternary plots. The TIGER pipeline addresses many issues in sRNA-seq analysis; however, we have identified a few limitations to the software. Although the TIGER pipeline is designed to quantify 5ʹ and 3ʹ variants, it does not currently identify internal modifications, ADAR editing events or single nucleotide polymorphisms. This feature would aid in the study of tDRs, which are heavily modified, and would potentially improve analysis of non-host sRNAs where reference genomes may be lacking. The ability to quantify internal variance is a key feature of Chimira, as well as other software, including UEA workbench [Citation48] and MAGI [Citation49]. Furthermore, the TIGER pipeline does not include the analysis of PIWI-Interacting RNAs and a few other sRNAs, including promoter-associated sRNAs, which present unique challenges in alignments, quantification, and nomenclature [Citation50]. Future versions of the pipeline will include less studied sRNA classes and the ability to discover new host sRNAs, as the current pipeline does not have a feature to identify novel miRNAs based on adjacent genomic sequences which is an output of other pipelines [Citation51,Citation52]. Despite these limitations, the TIGER pipeline sets forth many improvements to sRNA-seq analysis.
In summary, the value of any sequencing data analysis pipeline, ultimately, is the ability to extract the most useable information from the generated data. Therefore, the goal of TIGER was to assess both host and non-host sRNAs, which greatly improved the ability to account for more reads in our sRNA-seq datasets, particularly exRNAs. TIGER also advances the field in its ability to analyse host sRNAs at the parent and fragment levels and non-host sRNAs at the genome and fragment levels. This approach may be critical to discovering novel biomarkers and intercellular communication signals that would be masked by analysing the sRNAs by their parent RNAs. Likewise, TIGER analyses sRNAs by class and species (genome) as well as class-independent approaches. This is very important for the study of exRNAs where the contributing parent RNA may not be annotated for the host genome, or the contributing (exogenous) species for highly abundant sRNAs may not be curated in microbiome databases. The TIGER pipeline is particularly suited for lipoprotein sRNAs which are predominantly rRNA-derived fragments of bacterial origin. Using TIGER, we were able to make critical observations comparing lipoprotein sRNAs to liver and biofluids that would not be observed by existing pipelines. Therefore, this tool is well-suited for the analysis of exRNA.
Availability
TIGER is an open source collaborative initiative available in the GitHub repository (https://github.com/shengqh/TIGER).
Accession numbers
The datasets generated and/or analysed in this study are available in the Gene Expression Omnibus (GEO) repository (www.ncbi.nlm.nih.gov/geo), study GSE109655.
Supplemental Material
Download Zip (14.1 MB)Acknowledgements
We would like to acknowledge Carolin Besenboeck for her assistance in RNA methods.
Disclosure statement
The authors report no conflict of interest.
Supplementary data
Supplementary data for this article can be accessed here
Additional information
Funding
Related Research Data
References
- Bartel DP. MicroRNAs: genomics, biogenesis, mechanism, and function. Cell. 2004;116:1–25.
- Vitsios DM, Enright AJ. Chimira: analysis of small RNA sequencing data and microRNA modifications. Bioinformatics. 2015;31:3365–3367.
- Vickers KC, Roteta LA, Hucheson-Dilks H, et al. Mining diverse small RNA species in the deep transcriptome. Trends Biochem Sci. 2015;40:4–7.
- Chen CJ, Heard E. Small RNAs derived from structural non-coding RNAs. Methods. 2013;63:76–84.
- Li Z, Ender C, Meister G, et al. Extensive terminal and asymmetric processing of small RNAs from rRNAs, snoRNAs, snRNAs, and tRNAs. Nucleic Acids Res. 2012;40:6787–6799.
- Baras AS, Mitchell CJ, Myers JR, et al. miRge - a multiplexed method of processing small RNA-seq data to determine microRNA entropy. PLoS One. 2015;10:e0143066.
- Capece V, Garcia Vizcaino JC, Vidal R, et al. Oasis: online analysis of small RNA deep sequencing data. Bioinformatics. 2015;31:2205–2207.
- Wang K, Li H, Yuan Y, et al. The complex exogenous RNA spectra in human plasma: an interface with human gut biota?. PLoS One. 2012;7:e51009.
- Beatty M, Guduric-Fuchs J, Brown E, et al. Small RNAs from plants, bacteria and fungi within the order Hypocreales are ubiquitous in human plasma. BMC Genomics. 2014;15:933.
- Quintana JF, Makepeace BL, Babayan SA, et al. Extracellular Onchocerca-derived small RNAs in host nodules and blood. Parasit Vectors. 2015;8:58.
- Boon RA, Vickers KC. Intercellular transport of microRNAs. Arterioscler Thromb Vasc Biol. 2013;33:186–192.
- Vickers KC, Remaley AT. Lipid-based carriers of microRNAs and intercellular communication. Curr Opin Lipidol. 2012;23:91–97.
- Vickers KC, Palmisano BT, Shoucri BM, et al. MicroRNAs are transported in plasma and delivered to recipient cells by high-density lipoproteins. Nat Cell Biol. 2011;13:423–433.
- Wang Y, Liu X, Pijut SS, et al. The combination of ezetimibe and ursodiol promotes fecal sterol excretion and reveals a G5G8-independent pathway for cholesterol elimination. J Lipid Res. 2015;56:810–820.
- Kogan SC, Doherty M, Gitschier J. An improved method for prenatal diagnosis of genetic diseases by analysis of amplified DNA sequences. Application to hemophilia A. N Engl J Med. 1987;317:985–990.
- Yan J, Herzog JW, Tsang K, et al. Gut microbiota induce IGF-1 and promote bone formation and growth. Proc Natl Acad Sci U S A. 2016;113:E7554–E7563.
- Martin M. Cutadapt removes adapter sequences from high-throughput sequencing reads. EMBnet.journal. 2011;17:10–12.
- Langmead B, Trapnell C, Pop M, et al. Ultrafast and memory-efficient alignment of short DNA sequences to the human genome. Genome Biol. 2009;10:R25.
- Hirakata S, Siomi MC. piRNA biogenesis in the germline: from transcription of piRNA genomic sources to piRNA maturation. Biochim Biophys Acta. 2016;1859:82–92.
- Love MI, Huber W, Anders S. Moderated estimation of fold change and dispersion for RNA-seq data with DESeq2. Genome Biol. 2014;15:550.
- Kaczor-Urbanowicz KE, Kim Y, Li F, et al. Novel approaches for bioinformatic analysis of salivary RNA sequencing data for development. Bioinformatics. 2018;34:1–8.
- Zhao S, Guo Y, Sheng Q, et al. Advanced heat map and clustering analysis using heatmap3. Biomed Res Int. 2014;(2014):986048.
- Cloonan N, Wani S, Xu Q, et al. MicroRNAs and their isomiRs function cooperatively to target common biological pathways. Genome Biol. 2011;12:R126.
- Neilsen CT, Goodall GJ, Bracken CP. IsomiRs–the overlooked repertoire in the dynamic microRNAome. Trends Genet. 2012;28:544–549.
- Vickers KC, Sethupathy P, Baran-Gale J, et al. The complexity of microRNA function and the role of isomiRs in lipid homeostasis. J Lipid Res. 2013.
- Baran-Gale J, Fannin EE, Kurtz CL, et al. Beta cell 5ʹ-shifted isomiRs are candidate regulatory hubs in type 2 diabetes. PLoS One. 2013;8:e73240.
- Knouf EC, Wyman SK, Tewari M. The human TUT1 nucleotidyl transferase as a global regulator of microRNA abundance. PLoS One. 2013;8:e69630.
- Burroughs AM, Ando Y, De Hoon MJ, et al. A comprehensive survey of 3ʹ animal miRNA modification events and a possible role for 3ʹ adenylation in modulating miRNA targeting effectiveness. Genome Res. 2010;20:1398–1410.
- Koppers-Lalic D, Hackenberg M, Bijnsdorp IV, et al. Nontemplated nucleotide additions distinguish the small RNA composition in cells from exosomes. Cell Reports. 2014;8:1649–1658.
- Selitsky SR, Sethupathy P. tDRmapper: challenges and solutions to mapping, naming, and quantifying tRNA-derived RNAs from human small RNA-sequencing data. BMC Bioinformatics. 2015;16:354.
- Kaczor-Urbanowicz KE, Kim Y, Li F, et al. Novel approaches for bioinformatic analysis of salivary RNA sequencing data in the biomarker development process. Bioinformatics. 2017;34:1–8.
- Wu X, Kim TK, Baxter D, et al. sRNAnalyzer-a flexible and customizable small RNA sequencing data analysis pipeline. Nucleic Acids Res. 2017;45:12140–12151.
- Ghosal A, Upadhyaya BB, Fritz JV, et al. The extracellular RNA complement of Escherichia coli. Microbiologyopen. 2015;4:252–266.
- Acton S, Rigotti A, Landschulz KT, et al. Identification of scavenger receptor SR-BI as a high density lipoprotein receptor. Science. 1996;271:518–520.
- Zhang Y, Da Silva JR, Reilly M, et al. Hepatic expression of scavenger receptor class B type I (SR-BI) is a positive regulator of macrophage reverse cholesterol transport in vivo. J Clin Invest. 2005;115:2870–2874.
- Wiersma H, Gatti A, Nijstad N, et al. Scavenger receptor class B type I mediates biliary cholesterol secretion independent of ATP-binding cassette transporter g5/g8 in mice. Hepatology. 2009;50:1263–1272.
- Zanoni P, Khetarpal SA, Larach DB, et al. Rare variant in scavenger receptor BI raises HDL cholesterol and increases risk of coronary heart disease. Science. 2016;351:1166–1171.
- Varban ML, Rinninger F, Wang N, et al. Targeted mutation reveals a central role for SR-BI in hepatic selective uptake of high density lipoprotein cholesterol. Proc Natl Acad Sci U S A. 1998;95:4619–4624.
- Zhong CY, Sun WW, Ma Y, et al. Microbiota prevents cholesterol loss from the body by regulating host gene expression in mice. Sci Rep. 2015;5:10512.
- Zhang X, Cozen AE, Liu Y, et al. Small RNA modifications: integral to function and disease. Trends Mol Med. 2016;22:1025–1034.
- Telonis AG, Loher P, Kirino Y, et al. Consequential considerations when mapping tRNA fragments. BMC Bioinformatics. 2016;17:123.
- Wei Z, Batagov AO, Schinelli S, et al. Coding and noncoding landscape of extracellular RNA released by human glioma stem cells. Nat Commun. 2017;8:1145.
- Yeri A, Courtright A, Reiman R, et al. Total extracellular small RNA profiles from plasma, saliva, and urine of healthy subjects. Sci Rep. 2017;7:44061.
- Quinn JF, Patel T, Wong D, et al. Extracellular RNAs: development as biomarkers of human disease. J of Extracellular Vesicles. 2015;4:27495.
- Zernecke A, Preissner KT. Extracellular ribonucleic acids (RNA) enter the stage in cardiovascular disease. Circ Res. 2016;118:469–479.
- Willeit P, Skroblin P, Moschen AR, et al. Circulating microRNA-122 is associated with the risk of new-onset metabolic syndrome and type 2 diabetes. Diabetes. 2017;66:347–357.
- Heintz-Buschart A, Yusuf D, Kaysen A, et al. Small RNA profiling of low biomass samples: identification and removal of contaminants. BMC Biol. 2018;16:52.
- Stocks MB, Moxon S, Mapleson D, et al. The UEA sRNA workbench: a suite of tools for analysing and visualizing next generation sequencing microRNA and small RNA datasets. Bioinformatics. 2012;28:2059–2061.
- Kim J, Levy E, Ferbrache A, et al. MAGI: a Node.js web service for fast microRNA-Seq analysis in a GPU infrastructure. Bioinformatics. 2014;30:2826–2827.
- Agirre E, Eyras E. Databases and resources for human small non-coding RNAs. Hum Genomics. 2011;5:192–199.
- An J, Lai J, Lehman ML, et al. miRDeep*: an integrated application tool for miRNA identification from RNA sequencing data. Nucleic Acids Res. 2013;41:727–737.
- Friedlander MR, Chen W, Adamidi C, et al. Discovering microRNAs from deep sequencing data using miRDeep. Nat Biotechnol. 2008;26:407–415.