
ABSTRACT
Isolation of extracellular vesicles (EVs) from cell culture supernatant or plasma can be accomplished in a variety of ways. Common measures to quantify relative success are: concentration of the EVs, purity from non-EVs associated protein, size homogeneity and functionality of the final product. Here, we present an industrial-scale workflow for isolating highly pure and functional EVs using cross-flow based filtration coupled with high-molecular weight Capto Core size exclusion. Through this combination, EVs loss is kept to a minimum. It outperforms other isolation procedures based on a number of biochemical and biophysical assays. Moreover, EVs isolated through this method can be further concentrated down or directly immunopurified to obtain discreet populations of EVs. From our results, we propose that cross-flow/Capto Core isolation is a robust method of purifying highly concentrated, homogenous, and functionally active EVs from industrial-scale input volumes with few contaminants relative to other methods.
Introduction
The role of extracellular vesicles (EVs) has received considerable attention in recent years, in particular the class of EVs with a diameter < 120 nm. MicroRNA (miRNA), messenger RNA (mRNA), long non-coding RNA (lncRNA) molecules, as well as proteins (both host and virus-encoded), lipids, and small metabolites have all been found in EVs. EVs have demonstrated roles in cancer progression, metastasis, the response to invading pathogens, and normal development and physiology, such as synaptic transmission and immune responses (reviewed in [Citation1]). Modified EVs are under consideration as vaccine and drug delivery modalities (reviewed in [Citation2]). This principle borrows from the successful encapsulation of the anti-cancer drugs doxorubicin and paclitaxel into liposomal vehicles and albumin nanoparticles, to yield the clinically approved formulations Doxil and Abraxane [Citation3–Citation5]. Lastly, EVs have gained popularity as disease biomarkers, and substantial efforts are underway to translate EVs profiling into a clinical modality, termed “liquid biopsy” [Citation1,Citation6–Citation10].
Exosomes are distinguished from other EV because of their intracellular origin. Exosomes arise from the inward budding of endosomes into multivesicular bodies (MVB). The exosome-loaded MVB then traffic to the plasma membrane and releases the exosomes into the cell surroundings. Exosomes and other classes of EVs are eventually taken up by recipient cells and the packaged contents are unloaded. Whereas the majority of EVs are likely involved in modulating the proximal microenvironment, akin to synaptic vesicles, a significant fraction circulates systemically and can affect distant organs/tissues throughout the body [Citation7,Citation11–Citation13]. EVs are present in bodily secretions such as milk, urine, semen or saliva. Despite significant progress, many of the fundamental molecular details of EVs biogenesis, uptake and trafficking remain unknown [Citation14,Citation15]. This represents a gap in our understanding that prevents successful applications in medicine.
Central to the study of EVs function is the ability to isolate robust quantities of EVs, reproducibly and from a variety of sources and volumes. This includes isolation under enhanced biosafety measures, e.g. in order to study the role of EVs in human immunodeficiency virus (HIV) infection [Citation15–Citation21]. Here, we present a workflow that improves upon this essential first step in EVs research. Cross-flow filtration (CFF)-based EVs enrichment offers several benefits compared to prior methods, and as we describe here, can be used to rapidly, continuously and automatically isolate pure populations of EVs from large volumes of fluids (100 mL – 10 L). It allows for routine generation of highly concentrated EVs at or exceeding the concentration found in human plasma, which is estimated at 1010–1011 particles/mL [Citation22]. The resulting product can be used to study the protein properties, enzymatics, nucleic acid composition, etc. of EVs using previously unachievable industrial-scale input volumes, all the while maintaining their competence for endocytosis.
How is EV purification accomplished today, and what are the limits of current practice? The most frequently employed method for EVs preparation relies on ultracentrifugation (UC). It is a commonly employed technique in EVs and virus purification. Crowding reagents such as ExoQuick™ or polyethylene glycol (PEG), size-exclusion chromatography (SEC), various sucrose/iodixanol gradients, and antibody-based bead-capture have been combined with centrifugation to increase purity [Citation7,Citation23–Citation26].
The first step in EVs isolation utilizes separation based on size and/or density. It is most commonly performed using UC, or crowding reagents such as PEG, followed by low-speed centrifugation. Hence, the size and price of the centrifuge determines the batch size and is considered the rate-limiting step. Standard UC designs limit EVs purification to ~ 20–300 mL batch sizes. UC exerts massive amounts of g-force (> 100,000 g) onto EV, risking lysis and denaturation [Citation27]. A separate first step isolation method is SEC systems, which allow for little more than 20 mL input. Finally, use of crowding reagents, particularly on fluids such as serum/plasma, tend to co-precipitate large proteins and ribonucleic acid:protein complexes such as Ago-complexed miRNA [Citation28]. These contaminants can lead to EV circulating DNA and long RNAs also precipitate under these conditions, making it difficult to assign a biological phenotype to any one molecular entity. Serum proteins in particular have been shown to alter the biological activity of EVs [Citation29]. Hence, we sought a large volume method that removed serum contaminants without subjecting the EV to physical or chemical forces.
CFF, also referred to as tangential-flow filtration, is a technique of nanofiltration that is used for the purification of biomolecules such as therapeutic antibodies, viruses or antibiotics [Citation30–Citation34]. Unlike conventional filtration in which the solution is passed through a size-exclusion membrane once and “head-on”, CFF recycles the input solution and passes it parallel to the filtration membrane ()). Consequently, larger volumes can be used, the volume fed continuously, and EVs are kept in solution rather than being forced against a barrier. Molecules smaller than the size cut-off pass through the filtration membrane and, together with the solvent, accumulate in the waste container, while the retained molecules (EVs in this case), return to be recycled back past the membrane to the cross-flow chamber. CFF can be contrasted to SEC as follows: (i) the solution is repeatedly passed through the exclusion filter in CFF instead of a single passage in SEC; (ii) CFF concentrates the input solution on the order of 10-fold whereas SEC dilutes the input sample over a series of harvested fractions; and (iii) CFF allows for the exchange of different buffers over time. Lastly, the flow-through is free of macromolecules, including EV.
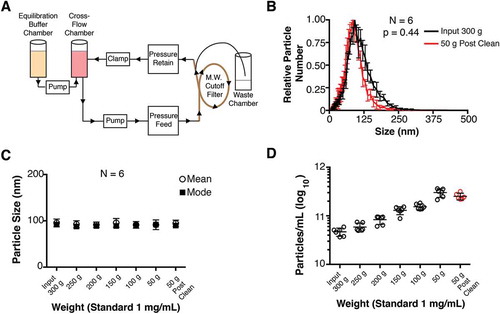
Figure 1. Diagram of cross-flow filtration.
(a) A cross-flow chamber containing the input fluid (tissue culture supernatant, human plasma, tumour fluid, etc.) is pumped into a molecular weight cut-off filter. Molecules smaller than the size exclusion of the MW filter are sent to a waste chamber, whereas molecules larger than the size exclusion MW filter (in this case, EV) are returned to the cross-flow chamber. As the volume in the cross-flow chamber decreases, equilibration buffer is pumped in from the equilibration chamber. After equilibration buffer has been depleted, a final clarified product of concentrated EV can be used. (b) Particle size distribution (from cultured BCBL-1 cells) for Input 300 g and 50 g “Post-Clean” samples, with the modes arbitrarily standardized to 1 (N = 6). (c) Particle sizes were determined by NTA at progressive time points during the CFF concentration step. (d) Concentration of particles measured in each fraction during the CFF concentration step (N = 6).
Here, we combine CFF and Capto Core SEC. This approach yields pure, biologically active, EVs at concentrations of up to 1014 EV/mL. CFF/Capto Core outperformed UC- and PEG-based isolation on a bevy of EVs characterization assays as endorsed by the international society for extracellular vesicles [Citation35]. This approach allows for buffer-exchange and nucleic acid digestion, ensuring that non-EVs encapsulated nucleic acids are eliminated. CFF-based isolation cuts hands-on time, limits exposure to biohazardous source material, and enables EVs isolation from large culture volumes, and allows for cleaner EVs preparations. This approach has broad applicability including larger, industrial-scale isolation of EVs.
Materials and methods
Cell lines
BCBL-1 suspension cells [Citation36] were maintained at 37°C in 5% CO2 in Roswell Park Memorial Institute (Gibco RPMI, ThermoFisher, P: 11875–119) media supplemented with 8% EV-depleted fetal bovine serum (FBS, Sigma P: F2442), and 1X penicillin/streptoymycin (ThermoFisher, P: 15070063). Human telomerase reverse transcriptase immortalized umbilical cord vein cells (hTERT-HUVECs) [Citation37] were maintained at 37°C in 5% CO2. Cells were grown in Endothelial Growth Medium (EGM) supplemented with 2% EV-depleted FBS, components of the EGM Bullet Kit (Lonza, P: CC-3162) and 1X penicillin/streptomycin.
Crossflow filtration and concentration
First, suspension cells were spun at 1000 g for 10 min at 4°C to pellet cells and large debris. Second, samples were spun at 16,000 g for 30 min at 4°C. This step ensures that larger vesicles such as apoptotic bodies are removed from the sample. Third, the clarified cell supernatant was passed through a 0.22 µm Nalgene Rapid Flow Filter (Thermo, P: 567–0020). For these experiments 300 ml flow through was collected into the sterile 500 mL reservoir. The cross-flow chamber (General Electric AKTA Flux S, P: 29038437) was equipped with a 750,000 Dalton (Da, or 750 kDa) molecular weight cut-off filter (GE, P: UFP-750-E-4X2MA) and equilibrated with sterile 1X phosphate buffered saline (PBS, Gibco P: 10010023). Post-equilibration, clarified supernatant was added to the cross-flow chamber and flowed through a 25 mL/minute. The flow through pressure (PF) was maintained at 20 pounds per square inch (PSI) and the retention pressure (PR) was maintained at 11 PSI. An internal magnetic stirring rod was maintained at 200 revolutions per minute (RPM). Fractions of 25 µL were collected at the following points of concentration: Input 300 g – this represents the original 300 mL (measured in grams (g)) of input solution put into the cross-flow chamber, 250 g, 200 g, 150 g, 100 g, and 50 g. The 50 g retentate was continuously washed with 1X PBS, maintaining a minimal weight of 50 g or 50 mL final volume. The total volume of PBS was 250 mL at a rate of 20 mL/minute.
Biophysical analysis of EV
The ZetaView Instrument from Particle Metrix was used for nanoparticle tracking analysis (NTA) for all samples. The analyser was standardized with manufacturer supplied 102 nm polystyrene beads (dilution of 1:250,000) before each run. A typical observed mean size by NTA was 108 nm and the mode size was 105 nm. Afterwards, the NTA was washed with 10 mL of nanopure water and samples were analysed. Between samples 10 mL of nanopure water was used to flush the system. Samples were diluted in water until there were approximately 100–250 particles per field of view. Videos were taken using six cycles in 11 positions to determine particle concentration and size distribution.
Precipitation of EV from solution and human plasma
Polyethylene glycol (PEG, Fisher Scientific/ThermoFisher, P: 156–500, molecular weight = 8000 Da) was made at a stock concentration of 400 mg/mL in 1X PBS and stored at 4°C. PEG was added to the 50 g sample to a final concentration of 40 mg/mL. EV were precipitated at 4°C overnight and the precipitate collated by centrifugation at 1200 g for 60 min at 4°C. The pellet was resuspended in 375 µL of 1X PBS, yielding a combined (CFF + PEG) concentration factor for volume of ~ 800x (375 μL/300 mL).
For the isolation of EV from human plasma, blood was isolated from four healthy donors. Phase separation was done using Ficoll-Paque Plus Reagent (GE Healthcare, P: 17–1440-02). The upper layer (plasma) was then diluted in 1X PBS + 2 mM EDTA pH = 8.0 at a 1:1 ratio. The diluted plasma was then centrifuged at 12,000 g at 4°C for 15 min to pellet platelets, coagulation factors, larger macromolecules, etc. The soluble solution was then removed passed through a 0.22 µm Nalgene Rapid Flow Filter. EV were then processed through the AKTA Flux CFF and precipitated as described above. Final EV pellets were resuspended in 1X PBS + 1 mM EDTA for a concentration factor for volume of 100x.
Concentration of EV by ultracentrifugation
First, 40 mL of BCBL-1 cell culture supernatant was spun at 1000 g at 4°C for 10 min to pellet cells and large debris. Second, samples were transferred to clean, 50 mL conical tubes and spun at 16,000 g at 4°C for 30 min to remove larger vesicles such as apoptotic bodies. Third, clarified cell supernatant was passed through a 0.22 µm Nalgene Rapid Flow Filter as above. The clarified solution was placed into disposable plastic tubes and into the Beckman Optima LE-80K Ultracentrifuge using the SW32-TI rotor at 100,000 g for 60 min at 4°C at < 20μ. Excess fluid was aspirated, the pellet was washed with 5 mL of 1X PBS and spun again at 100,000 g for 60 min at 4°C at < 20μ. The first UC pellet was resuspended in 250 μL of PBS, and the solution was then incubated with RNaseA (Promega, P: A7973) at a final concentration of 50 µg/mL at 37°C for 30 min. The solution was then diluted to 5 mL and spun as before two more times (three total UC steps). The final pellet was resuspended in 50 µL of 1X PBS, yielding a concentration factor of ~ 800-fold (0.05 µL/40 ml).
Immunoblotting and silver staining
Cell pellets and EV were analysed with 12% Bolt Bis-Tris Plus gels (ThermoFisher P: NW00125BOX) run at constant voltage of 150 V using 1X MES Buffer (ThermoFisher P: NP002). For immunoblotting, proteins were transferred onto a nitrocellulose membrane (GE P: 45–004-012) at 0.25 A for 2 h. Membranes were blocked at room temperature with 7% milk diluted in Tris-buffered saline (TBST) pH = 7.5 at room temperature for 30 min. Membranes were probed for proteins using antibodies listed in . For detection of the tetraspanin proteins (CD9, CD63 and CD81), products were denatured under non-reducing conditions using Laemmli dye (50 mM Tris-HCl pH = 6.8, 0.01% w/v bromophenol blue, 5% w/v glycerol, 2% w/v sodium docecyl sulfate). All other proteins were denatured under reducing conditions (Laemmli dye + 5% w/v β-mercaptoethanol). Quantitative fluorescence secondary antibodies were used and images were taken on the Li-Cor Odyssey (Li-Cor P: S/N: ODY-2100) and analysed using Image Studio. All antibody dilutions can be found on . For silver staining, products were run out on a 4–12% Bolt Bis-Tris Plus grandient (ThermoFisher P: NWO01425BOX) at 150 V. Protein bands were developed using the Pierce™ Silver Stain Kit (ThermoFisher P: 24612) and images recorded using the BioRad ChemiDoc MP Imaging System.
Table 1. List of antibodies used in this study, including their manufacturing origin, catalog numbers, and dilutions used.
Capto core chromatography
The resultant after CFF/PEG was treated with RNaseA at a final concentration of 50 µg/mL at 37°C for 30 min. Capto Core 700 HiTrap columns (GE, P: 17548151) were equilibrated with 5 mL of 1X PBS and the samples were loaded using a 2.0 mL Leur-lock plastic syringe. Fractions were eluted with 1.0 mL of 1X PBS in ~ 35 µL fractions, into a Greiner 96 well flat-bottomed plate.
Esterase activity assay
Fractions in Greiner 96 well flat-bottomed plates were incubated with 3.5 µL of the esterase reporter ExoGreen (System Biosciences, P: EXOGP100A-1), the plate was then transferred to the BMG LabTech FluorStar-Optima plate reader, which was acclimatized to 37°C and measurements were taken after 30 min. For subsequent assays using these labelled EVs, non-EV attached, hydrolysed fluorophores were removed with Illustra Microspin G-25 Columns (GE, P: 27–5325-01).
RNA isolation
RNA was isolated using the QIAGEN miRNeasy Mini Kit according the manufacturers protocol (QIAGEN, P: 217004) yielding a final volume of 50 µL. KSHV-encoded miRNAs were reverse transcribed and detected using the KSHV miRK12-7 2x mastermix specific primers (ABI #4472897) as described [Citation7]. CT were determined using SYBR green (ThermoFisher, P: 4309155) on a Roche Lightcycler LC480 system (Roche #5015278001).
Adsorption of labelled EV by endothelial cells and fluorescence microscopy
Labelled EVs were added to 500,000 hTERT-HUVECs grown on glass coverslips in a 6-well plate in 2.5 mL of supplemented EGM. The final concentration was 1011 particles/mL, which is within the physiological range of EV in blood [Citation1,Citation7,Citation8,Citation38–Citation40]. The cells were allowed to adsorb the EV for 12 h. Cells were fixed with 4% paraformaldehyde and permeabilized with 0.1% Triton X-100. Cells were blocked with 8% Bovine Serum Albumin (BSA, Fisher P: BP1600-100) and subsequently incubated with 200 U/mL of Rhodamine Phalloidin (Life Technologies #R415) at room temperature for 60 min. DAPI was then added at a concentration of 200 ng/mL in water for 2 min. Coverslips were then mounted onto glass slides using Prolong Gold (Life Technologies #P36934. Cells were imaged using the Leica DM5500-B equipped with 100x objective the Retiga R3 camera using Type F Immersion liquid (refractive index: 1.5180, Leica #11513859). Z-stack images (56 planes with range ± 0.1 µm) were taken and deconvoluted using the program MetaMorph version 7.8 12.0 (Molecular Devices, San Jose, CA, USA) on a Dell Precision T5180 Computer. Images were background subtracted using Imaris v 8.3.1 (Bitplane, Zurich, Switzerland) and single plane images were captured.
Transmission electron microscopy of EV
Carbon-coated 400 mesh copper grids were glow discharged for 3 min and then a total of 10 µL of the diluted EV samples were absorbed onto the grids. The grids were then stained with 2% w/v uranyl acetate in water. Samples were visualized on a FEI Tecnai 12 TEM at 80 kV. EM micrographs were captured using a Gatan Orius CCD camera and Gatan Digital Micrograph software. Micrographs were then analysed manually for EV diameter using Image J. Size density distribution profiles were then plotted for the TEM-captured EV images. A Wilcox rank sum test was used to determine difference among group means.
Statistical analyses
Quantitative experiments were assayed for significant differences using analysis of variance (ANOVA) and students T-test using R studio v 3.5 (Boston, MA, USA) or Prism v 6 (Prism, Graph Pad, La Jolla, CA, USA). For statistical analyses done in , an ANOVA followed by pairwise tests and an integration-based T-test was done to identify individual groupings. For , a Wilcoxon Rank Sum test was done to determine significant differences (p < 0.05), and are highlighted above the bars or with a letter indicating an individual grouping (A, B, C) in the figure legends.
Figure 2. Comparative analysis of EV isolation by ultracentrifugation (UC), polyethylene glycol precipitation (PEG) and CFF/PEG.
(a) Quantitative immunoblot of EV markers for EV obtained by the three methods ultracentrifugation = UC, direct PEG precipitation = PEG, and CFF followed by PEG precipitation = CFF/PEG. Each well represents a 800-fold concentration from the BCBL-1 cell culture supernatant by the three methods (b) Quantitation from (a) using Image Studio (ANOVA and T-tests, N = 3). (c) Size distribution analysis by NTA of EV isolated by the three first-step isolation methods with the modes being arbitrarily standardized to 1 (N = 6 for each group, ANOVA and integration T-tests were performed to identify statistical groups, indicated by a letter next to the isolation method in the legend). (d) Mean and mode particle sizes of the three isolation methods. (e) Total particle concentrations of the three first-step isolation methods (ANOVA and T-tests, N = 6).
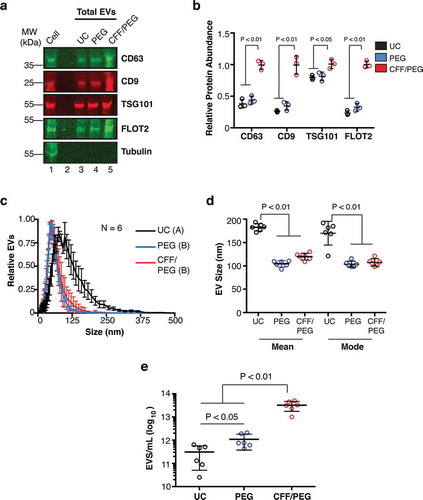
Figure 3. Characterization of a high-confidence “EV Pool” from Capto Core fractionates of the CFF/PEG EV.
(a) The EV pellet isolated via cross-flow filtration was added to high molecular weight cut-off Capto Core resin and fractions were collected and assayed for esterase activity (N = 6). An orange box highlighting fractions 2–8 of the Capto Core fractionates was added to indicate an “EV Pool” (b) Total particles/mL for each fraction, as measured by NTA (N = 6), with the “EV Pool” fractionates highlighted. (c) Mean and mode sizes of the particles in the fractions, as measured by NTA (N = 6), with the “EV Pool” fractionates highlighted. (d) Silver stain analysis of each fraction (gel is representative of 6 independent runs). (e) Quantitative immunoblot of the tetraspanin proteins CD63, CD9, and CD81 in the Capto Core fractions. (f) Band intensities from (e) were quantified in Image Studio. The highest band density was arbitrarily standardized to 1, with the “EV Pool” fractionates highlighted. (g) The KSHV-encoded microRNA miRK12-7 was quantified by RTq-PCR in each fraction, with the “EV Pool” fractionates highlighted. (h) Percent in the EV Pool for each assay was calculated. (i-l) hTERT-HUVECs were incubated with ExoGreen label + Mock (no EV and post filtration) for 12 h and single plane images were deconvoluted. The cells were stained for Actin (Rhodamine Phalloidin) (i), the ExoGreen marker (j), and nuclei (DAPI) (k). A composite image is shown in (l). (m-p) hTERT-HUVECs were incubated with unlabelled EV (post filtration) for 12 h and single plane images were deconvoluted. The cells were stained for Actin (Rhodamine Phalloidin) (m), the ExoGreen marker (n), and nuclei (DAPI) (o). A composite image is shown in (p). (q-t) hTERT-HUVECs were incubated with labelled CFF/PEG EV (post filtration) for 12 h and single plane images were deconvoluted (q-t). The cells were stained for Actin (Rhodamine Phalloidin) (q), the ExoGreen marker (r), and nuclei (DAPI) (s). A composite image is shown in (t).
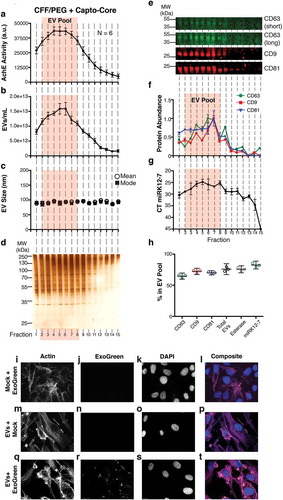
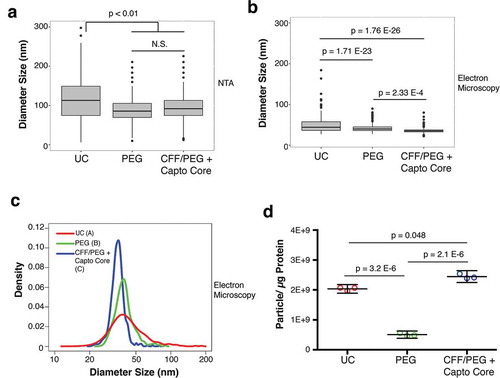
Figure 4. Final size comparison between EV isolated by the three methods.
(a) Plot of the NTA analysis of the diameter of final EV products isolated by UC, PEG, or by CFF/PEG + Capto Core filtration (ANOVA and T-tests, N = 6). (b) Plot of the TEM analysis of the diameter of final EV products isolated by UC, PEG, or by CFF/PEG + Capto Core filtration (Wilcoxon Rank Sum Test, N = 3). (c) Density and diameter plot of the EV visualized by TEM. The area under each curve was arbitrarily set to 1. Wilcox rank sum test was used to determine statistical significance between the three groups and are labelled by a letter next to the figure legend. All graphs and statistics were done in R (Wilcox Rank Sum Test/Integration-based T-test, N = 3). (d) EV purity analysis from three methods. A particle to protein calculation was conducted on the final products obtained from the three methods, as measured by NTA and BCA assay, respectively (ANOVA and T-tests, N = 3).
Results
CFF yields concentrated EV from large volumes
Total EV from BCBL-1 cell culture supernatant were washed and concentrated using a CFF as shown in ). The EV were successively concentrated from 300 g to 50 g and at 50 g extensively washed with PBS. A size distribution analysis comparing the “Input 300 g” and the “50 g Post Clean” samples using a total of 6 independent replicates are shown in () and Supplementary Videos 1–2). The mode sizes were 91.92 ± 7.11 nm for the 300 g Input fraction and 85.78 ± 6.09 nm for the 50 g Post-Clean fraction (for particle sizes, p = 0.38, paired T-test; for size distribution, p = 0.44, integration-based paired T-test, N = 6). Sizes remained constant at all fractions, including the Post-Clean step ()). Progressive concentration of the EV in solution was confirmed by NTA ()). Taken together, size distribution and mean/mode sizes of the EV were not changed during the CFF concentration and wash.
EV obtained from BCBL-1 culture supernatant by UC alone, precipitation alone, or CFF followed by PEG precipitation were compared using immunoblot against common EV-associated proteins. EVs were resuspended in proportional volumes of PBS (see methods). The tetraspanin molecules CD9 and CD63 [Citation8,Citation25,Citation26,Citation38,Citation41], the ESCRT-I associated tumour suppressor gene 101 (TSG101) [Citation19,Citation20,Citation25,Citation42–Citation44], and the late-endosome/lipid raft protein Flotillin-2 [Citation7,Citation45–Citation47] were selected as markers. All were present in EV obtained by these three methods, but not the intracellular control Tubulin ()). Protein levels for EV isolated by CFF/PEG contained as much or higher levels of the same EV protein than by EV isolated by UC or direct PEG precipitation alone ()). Next, BCBL-1 EV obtained by CFF/PEG, UC alone, or direct precipitation were compared in terms of size and concentration through NTA (Supplementary Videos 3–5, respectively). EV isolated by CFF/PEG and direct PEG showed a more narrow and smaller size range compared to EV isolated by UC ()), and mean and mode sizes for UC were higher than both CFF/PEG and direct-PEG ()). Lastly, total EV per millilitre (mL) were quantitated for the three methods. CFF/PEG outperformed both UC and direct PEG ()). In sum, automated CFF followed by PEG precipitation was equal or better for the isolation of EV as measured by biophysical assays and marker protein levels.
Combination of CFF/PEG with Capto Core chromatography yields concentrated, highly purified endocytic-competent EV
The CFF was set up using a cut-off membrane of 750 kDa, which should retain macromolecules such as EV while removing smaller molecules such as individual proteins and metabolites. PEG precipitation concentrated EV, but may have also introduced aggregation of proteins and nucleic acids (RNA, DNA, miRNA:ribonucleoprotein complexes) as well as PEG itself. Hence, an RNase treatment was added followed by Capto Core chromatography. Capto Core resin was developed to separate flu virus away from contaminants such as albumin [Citation48,Citation49]. The concentrated CFF/PEG EV solution from BCBL-1 cell culture supernatant was loaded into a Capto Core column and fractions collected for analysis. As EVs are rich in packaged esterases, enzymatic activity of each fractions was determined ()) as well as EV concentrations ()) and EV mean/mode sizes ()). For all assays, N = 6 independent biological replicates were performed. Fractions 2–8 (“EV Pool”) had the highest EV concentrations and enzymatic activity. These were evaluated for total protein content. The “EV Pool” had the highest total protein concentration ()). Quantitative immunoblot confirmed the presence of CD63, CD9 and CD81 in the “EV Pool” ()) and quantitated in ).
The EVs were derived from the BCBL-1 cell line in which 50% of all miRNAs are derived from Kaposi’s Sarcoma-Associated Herpesvirus (KSHV) [Citation50]. The viral miRNAs are incorporated into CD63+ EV [Citation7] and thus RNase resistant. Therefore, any KSHV-encoded miRNAs (miRK) can be used to track EV through any purification process. We treated the CFF/PEG pellet with RNaseA prior to Capto Core filtration to remove any non-EV encased RNA species, particularly extracellular RNAs associated with Ago-2 [Citation7]. The miRK12-7 levels were determined by real-time qPCR and plotted for each fraction: miRK12-7 was enriched in the “EV Pool” ()). ) demonstrates that the fractions for each of the markers retained in the “EV Pool” for comparable.
To test the hypothesis that the EVs were still capable of endocytosis after these extensive purification steps, endothelial cells were selected as targets. Endothelial cells are a physiologically relevant target of KSHV and KSHV-derived EV [Citation51]. EVs were labelled with ExoGreen and added to human telomerase reverse transcriptase immortalized human umbilical vein endothelial cells (hTERT-HUVECs). As negative controls, PBS was incubated with the label and an equivalent concentration of unlabelled (Mock) EV was added. To ensure that no excess label was being carried through the reaction, PBS incubated with ExoGreen (Mock + ExoGreen) was filtered and added to cells ()). As expected, no green signal was observed, verifying our filtration. In the unlabelled EV (EV + Mock), no background fluorescence was observed in the treated cells ()). Only in the ExoGreen labelled EV treatment group was transfer the fluorescently labelled proteins into recipient cells observed ()). In sum, EV purified by CFF/PEG, RNase-treated and purified by Capto Core retained the ability to be adsorbed by recipient cells.
A drawback to NTA is that it may over-estimates particles size [Citation11]. This can be due to vesicle-solvent interactions, which may influence Brownian motion. No differences were observed for comparing the NTA profiles between PEG and CFF/PEG + Capto Core purified EV, but both were significantly smaller than EV isolated by UC ()). To verify EV sizes and morphology, individual EV was visualized by negative staining transmission electron microscopy (TEM). We could observe some abnormalities in the EV shape isolated UC indicative of lysis. We also found nucleic acids in EV isolated by UC, but not the other two methods (Supplementary Figure 1–3). As all EV were treated with RNaseA, the most likely explanation is that the nucleic acids were released from the EV during the high g spins. The EV diameter in the TEM micrographs was recorded. Independent biological replicates were used and a minimum of 110 individual EV was manually quantified counted for each isolation method. This confirmed a statistical difference in mean EV diameter ()), Wilcox rank sum test, N = 3 replicates for each technique), which is more evident in the size density distribution profiles ()). This demonstrates that CFF/PEG/Capto Core yields a more homogeneously sized population of EV than either PEG or UC. It is important to note that this method of EM dehydrates the vesicles, causing them to shrink in size [Citation52]. However, given that all samples were prepared at the same time, we are confident in our statistical analyses with regards to EV size as measured by TEM. To test the purity of the isolated EVs, a particle:protein ratio was calculated for each of the three methods [Citation53]. Purifying EV by PEG along yielded the most impure EV, while UC and CFF/Capto Core were progressively more pure ()). These results show that PEG precipitation alone yielded the least pure EVs, and CFF/Capto-Core yields the most pure preparations.
Use of CFF/Capto Core on human plasma yields concentrated EV
To test if our workflow could be used to purify EV from human fluids, we isolated plasma from four healthy donors. Using CFF/Capto Core, a similar enzymatic activity curve of plasma EV was observed (we added in the EV Pool shaded box from the previous results) ()). Similarly, EVs, as measured by NTA, were abundant in the EV Pool fractions ()), and mean/mode sizes were consistent with previous results ()). We next tracked individual proteins in the fractions. Despite repeated attempts, we were unable to consistently observe the molecule CD9 [Citation54]; however we could easily detect CD63, CD81 and the EV-associated protein Alix. These protein markers were present in our EV pool, but were also present in subsequent fractions (,)).
Figure 5. CFF/PEG + Capto Core can be used on human plasma for the isolation of EV from in vivo samples.
(a) The EV pellet from four healthy donors were isolated via cross-flow filtration was added to high molecular weight cut-off Capto Core resin and fractions were collected and assayed for esterase activity (N = 4). The orange “EV Pool” from was used to directly compare EV from tissue culture and EV from plasma. (b) Total particles/mL for each fraction, as measured by NTA (N = 4) (c) Mean and mode sizes of the particles in the fractions, as measured by NTA (N = 4) (d) Quantitative immunoblot of the tetraspanin proteins CD63, CD81, and Alix in the Capto Core fractions. (e) Band intensities from (d) were quantified in Image Studio. The highest band density was arbitrarily standardized to 1, with the “EV Pool” fractionates highlighted. (f) Percent in the EV Pool for each assay was calculated.
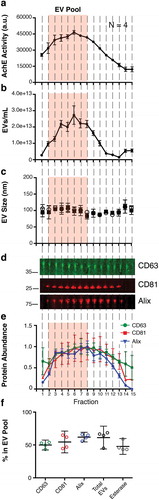
Collectively, our “EV Pool” was able to capture 40–61% of these independent EV markers. This is slightly lower than the results obtained through the isolation of EV from tissue culture supernatant ()). The most likely explanation for this is over-loading of the Capto Core column with EV from human plasma. However, our workflow is highly reproducible for the initial EV isolation from tissue culture supernatant and human plasma, and subsequent purification steps such as affinity purification and iodixanol gradients can be employed to yield discreet EV populations at high concentrations.
Discussion
In this report, we outline an industrial-scale workflow to isolate concentrated, endocytic-competent EV from large volumes of fluid, the EV were homogeneous in terms of biophysical and biochemical markers. CFF (i) concentrates the input approximately 10-fold, (ii) removes molecules < 750 kDa (proteins, metabolites, ions) and (iii) allows for buffer exchange. Subsequent PEG precipitation, RNase treatment, and a one-step Capto Core filtration increased EV homogeneity to yield a robust purification pipeline for EV. Capto Core beads differ from Sephadex or other size-exclusion matrices as they have a charged inner core to retain molecules by charge in addition to size [Citation48,Citation49]. In our hands, EV concentration was ~ 200–800 fold higher through CFF/Capto Core compared to UC or direct PEG, even accounting for input volume and final resuspension volume. In principle even higher enrichment is possible, since CFF can be fed continuously allowing for input volumes in the multi-litre range. This report supports the recent findings by Corso et al. in which a cross-flow/large MW SEC approach can be used to isolate EV in high concentrations from adherent cells [Citation55]. In our hands, we have used volumes up to 400 mL from lymphoma cells (BCBL-1) and human plasma to expand upon this. We have demonstrated CFF/PEG + Capto Core far-outperforms other methods of EV isolation. It has fewer spins (contrasting to UC-based isolation) and a lower volume to precipitate EV out of (contrasting to direct PEG-precipitation).
Here, KSHV infected BCBL-1 was used as source of tissue culture-derived EV. BCBL-1 cells grow in suspension, allowing for bulk culture. KSHV incorporates high levels of viral miRNAs into EV. The viral miRNAs served as a convenient tracer for EV integrity, as only intact EV can protect these miRNAs from RNase digestion [Citation7]. As the EVs are immensely concentrated after purification additional steps e.g. antibody-based affinity purification or sucrose/iodixanol gradient flotation are easily added for selective enrichment of antigenically-defined or density-defined sub-populations of EV [Citation8,Citation24,Citation26,Citation56]. This method is applicable to human plasma, with similar results. Isolation of EV from human plasma can present several issues that must be addressed such as: contamination with virus particles, contamination with high levels of lipoprotein-associated with LDLs and HDLs, and contamination with coagulation factors. To separate EV from viral particles an large lipoproteins, subsequent steps such as affinity purification using antibody coated beads should be employed [Citation7,Citation11].
It is difficult to compare EV isolation methods. Certain criteria are broadly agreed upon [Citation35]. The method outlined here equalled or exceeded UC (triple centrifugation), SEC, or PEG-based purification based on: (i) EV retained the same protein markers, but at higher concentration. (ii) EVs were more homogenous with regard to size distribution. (iii) EVs were at higher concentration, since a larger input volume could be utilized. (iv) The purified EVs were enzymatically active and readily adsorbed to recipient cells, demonstrating biological viability. This approach is robust and reproducible, requires comparatively little hands-on time, and is suitable for automation. CFF units with up to 14 L reservoirs are commercially available, allowing for this method to be adapted for good manufacturing practices.
Supplemental Material
Download Zip (29.3 MB)Disclosure statement
No potential conflict of interest was reported by the authors.
Supplementary material
Supplemental data for this article can be accessed here.
Additional information
Funding
Related Research Data
References
- Raab-Traub N, Dittmer DP. Viral effects on the content and function of extracellular vesicles. Nat Rev Microbiol. 2017 Sep;15(9):559–14. PubMed PMID: 28649136; PubMed Central PMCID: PMCPMC5555775.
- Reiner AT, Witwer KW, van Balkom BWM, et al. Concise review: developing best-practice models for the therapeutic use of extracellular vesicles. Stem Cells Transl Med. 2017 Aug;6(8):1730–1739. PubMed PMID: 28714557; PubMed Central PMCID: PMCPMC5689784.
- Zhang CG, Zhu WJ, Liu Y, et al. Novel polymer micelle mediated co-delivery of doxorubicin and P-glycoprotein siRNA for reversal of multidrug resistance and synergistic tumor therapy. Sci Rep. 2016 Mar;6. DOI:10.1038/srep23859 PubMed PMID: WOS:000373170200001.
- Northfelt DW, Dezube BJ, Thommes JA, et al. Pegylated-liposomal doxorubicin versus doxorubicin, bleomycin, and vincristine in the treatment of AIDS-related Kaposi’s sarcoma: results of a randomized phase III clinical trial. J Clin Oncol. 1998 Jul;16(7):2445–2451. PubMed PMID: WOS:000074596200022.
- Gradishar WJ, Tjulandin S, Davidson N, et al. Phase III trial of nanoparticle albumin-bound paclitaxel compared with polyethylated castor oil-based paclitaxel in women with breast cancer. J Clin Oncol. 2005 Nov;23(31):7794–7803. PubMed PMID: WOS:000233066700009.
- Burger D, Schock S, Thompson CS, et al. Microparticles: biomarkers and beyond. Clin Sci. 2013 Apr;124(7–8):423–441. PubMed PMID: WOS:000317554700001.
- Chugh PE, Sin SH, Ozgur S, et al. Systemically circulating viral and tumor-derived microRNAs in KSHV-associated malignancies. PLoS Pathog. 2013;9(7):e1003484. PubMed PMID: 23874201; PubMed Central PMCID: PMCPMC3715412.
- Hurwitz SN, Rider MA, Bundy JL, et al. Proteomic profiling of NCI-60 extracellular vesicles uncovers common protein cargo and cancer type-specific biomarkers. Oncotarget. 2016 Dec;7(52):86999–87015. PubMed PMID: WOS:000391422500107.
- Ogata-Kawata H, Izumiya M, Kurioka D, et al. Circulating exosomal microRNAs as biomarkers of colon Cancer. PLoS One. 2014 Apr 4;9(4). DOI:10.1371/journal.pone.0092921 PubMed PMID: WOS:000334107500022.
- Taylor DD, Gercel-Taylor C. MicroRNA signatures of tumor-derived exosomes as diagnostic biomarkers of ovarian cancer. Gynecol Oncol. 2008 Jul;110(1):13–21. PubMed PMID: WOS:000257625000004.
- McNamara RP, Costantini LM, Myers TA, et al. Nef secretion into extracellular vesicles or exosomes is conserved across human and simian immunodeficiency viruses. MBio. 2018;9:e02344–17.
- Keller S, Konig A-K, Marme F, et al. Systemic presence and tumor-growth promoting effect of ovarian carcinoma released exosomes. Cancer Lett. 2009 Jun 8;278(1):73–81. PubMed PMID: WOS:000265712800011.
- Montecalvo A, Larregina AT, Shufesky WJ, et al. Mechanism of transfer of functional microRNAs between mouse dendritic cells via exosomes. Blood. 2012 Jan;119(3):756–766. PubMed PMID: WOS:000299594100016.
- Antonyak MA, Cerione RA. Emerging picture of the distinct traits and functions of microvesicles and exosomes. Proc Natl Acad Sci U S A. 2015 Mar 24;112(12):3589–3590. PubMed PMID: 25762069; PubMed Central PMCID: PMCPMC4378426.
- Hu G, Witwer KW, Bond VC, et al. Proceedings of the ISEV symposium on “HIV, NeuroAIDS, drug abuse & EVs”. J Extracell Vesicles. 2017;6(1):1294360. PubMed PMID: 28800366; PubMed Central PMCID: PMCPMC5373676.
- Konadu KA, Huang MB, Roth W, et al. isolation of exosomes from the plasma of HIV-1 positive individuals. J Vis Exp. 2016 Jan 5;(107). DOI:10.3791/53495 PubMed PMID: 26780239; PubMed Central PMCID: PMCPMC4780996.
- Nolte-’T Hoen E, Cremer T, Gallo RC, et al. Extracellular vesicles and viruses: are they close relatives?. Proc Natl Acad Sci U S A. 2016 Aug 16;113(33):9155–9161. PubMed PMID: 27432966; PubMed Central PMCID: PMCPMC4995926.
- Lenassi M, Cagney G, Liao M, et al. HIV nef is secreted in exosomes and triggers apoptosis in bystander CD4+ T cells. Traffic. 2010 Jan;11(1):110–122. PubMed PMID: 19912576; PubMed Central PMCID: PMCPMC2796297.
- Barclay RA, Schwab A, DeMarino C, et al. Exosomes from uninfected cells activate transcription of latent HIV-1. J Biol Chem. 2017 Jul;292(28):11682–11701. PubMed PMID: WOS:000405485600009.
- DeMarino C, Pleet ML, Cowen M, et al. Antiretroviral drugs alter the content of extracellular vesicles from HIV-1-infected cells. Sci Rep. 2018 May;8. DOI:10.1038/s41598-018-25943-2 PubMed PMID: WOS:000432273000001.
- Anderson MR, Kashanchi F, Jacobson S. Exosomes in viral disease. Neurotherapeutics. 2016 Jul;13(3):535–546. PubMed PMID: WOS:000380679400010.
- Caby MP, Lankar D, Vincendeau-Scherrer C, et al. Exosomal-like vesicles are present in human blood plasma. Int Immunol. 2005 Jul;17(7):879–887. PubMed PMID: 15908444.
- Rider MA, Hurwitz SN, Meckes DG Jr. ExtraPEG: A polyethylene glycol-based method for enrichment of extracellular vesicles. Sci Rep. 2016 Apr 12;6:23978. PubMed PMID: 27068479; PubMed Central PMCID: PMCPMC4828635.
- Kowal J, Arras G, Colombo M, et al. Proteomic comparison defines novel markers to characterize heterogeneous populations of extracellular vesicle subtypes. Proc Natl Acad Sci U S A. 2016 Feb 23;113(8):E968–77. PubMed PMID: 26858453; PubMed Central PMCID: PMCPMC4776515.
- Baranyai T, Herczeg K, Onodi Z, et al. Isolation of exosomes from blood plasma: qualitative and quantitative comparison of ultracentrifugation and size exclusion chromatography methods. PLoS One. 2015;10(12):e0145686. PubMed PMID: 26690353; PubMed Central PMCID: PMCPMC4686892.
- Kaur S, Elkahloun AG, Arakelyan A, et al. CD63, MHC class 1, and CD47 identify subsets of extracellular vesicles containing distinct populations of noncoding RNAs. Sci Rep. 2018 Feb;8. DOI:10.1038/s41598-018-20936-7 PubMed PMID: WOS:000424318700049.
- Li P, Kaslan M, Lee S, et al. Progress in exosome isolation techniques [Review]. Theranostics. 2017;7(3):789–804. PubMed PMID: WOS:000396557300022; English.
- Arroyo JD, Chevillet JR, Kroh EM, et al. Argonaute2 complexes carry a population of circulating microRNAs independent of vesicles in human plasma. Proc Natl Acad Sci U S A. 2011 Mar 22;108(12):5003–5008. PubMed PMID: 21383194; PubMed Central PMCID: PMCPMC3064324.
- Liao Z, Muth DC, Eitan E, et al. Serum extracellular vesicle depletion processes affect release and infectivity of HIV-1 in culture. Sci Rep. 2017 May 31;7(1):2558. PubMed PMID: 28566772; PubMed Central PMCID: PMCPMC5451420.
- Grzenia DL, Carlson JO, Wickramasinghe SR. Tangential flow filtration for virus purification. J Memb Sci. 2008 Aug;321(2):373–380. PubMed PMID: WOS:000258166700030.
- Wickramasinghe SR, Kalbfuss B, Zimmermann A, et al. Tangential flow microfiltration and ultrafiltration for human influenza A virus concentration and purification. Biotechnol Bioeng. 2005 Oct;92(2):199–208. PubMed PMID: WOS:000232253100009.
- Hung JJ, Borwankar AU, Dear BJ, et al. High concentration tangential flow ultrafiltration of stable monoclonal antibody solutions with low viscosities. J Memb Sci. 2016 Jun;508:113–126. PubMed PMID: WOS:000373076400013.
- Lebreton B, Brown A, van Reis R. Application of high-performance tangential flow filtration (HPTFF) to the purification of a human pharmaceutical antibody fragment expressed in Escherichia coli. Biotechnol Bioeng. 2008 Aug;100(5):964–974. PubMed PMID: WOS:000257821800013.
- Liu HF, Ma JF, Winter C, et al. Recovery and purification process development for monoclonal antibody production. MAbs. 2010 Sep-Oct;2(5):480–499. PubMed PMID: WOS:000283634100004.
- Lotvall J, Hill AF, Hochberg F, et al. Minimal experimental requirements for definition of extracellular vesicles and their functions: a position statement from the International Society for Extracellular Vesicles. J Extracell Vesicles. 2014;3:26913. . PubMed PMID: 25536934; PubMed Central PMCID: PMCPMC4275645.
- Renne R, Zhong W, Herndier B, et al. Lytic growth of Kaposi’s sarcoma-associated herpesvirus (human herpesvirus 8) in culture. Nat Med. 1996 Mar;2(3):342–346. PubMed PMID: 8612236; eng.
- Wang L, Wakisaka N, Tomlinson CC, et al. The Kaposi’s sarcoma-associated herpesvirus (KSHV/HHV-8) K1 protein induces expression of angiogenic and invasion factors. Cancer Res. 2004 Apr 15;64(8):2774–2781. PubMed PMID: 15087393.
- Hurwitz SN, Nkosi D, Conlon MM, et al. CD63 regulates epstein-barr virus LMP1 exosomal packaging, enhancement of vesicle production, and noncanonical NF-kappa B signaling. J Virol. 2017 Mar;91(5). DOI:10.1128/jvi.02251-16 PubMed PMID: WOS:000394356400032.
- Meckes DG Jr., Shair KHY, Marquitz AR, et al. Human tumor virus utilizes exosomes for intercellular communication. Proc Natl Acad Sci U S A. 2010 Nov 23;107(47):20370–20375. PubMed PMID: WOS:000284529000043.
- Meckes DG Jr., Gunawardena HP, Dekroon RM, et al. Modulation of B-cell exosome proteins by gamma herpesvirus infection. Proc Natl Acad Sci USA. 2013 Jul 30;110(31):E2925–E2933. PubMed PMID: WOS:000322441500013.
- Pols MS, Lumperman J. Trafficking and function of the tetraspanin CD63. Exp Cell Res. 2009 May 15;315(9):1584–1592. PubMed PMID: WOS:000266121200005.
- Ghossoub R, Lembo F, Rubio A, et al. Syntenin-ALIX exosome biogenesis and budding into multivesicular bodies are controlled by ARF6 and PLD2 [article]. Nat Commun. 2014 Mar 5;12. DOI:10.1038/ncomms4477 PubMed PMID: WOS:000334300800006; English.
- Fujii K, Hurley JH, Freed EO. Beyond Tsg101: the role of alix in ‘ESCRTing’ HIV-1 [article]. Nat Rev Microbiol. 2007 Dec; 5(12):912–916. PubMed PMID: WOS:000251417900011; English.
- Lee JH, Schierer S, Blume K, et al. HIV-nef and adam17-containing plasma extracellular vesicles induce and correlate with immune pathogenesis in chronic HIV infection. Ebiomedicine. 2016 Apr;6:103–113. PubMed PMID: WOS:000375080400024.
- Salzer U, Prohaska R. Stomatin, flotillin-1, and flotillin-2 are major integral proteins of erythrocyte lipid rafts. Blood. 2001 Feb;97(4):1141–1143. PubMed PMID: WOS:000166867200050.
- Frick M, Bright NA, Riento K, et al. Coassembly of flotillins induces formation of membrane microdomains, membrane curvature, and vesicle budding. Curr Biol. 2007 Jul;17(13):1151–1156. PubMed PMID: WOS:000247852100028.
- Sasaki Y, Oshima Y, Koyama R, et al. Identification of flotillin-2, a major protein on lipid rafts, as a novel target of p53 family members. Mol Cancer Res. 2008 Mar;6(3):395–406. PubMed PMID: WOS:000254259100006.
- Blom H, Akerblom A, Kon T, et al. Efficient chromatographic reduction of ovalbumin for egg-based influenza virus purification. Vaccine. 2014 Jun 24;32(30):3721–3724. PubMed PMID: 24801053.
- James KT, Cooney B, Agopsowicz K, et al. Novel high-throughput approach for purification of infectious virions [article]. Sci Rep. 2016 Nov 6;11. DOI:10.1038/srep36826 PubMed PMID: WOS:000387759600001; English.
- O’Hara AJ, Vahrson W, Dittmer DP. Gene alteration and precursor and mature microRNA transcription changes contribute to the miRNA signature of primary effusion lymphoma. Blood. 2008 Feb;111(4):2347–2353. PubMed PMID: 18079361; PubMed Central PMCID: PMCPMC2234063. eng.
- Dittmer DP, Damania B. Kaposi sarcoma associated herpesvirus pathogenesis (KSHV) - an update. Curr Opin Virol. 2013 Jun; 3(3):238–244. PubMed PMID: WOS:000322416300004.
- Witwer KW, Buzás EI, Bemis LT, et al. Standardization of sample collection, isolation and analysis methods in extracellular vesicle research. J Extracell Vesicles. 2013;2. DOI:10.3402/jev.v2i0.20360 PubMed PMID: 24009894; PubMed Central PMCID: PMCPMC3760646. eng.
- Welton JL, Webber JP, Botos LA, et al. Ready-made chromatography columns for extracellular vesicle isolation from plasma. J Extracell Vesicles. 2015;4:27269. PubMed PMID: 25819214; PubMed Central PMCID: PMCPMC4376847. eng.
- Brzozowski JS, Bond DR, Jankowski H, et al. Extracellular vesicles with altered tetraspanin CD9 and CD151 levels confer increased prostate cell motility and invasion. Sci Rep. 2018 Jun;8(1):8822. PubMed PMID: 29891991; PubMed Central PMCID: PMCPMC5995928. eng.
- Corso G, Mager I, Lee Y, et al. Reproducible and scalable purification of extracellular vesicles using combined bind-elute and size exclusion chromatography. Sci Rep. 2017 Sep;7. DOI:10.1038/s41598-017-10646-x PubMed PMID: WOS:000410739000059.
- Willms E, Johansson HJ, Mager I, et al. Cells release subpopulations of exosomes with distinct molecular and biological properties. Sci Rep. 2016 Mar 2;6:22519. PubMed PMID: 26931825; PubMed Central PMCID: PMCPMC4773763.