
ABSTRACT
Transmission electron microscopy (TEM) has nanometre resolution and can be used to distinguish single extracellular vesicles (EVs) from non-EV particles. TEM images of EVs are a result of operator image selection. To which extent operator image selection reflects the overall sample quality, and to which extent the images are comparable and reproducible, is unclear. In a first attempt to improve the comparability and reproducibility of TEM to visualise EVs, we compared operator image selection to images taken at predefined locations from the same grids, using four EV TEM preparation protocols, a single EV-containing sample and a single TEM instrument. Operator image selection leads to high-quality images that are more similar between the protocols. In contrast, images taken at predefined locations reveal differences between the protocols, for example in number of EVs per image and background quality. From the evaluated protocols, for only one protocol the operator image selection is comparable to the TEM images taken at predefined locations. Taken together, operator image selection can be used to demonstrate the presence of EVs in a sample, but seem less suitable to demonstrate the quality of a sample. Because images taken at predefined locations reflect the overall quality of the EV-containing sample rather than the presence of EVs alone, this is a first step to improve the comparability and reproducibility of TEM for monitoring the quality of EV-containing samples.
Introduction
Extracellular vesicles (EVs) are cell-derived particles with a phospholipid bilayer and diameter between 30 and 1,000 nm [Citation1,Citation2]. Transmission electron microscopy (TEM) is the most widely used instrument to monitor the quality and purity of EV-containing samples, because TEM is able to discriminate single EVs from similar sized non-EV particles [Citation3,Citation4]. Therefore, TEM is often applied to demonstrate that a sample is of sufficient quality, i.e. it (1) contains EVs and (2) is sufficiently pure, e.g. for therapeutic application or downstream analysis [Citation5]. Cryo-EM presents major advantages over conventional TEM using negative staining, among which the preservation of the (near-)native hydrated state of EVs, improved overall resolution, and demonstration of the presence of a lipid bilayer. However, cryo-EM is not widely applied due to availability and time needed per sample [Citation6,Citation7]. Therefore, cryo-EM is not evaluated in this study.
At present, TEM images are obtained by “operator image selection”, meaning that an operator takes images at locations where EVs are present and well visible. To which extent this procedure provides a comparable and reproducible impression of the overall sample quality, however, is questionable. At present, there is a strong tendency to improve the comparability and reproducibility in (bio)medical science, including the new field of EV research [Citation5,Citation8,Citation9]. Therefore, as a first step, we compared operator image selection to images taken at predefined locations from the same TEM grids. We used four commonly applied EV TEM preparation protocols, but minimised the contribution of other variables by using a single EV-containing sample and by imaging on a single TEM instrument. This procedure eliminates differences due to inter-sample variation, and enables a straightforward and “head-to-head” comparison between operator image selection versus images taken at predefined locations.
Materials and methods
Protocol selection
TEM preparation protocols for EV samples were selected based on a literature search in Web of Science (Supplemental Data 1). Articles in English published between January 2011 and November 2016 were included. From the 2,602 included articles, we selected authors that are authorities in the EV field based on co-authorship on the MISEV criteria [Citation5], and co-authored at least eight articles which include TEM images of EV samples. From these research groups the most recent protocol was selected. The resulting nine protocols [Citation10–Citation18] are summarised in . These protocols contain three main elements: (1) fixation to preserve EV morphology, (2) adsorption of EVs to a TEM grid and (3) negative staining to enhance the contrast between EVs and the background. From , it is clear that each protocol has many variables, and there is no variable similar between protocols. Particularly surprising is the absence or presence of fixation using glutaraldehyde (GA), osmium tetroxide (OsO4) and paraformaldehyde (PFA). Therefore, we selected one protocol of every fixative to evaluate in this study, except OsO4 due to safety regulations of our TEM facility. Furthermore, we also included one protocol which applied UV treatment of the TEM grid to enhance EV adhesion. These protocols are labelled A–D in . Authors provided additional protocol information upon our request. It should be noted that the grid surface in contact with the sample was always carbon-coated formvar without glow discharge. Even though a thin carbon film or glow discharge may affect the number of EVs and the background quality, we did not apply glow discharge because none of the selected protocols mentioned this.
Table 1. Preparation protocols for transmission electron microscopy of extracellular vesicles.
Extracellular vesicle sample
We applied the protocols to a single urinary EV sample, because urine has low concentrations of non-EV particles such as lipoproteins and protein aggregates [Citation19]. Urine was obtained from five overnight fasting healthy male individuals. This study was carried out in accordance with the Dutch law on research with human subjects. The study protocol was waived by the medical ethics committee of the Academic Medical Center, University of Amsterdam. All subjects gave written informed consent in accordance with the Declaration of Helsinki. The urine was pooled and centrifuged to remove cells (8 × 50 mL pooled urine, 10 min at 180 g, 4°C, followed by 20 min at 1,560 g, 4°C) using a Rotina 46RS centrifuge (Hettich, Tuttlingen, Germany). Cell-free urine aliquots (1 mL) were frozen in liquid nitrogen and stored at −80°C. Prior to analysis, 12 cell-free urine aliquots were thawed at 37°C and removed from the water bath immediately after thawing. These aliquots were pooled and centrifuged (10 min at 1,560 g, 4°C) to remove precipitated salts. Next, EVs were concentrated from the supernatant by ultracentrifugation (60 min at 154,000 g, 4°C) using a TLA-55 rotor and Optima MAX-XP ultracentrifuge (Beckman Coulter, Fullerton, CA) and washed once in 0.05 µm filtered (Nucleopore, GE Healthcare) phosphate-buffered saline (PBS; 154 mM NaCl, 1.24 mM Na2HPO4.2H2O, 0.2 mM NaH2PO4.2H2O, pH 7.4; supplemented with 0.32% trisodium-citrate). The concentrated EV suspension was divided into four samples, one for each protocol (). Although ultracentrifugation may introduce artefacts in the sample, the same artefacts should be present in all protocols. TEM imaging is possible without the ultracentrifugation step, but requires more images to visualise the same number of EVs. The product of the sample preparation procedure has been characterised previously using TEM, flow cytometry, nanoparticle tracking analysis and tunable resistive pulse sensing [Citation18,Citation20]. For reference, a particle size distribution obtained by nanoparticle tracking analysis is added to the Supplemental Material (Supplemental Figure 1).
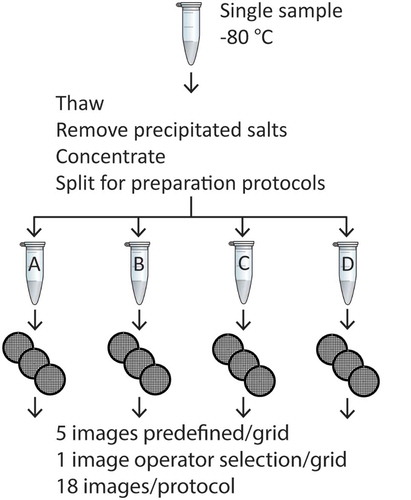
Figure 1. Experimental setup. A single urinary EV sample was thawed and centrifuged to remove precipitated salts. The supernatant was concentrated by a double ultracentrifugation step. Next, the pellet was divided over four Eppendorf tubes to perform the TEM preparation protocols (A–D). From each protocol three grids were imaged at one operator-selected location and at five predefined locations per grid. This resulted in a total of 18 images per protocol.
To verify that the selected final protocol can handle also other relevant types of sample, we also imaged a platelet free plasma sample (30 mL citrate blood from one overnight fasting donor, centrifuged twice for 15 min at 2,500 g, protein concentration reduced by size exclusion chromatography [Citation21]) by applying this protocol. This sample has been characterised by TEM and tunable resistive pulse sensing previously [Citation22].
TEM preparation protocols
The protocols (A–D in ) were performed at room temperature on the same day. All used liquids were filtered by 0.22 µm filters (Merck, Darmstadt, Germany). All TEM grids were obtained from Electron Microscopy Sciences (Hatfield, PA). We prepared three grids per protocol. Grids were air dried at the end of each protocol.
Protocol A [Citation10]: 10 µL of the EV sample was pipetted onto a 400 mesh copper grid with carbon-coated formvar film and incubated for 2 min. Excess liquid was removed by blotting. The grid was briefly placed on 10 µL of 2% uranyl acetate (w/v; Merck, Darmstadt, Germany), followed by blotting to remove excess liquid. This last step was repeated.
Protocol B [Citation13]: The EV sample was fixed 1:1 with 2% glutaraldehyde (v/v; Sigma Aldrich, Saint Louis, MO) for 30 min. A fixed sample of 6 µL was pipetted onto a 200 mesh copper grid with carbon-coated formvar film, and incubated for 10 min. Excess liquid was removed by blotting. The grid was washed twice by brief contact with 100 µL MilliQ water, followed by blotting to remove excess liquid. Next, the grid was placed on 30 µL of 1.5% uranyl acetate (w/v) for 12 s.
Protocol C [Citation16]: A 300 mesh formvar/carbon film nickel grid was placed in a laminar flow cabinet to treat with UV light (TUV30W G30T8, Philips, Eindhoven, the Netherlands) for 15 min. Then, the grid was incubated on 15 µL of EV sample for 10 min. Next, the grid was fixed by placing it on 15 µL of 2.5% glutaraldehyde in PBS (v/v). After 10 min, the grid was placed on 15 µL 2% uranyl acetate (w/v) for 10 min.
Protocol D [Citation18]: The EV sample was fixed 1:1 with 0.2% paraformaldehyde (w/v) for at least 18 h. A 200 mesh copper grid with carbon-coated formvar film was incubated onto 10 µL of fixed sample for 7 min. Next, the grid was placed on 10 µL of 1.75% uranyl acetate (w/v) for 7 min.
Transmission electron microscopy
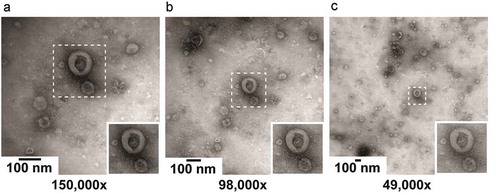
Images were acquired using a single TEM instrument (Fei, Tecnai-12; Eindhoven, the Netherlands) at 80 kV. Illumination was performed with e-beam spot size 2 and filament 30. Images result from the average of two 700 ms acquisitions on a Veleta 2,048 × 2,048 side-mounted CCD camera and Imaging Solutions software (Olympus, Tokyo, Japan). The “mean intensity” was 5,000–6,000. All grids were oriented with the “1” mark on a fixed position in the TEM specimen holder. To find a magnification that shows as many EVs as possible on a single image with sufficient detail to distinguish EV morphological features, we evaluated images at magnifications of 150,000×, 98,000× and 49,000× (). The higher magnification image appears to have a better background quality, i.e. fewer non-EV particles that may interfere with EV recognition. However, this is due to selection of the image area, as shown in panels B and C. From the insets, it can be seen that a lower magnification results in lower contrast and less sharp images compared to a higher magnification. These differences are small, however, and do not interfere with the identification of a cup-shaped particle. Thus, for the rest of the study, we evaluated images at 49,000× magnification (2.2 × 2.2 µm/image, 1.1 × 1.1 nm/pixel). The defocus was set for each image location and was not stored.
Figure 2. Impact of magnification on image quality. The operator selected an image location containing a high number of EVs and relatively low background, and imaged this location at magnifications of 150,000×, 98,000× and 49,000×. The insets show the same 230 × 230 nm area at each magnification. The contrast and sharpness of the image decrease at lower magnification. However higher magnification reduces background if the background is no longer part of the image area.
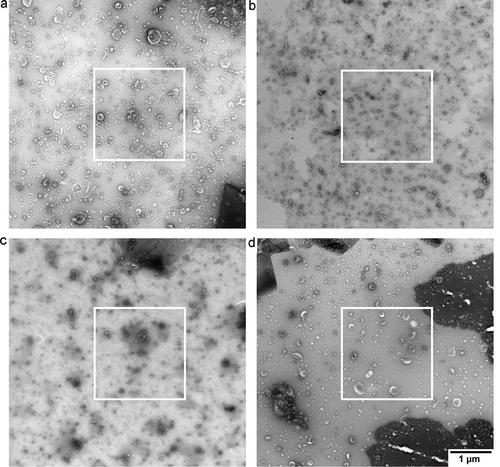
We obtained six images per grid, for a total of 18 images per protocol. In concordance with common practise in the EV field, the operator selected a high-quality image per grid. This image contained a high number of EVs and relatively low background. To provide an “indication of the heterogeneity of the EV preparation studied” [Citation5], the common practise is to include an overview image showing the surroundings of the high-quality image at lower magnification (). To get a general impression of the grid, we imaged at five predefined locations for every grid of each protocol. These five locations were chosen in a line from near one edge of the grid to the other, and if a location was obscured by the mesh, we moved to the nearest transparent location.
Figure 3. Overview of images after operator image selection. TEM images obtained from a single urinary EV sample by the four evaluated protocols. The white outlines indicate the image that we would normally show. The overview image is typically shown in Supplemental Material to “show the heterogeneity of the sample". Panel letters correspond to protocol name, scale bar represents 1 µm and is the same for all images.
TEM image evaluation
Because the urinary EV sample mainly contains EVs, we define EVs as particles with a diameter ≥ 30 nm with sufficient contrast for semi-automated segmentation (Supplemental Figure 2) using the Quick selection tool of PHOTOSHOP v11.0.2 (Adobe Systems, San Jose). A custom Javascript was used to extract the number of EVs per image, and the surface area per EV. The EV diameter was calculated from the surface area using d = √(4A/π), which approximates the EV diameter in suspension [Citation18]. EVs on the edge of the image, or overlapping with annotations were excluded because the diameter of such EVs could not be determined. In TEM, a commonly applied morphological definition of EVs is “cup-shape” [Citation23–Citation25]. Therefore, the same procedure was performed to select cup-shape EVs only (Supplemental Figure 2).
All the TEM images were rated from 1 (poor) to 5 (excellent) by four researchers based on image quality and the background quality. High image quality means the image is suitable for EV research, high background quality means the absence of non-EV particles that interfere with EV recognition. The images were placed in random order to blind the researchers to the protocol. Contrast is defined as the difference between EVs and the background. Background is defined as visible proteins, salts and large non-EV aggregates. Both a low contrast, as well as high background will interfere with the overall recognition of EVs.
Statistics
Statistical analysis was performed in Prism 7.0 (GraphPad, La Jolla, California, USA). The coefficient of variation (%CV) is defined as the standard deviation divided by the mean times 100%. For each image, the number of EVs, the % cup-shape, the image quality and the background quality was evaluated. Statistical analysis was performed to determine whether observed differences between grids or between protocols can be explained by chance alone. Within each protocol, an analysis of variance (ANOVA) was applied to compare the five images for each grid. The student’s t-test was applied to compare the operator-selected images to the images taken at predefined locations. Between protocols, the student’s t-test was applied to compare the 15 images for each protocol. No significant differences (p > 0.05) are expected if the TEM image is not substantially affected by either the practise of operator image selection or the TEM preparation protocol.
Results
To study the effects of four protocols on the obtained TEM images, we imaged a single EV sample using these four protocols. We evaluated each protocol by both the current practise of operator image selection as well as by images taken at predefined locations. The comparison between protocols is based on the number of EVs, % cup-shape EVs, image quality and background quality.
Operator image selection
The current practise is that an operator selects a high-quality image, and includes an overview image of the surroundings. shows the overview image of a high-quality image (white square) for each protocol. High-quality TEM images can be obtained with all protocols by operator image selection, although some differences are visible between the protocols with regards to the number of EVs per image, % cup shape EVs, contrast, and background. Nevertheless, based on , the quality of the obtained images seems to be only modestly affected by the four different protocols.
Qualitative evaluation
shows the TEM images obtained by both operator image selection and at predefined locations for protocol A. The EVs are easily visible and recognisable, because the contrast is high and the background is low. TEM images taken by operator image selection are comparable to the TEM images taken at the predefined locations. Therefore, operator image selection produces images that are representative for protocol A.
Figure 4. TEM images obtained with protocol A. TEM images obtained after operator image selection and at predefined locations for three grids. Scale is the same for all images, bar represents 500 nm.
The TEM images obtained with protocol B are shown in . While the contrast and background are low overall, within a single grid extreme differences in contrast are present. Several images are almost devoid of EVs, and other images lack contrast, making it difficult to recognise EVs. Operator image selection may be needed for a high-quality EV image, because of the differences in contrast between images obtained at predefined locations.
Figure 5. TEM images obtained with protocol B. TEM images obtained after operator image selection and at predefined locations for three grids. Scale is the same for all images, bar represents 500 nm.
The contrast in TEM images obtained with protocol C () is high. EVs are visible in all images but there is moderate to high background in most images. In images with high background it is difficult to identify EVs. To obtain a high-quality EV image operator image selection is needed, but the resulting image does no longer represent the grid.
Figure 6. TEM images obtained with protocol C. TEM images obtained after operator image selection and at predefined locations for three grids. Scale is the same for all images, bar represents 500 nm.
shows the TEM images obtained with protocol D [Citation18]. In most images, the contrast is high, but so is the background which contains visible salt deposits. Due to the background, identification of EVs is the most difficult in protocol D. A predefined location is likely to yield a poor image, and operator image selection is tedious.
Figure 7. TEM images obtained with protocol D. TEM images obtained after operator image selection and at predefined locations for three grids. Scale is the same for all images, bar represents 500 nm.
Quantitative evaluation
For all images, we quantified the number of EVs, the % cup-shape EVs, the image quality, and the background quality. The data are summarised in and in Supplemental Table 1. Because we used a single EV-containing sample and made all images using a single TEM instrument, we can compare the data obtained with the four protocols (). The size distributions of EVs do not differ between protocols (Supplemental Figure 1).
Table 2. Statistical comparisons between grids of each protocol (ANOVA), between operator selected and predefined locations (student’s t-test) and between protocols (student’s t-test).
Figure 8. Summary of image properties by protocol and grid. Total number of EV per image (a), % cup-shape of total EVs per image (b), image quality (c) and background quality (d) are shown for the four TEM preparation protocols. Each symbol represents one image. Circles indicate images taken at predefined locations, x indicates operator image selection. Horizontal bar shows the mean value of predefined image locations per grid.
Operator image selection leads to TEM images with a higher number of EVs, higher image quality and higher background quality compared to images taken at predefined locations. Furthermore, the TEM images are more similar between protocols ( and Supplemental Table 1). Because there are three operator-selected images per protocol, we did not perform statistical comparisons of operator-selected images between protocols.
For predefined images within protocol A, the differences were not significant for image quality and background quality (both p = 0.07). For protocol B, the differences were not significant for any of the parameters (p = 0.58–0.87). For protocol C, differences were not significant for number of EVs per image (p = 0.08), % cup-shape (p = 0.77) and image quality (p = 0.11). For protocol D, all the differences were significant (p < 0.05).
Within protocols, the number of EVs per image ranged for protocol A from 83 to 233, for protocol B 40 to 165, for protocol C 35 to 207 and for protocol D 91 to 273. Protocols A and D resulted in a 1.8-fold higher mean number of EVs with a lower %CV compared to protocols B and C. The number of EVs per image were comparable between protocols A and D (p = 0.73), and between protocols B and C (p = 0.99).
The number of cup-shape EVs per image ranged between 3 and 96. The % cup-shape was lowest for protocol A (14%) followed by B and D, 29% and 28%, respectively. Protocol C had the highest % cup-shape EVs, 46%.
Each image was scored on a scale from one (poor) to five (excellent) by four researchers. Based on rating, the mean image quality was 3.0, 2.5, 2.8 and 2.4 for protocols A, B, C and D, respectively (Supplemental Table 1). Between protocols there was a 1.3-fold difference in image quality score, and within protocols the variability in quality was comparable (%CV 24–29), except protocol B, which had a %CV of 47. Images from protocol A were rated highest for suitability for EV research (). Differences in image quality were not significant between protocols A-B (p = 0.06), A-C (p = 0.34), B-C (p = 0.23) and B-D (p = 0.68).
The mean background quality was 3.4, 3.4, 2.8 and 2.2 for protocols A, B, C and D, respectively (Supplemental Table 1). The relatively high scores for protocols A and B are probably due to less non-EV particles that interfere with EV identification (). The background quality differed between protocols, except between protocols A and B (p = 0.28).
Discussion
The ideal TEM EV preparation protocol results in TEM images that best represent the EV sample, even though it will never be perfect. These images should enable the assessment of the presence of EVs as well as the quality and purity of the sample. Furthermore, providing such images for all EV-related publications should facilitate the comparability between results obtained in different studies [Citation5].
To improve the reproducibility and reliability of TEM results, the influence of the preparation protocol should be minimised by developing a consensus protocol. Ideally, operator influence should be minimised or even eliminated. If this is not possible, the procedure of operator image selection should be well defined, and only allow the operator to eliminate obvious flaws.
The common practise within the EV field is to have an operator select a high-quality image of EVs, and to show the heterogeneity of the sample by providing an overview image. Operator image selection results in high-quality images but influences the results through observer bias. While the image contrast and background are clearly protocol dependent based on the images taken at predefined locations, the influence of the protocol is incorrectly marginalised by the operator image selection. In our facility, the operator searches for a field with a high number of EVs and low background. The parameters of our previous standard protocol (protocol D) had been extensively optimised using operator image selection. In hindsight, operator image selection stood in the way of a proper optimisation because protocol differences were effectively minimised by operator image selection. In our view, predefined locations are the least subjective, and operator image selection without any restrictions (e.g. time or area searched) the most subjective approach to image selection. Regardless of the method for image selection, it may be needed to discard an entire grid due to overall quality issues, for example due to ruptures in the formvar film, cleanliness, etc. Furthermore, the inclusion of an overview image proved ineffective to demonstrate that the images within the white squares in were not representative of the grids.
The selection of nine different protocols used in the EV field () shows that there are at least 13 parameters within each protocol that may influence the TEM images. Because several parameters are interdependent there is no straightforward way to optimise a protocol. Based on predefined image locations, the comparison of four protocols applied in the EV field demonstrates that the protocol choice affects the outcome of the experiment through differences in number of EVs per image, contrast and background quality. Low contrast and/or high background interfere with recognising EVs. Protocol A is straightforward, results in a high number of EVs with high contrast, and a low background, and can also be applied to identify EVs in plasma, see Supplemental Figure 3. Before removal of proteins in plasma, the background overshadows all EVs, but after protein removal by size exclusion chromatography protocol A was suitable [Citation21]. In addition, protocol A does not use fixation, which has the lowest probability of interfering with immunogold-EM.
Based on our results, a standard TEM protocol is needed, and specify all properties listed in , and should include a clear guideline on how to select image locations. The selection of locations should be as objective as possible, and sufficient images should be made available for others to assess the quality of an EV sample, possibly more than the five images per grid we applied here. A standardised protocol for sample preparation and imaging will enhance the comparability and reproducibility of TEM within the field of EV research.
Supplemental Material
Download MS Word (4.5 MB)Acknowledgements
We would like to acknowledge Nicole N. van der Wel and Henk A. van Veen from the Electron Microscopy Centre Amsterdam (the Netherlands) for their assistance with the transmission electron microscope, Edwin van der Pol for the Adobe script and NTA data of the urinary EV sample, and Ton A. G. J. M. van Leeuwen for rating the TEM images.
Disclosure statement
No potential conflict of interest was reported by the authors.
Supplementary Material
Supplemental data for this article can be accessed here.
Additional information
Funding
Related Research Data
References
- Conde-Vancells J, Rodriguez-Suarez E, Embade N, et al. Characterization and comprehensive proteome profiling of exosomes secreted by hepatocytes. J Proteome Res. 2008;7(12):5157–10.
- Arraud N, Linares R, Tan S, et al. Extracellular vesicles from blood plasma: determination of their morphology, size, phenotype and concentration. J Thromb Haemost. 2014;12(5):614–627.
- Coumans FAW, Brisson AR, Buzas EI, et al. Methodological guidelines to study extracellular vesicles. Circ Res. 2017;120(10):1632–1648.
- Van Deun J, Mestdagh P, Agostinis P, et al. EV-TRACK: transparent reporting and centralizing knowledge in extracellular vesicle research. Nat Methods. 2017;14(3):228–232.
- Lötvall J, Hill AF, Hochberg F, et al. Minimal experimental requirements for definition of extracellular vesicles and their functions: a position statement from the International Society for Extracellular Vesicles. J Extracell Vesicles. 2014;3. DOI:10.3402/jev.v3.26913.
- Cizmar P, Yuana Y. Detection and characterization of extracellular vesicles by transmission and cryo-transmission electron microscopy. Methods Mol Biol. 2017;1660:221–232.
- Yuana Y, Koning RI, Kuil ME, et al. Cryo-electron microscopy of extracellular vesicles in fresh plasma. J Extracell Vesicles. 2013;2. DOI:10.3402/jev.v2i0.21494.
- Witwer KW, Soekmadji C, Hill AF, et al. Updating the MISEV minimal requirements for extracellular vesicle studies: building bridges to reproducibility. J Extracell Vesicles. 2017;6(1):1396823.
- Clayton A, Buschmann D, Byrd JB, et al. Summary of the ISEV workshop on extracellular vesicles as disease biomarkers, held in Birmingham, UK, during December 2017. J Extracell Vesicles. 2018;7(1).
- Keerthikumar S, Gangoda L, Liem M, et al. Proteogenomic analysis reveals exosomes are more oncogenic than ectosomes. Oncotarget. 2015;6(17):15375–15396.
- Kowal J, Arras G, Colombo M, et al. Proteomic comparison defines novel markers to characterize heterogeneous populations of extracellular vesicle subtypes. Proc Natl Acad Sci U S A. 2016;113(8):968–977.
- Iavello A, Frech VSL, Gai C, et al. Role of Alix in miRNA packaging during extracellular vesicle biogenesis. Int J Mol Med. 2016;37(4):958–966.
- Polanco JC, Scicluna BJ, Hill AF, et al. Extracellular vesicles isolated from the brains of rTg4510 mice seed tau protein aggregation in a threshold-dependent manner. J Biol Chem. 2016;291(24):12445–12466.
- Minciacchi VR, You SY, Spinelli C, et al. Large oncosomes contain distinct protein cargo and represent a separate functional class of tumor-derived extracellular vesicles. Oncotarget. 2015;6(13):11327–11341.
- Deddens JC, Vrijsen KR, Colijn JM, et al. Circulating extracellular vesicles contain mirnas and are released as early biomarkers for cardiac injury. J Cardiovasc Transl Res. 2016;9(4):291–301.
- Lunavat TR, Cheng L, Kim DK, et al. Small RNA deep sequencing discriminates subsets of extracellular vesicles released by melanoma cells - Evidence of unique microRNA cargos. RNA Biol. 2015;12(8):810–823.
- Sodar BW, Kittel A, Paloczi K, et al. Low-density lipoprotein mimics blood plasma-derived exosomes and microvesicles during isolation and detection. Sci Rep. 2016;6:24316.
- van der Pol E, Coumans FAW, Grootemaat AE, et al. Particle size distribution of exosomes and microvesicles determined by transmission electron microscopy, flow cytometry, nanoparticle tracking analysis, and resistive pulse sensing. J Thromb Haemost. 2014;12(7):1182–1192.
- van der Pol E, Hoekstra AG, Sturk A, et al. Optical and non-optical methods for detection and characterization of microparticles and exosomes. J Thromb Haemost. 2010;8(12):2596–2607.
- Coumans FA, van der Pol E, Boing AN, et al. Reproducible extracellular vesicle size and concentration determination with tunable resistive pulse sensing. J Extracell Vesicles. 2014;3:25922.
- Boing AN, van der Pol E, Grootemaat AE, et al. Single-step isolation of extracellular vesicles by size-exclusion chromatography. J Extracell Vesicles. 2014;3. DOI:10.3402/jev.v3.23430.
- Vogel R, Coumans FA, Maltesen RG, et al. A standardized method to determine the concentration of extracellular vesicles using tunable resistive pulse sensing. J Extracell Vesicles. 2016;5:31242.
- Sahoo S, Klychko E, Thorne T, et al. Exosomes from human CD34(+) stem cells mediate their proangiogenic paracrine activity. Circ Res. 2011;109(7):724–735.
- Hong CS, Muller L, Boyiadzis M, et al. Isolation and characterization of CD34+blast-derived exosomes in acute myeloid leukemia. Plos One. 2014;9(8):e103310.
- Atay S, Gercel-Taylor C, Kesimer M, et al. Morphologic and proteomic characterization of exosomes released by cultured extravillous trophoblast cells. Exp Cell Res. 2011;317(8):1192–1202.