
 ?Mathematical formulae have been encoded as MathML and are displayed in this HTML version using MathJax in order to improve their display. Uncheck the box to turn MathJax off. This feature requires Javascript. Click on a formula to zoom.
ABSTRACT
Extracellular vesicles (EVs) function as important conveyers of information between cells and thus can be exploited as drug delivery systems or disease biomarkers. Transmission electron microscopy (TEM) remains the gold standard method for visualisation of EVs, however the analysis of individual EVs in TEM images is time-consuming if performed manually. Therefore, we present here a software tool for computer-assisted evaluation of EVs in TEM images. TEM ExosomeAnalyzer detects EVs based on their shape and edge contrast criteria and subsequently analyses their size and roundness. The software tool is compatible with common negative staining protocols and isolation methods used in the field of EV research; even with challenging TEM images (EVs both lighter and darker than the background, images containing artefacts or precipitated stain, etc.). If the fully-automatic analysis fails to produce correct results, users can promptly adjust the detected seeds of EVs as well as their boundaries manually. The performance of our tool was evaluated for three different modes with variable levels of human interaction, using two datasets with various heterogeneity. The semi-automatic mode analyses EVs with high success rate in the homogenous dataset (F1 score 0.9094, Jaccard coefficient 0.8218) as well as in the highly heterogeneous dataset containing EVs isolated from cell culture medium and patient samples (F1 score 0.7619, Jaccard coefficient 0.7553). Moreover, the extracted size distribution profiles of EVs isolated from malignant ascites of ovarian cancer patients overlap with those derived by cryo-EM and are comparable to NTA- and TRPS-derived data. In summary, TEM ExosomeAnalyzer is an easy-to-use software tool for evaluation of many types of vesicular microparticles and is available at http://cbia.fi.muni.cz/exosome-analyzer free of charge for non-commercial and research purposes. The web page contains also detailed description how to use the software tool including a video tutorial.
Introduction
Extracellular vesicles (EVs) are small double-leaflet membrane particles that function as important conveyers of information between cells in almost every (patho)physiological process [Citation1,Citation2]. EVs are produced by virtually all cell types and can be found in various biological fluids, including blood, urine, or ascites. Historically, EVs were divided into two main groups – microvesicles, which are larger (hundreds of nm) and mainly bud from plasma membrane and exosomes, which are smaller (~30–200 nm) and are believed to originate from specialised endosomal compartment, so-called multivesicular bodies [Citation3]. However, consensus has not yet been achieved on specific markers of the above-mentioned EV subtypes, thus assigning an EV to a particular biogenesis pathway upon its isolation from complex biological fluids is difficult. Hence, we will further use the generic term EVs. Importantly, the contents of EVs reflect the state of the cell from which they originate and thus, they are heavily studied as potential disease biomarkers. This is especially true for the small EVs, “exosomes” [Citation4]. Different bioactive cargo of vesicles (lipids, proteins, nucleic acids) underlines their function and may influence morphological characteristics (shape, size, etc.) of EVs.
The number of methods for characterising EVs has expanded as interest in EVs has increased. Yet, due to their small size, electron microscopy (EM) remains the most suitable method for visualisation of EVs in sufficient resolution for assessment of their morphology as well as discrimination between them and possible contaminants often found in EVs isolations (precipitated proteins, lipoprotein and/or viral particles, etc.). However, analysis of individual EVs in EM images is time-consuming if performed manually. Moreover, these images are frequently accompanied by artefacts created on various levels of preparation of the sample (isolation procedure, imperfect membranes on EM grids, high noise/background, inadequate staining of sample or anomalies created during acquisition of images) which all complicate EV analysis – both manually or using common image analysis pipelines and tools.
Therefore, we present here a semi-automatic software tool for computer-assisted evaluation (both qualitative and quantitative) of negatively stained EVs in transmission electron microscopy (TEM) images. We named the software tool TEM ExosomeAnalyzer to indicate it was specifically developed for analyses of the smallest EVs.
Materials and methods
Isolation of EVs and ethics statement
EVs were isolated from cell culture media of various cell lines: L-cells (mouse fibroblasts), MEF (mouse embryonic fibroblast) cells, HEK 293 cells, Kuramochi (ovarian cancer) cells, foetal bovine serum (FBS) and from patient ascites or plasma using differential centrifugation coupled to sucrose cushion ultracentrifugation as previously described [Citation5] or using qEVoriginal column according to manufacturer’s instructions (Izon Science Ltd, Oxford, UK). Ovarian cancer patient ascites and plasma were collected at Oncogynaecologic Center, University Hospital Brno, CZ, under the written informed consent of patients and IRB protocol approved by the Ethics Committee of University Hospital Brno. All specimens were handled according to the ethical and legal standards.
Negative staining, immunogold labelling and TEM
Four to eight μL drops of EVs in PBS were adsorbed at activated Formvar/Carbon coated grids (HF35Cu, Pyser-SGI Limited, Kent, UK) for 3–15 min at room temperature (RT) and subsequently stained at RT. Samples were stained either with 2 % ammonium molybdate, 2% uranyl acetate or Nano-W (2% Methylamine Tungstate, Nanoprobes, Yaphank, NY, USA) for 20–30 s. Alternatively, EVs were stained with 1% OsO4 for 30 min, washed in MilliQ water (3 × 5 min) and stained with 1% uranyl acetate for 15 min and washed in MilliQ water again (3 × 5 min). EVs were examined at 70 kV with a Morgagni 268D transmission electron microscope (FEI, Brno, CZ) equipped with a MegaViewIII digital camera (Soft Imaging System), or at 200 kV with Tecnai G2 transmission electron microscope (FEI, Brno, CZ) equipped with a 4k FEI Eagle CCD camera. The raw data images were exported to 16-bit TIFF format.
Immunogold labelling of EVs with CD63 antibody and imaging were done exactly as described in [Citation5].
Liposomes preparation
Liposomes were prepared by lipid film hydration method. Egg phosphatidylcholine (EPC, purchased from NOF Corporation, Frankfurt am Main, Germany) and cholesterol (Chol, purchased from Sigma-Aldrich, Prague, CZ) were dissolved in chloroform and mixed in a molar ratio of 7:3 (EPC:Chol) in a round-bottomed flask. A lipid film was prepared by evaporating the solvent under vacuum at 39°C with a rotary evaporator. The film was hydrated in MilliQ water reaching a final total lipid concentration of 5 mg/ml. To obtain unilamellar vesicles the sample was subjected to five cycles of freeze-thaw as described previously [Citation6]. To obtain uniformly sized liposomes, the sample was extruded through a 400 nm pore sized polycarbonate filter and subsequently through a 100 nm pore sized polycarbonate filter (Whatman International Ltd, Maidstone, UK).
Cryo-electron microscopy (cryo-EM)
Samples for cryo-EM were vitrified using an FEI Vitrobot Mark IV on Quantifoil R2/1 grids with the following settings: 4 µl sample; wait time 10 s; blot time 2 s; blot force −2. EVs were examined with Tecnai G2 transmission electron microscope (FEI, Brno, CZ) equipped with 4k FEI Eagle CCD camera, at 200 kV. The micrographs were acquired using EPU (FEI, Brno, CZ) acquisition software at defocus varying between 3 and 5 μm at 29,000 × or 80,000 × magnification (dose of 20 e− Å−2).
Nanoparticle tracking analysis (NTA)
NTA measurements were performed on a NanoSight NS500 instrument (blue laser 488 nm, sCMOS) (Malvern Instruments Ltd, Malvern, UK) as previously described [Citation7]. Data was recorded and analysed using NTA software 3.2. Samples were prepared by appropriate dilution of stock suspensions in PBS. Camera level was optimised prior to the measurement. For analysis, detection threshold was set for each sample individually in a way to meet manufacturer recommended quality standards. All other parameters were left in their default settings. Three runs of 60 s at 25 fps were recorded for each sample.
Tunable resistive pulse sensing (TRPS)
TRPS was performed using the qNano instrument (Izon Science Ltd, Oxford, UK) as previously described [Citation8]. Data was recorded and analysed using the Izon Control Suite Software version 3.3.2.2001. Samples were prepared by diluting stock suspensions in PBS. For size and concentration calibration, CPC100 polystyrene standard particles (Izon Science Ltd, Oxford, UK) were used. NP150 membrane nanopore (Izon Science Ltd, Oxford, UK) was used for these experiments (NP150 nanopore range: 50–330 nm). A potential of 0.64 V and a pressure of 4 mBar and 8 mBar were applied. Each measurement was made with a single run where at least 1000 particles were detected.
Data analysis and visualisation
Data was visualised by GraphPad Prism 6 (GraphPad Software, Inc., La Jolla, CA, USA), or analysed using in-house developed scripts written in MATLAB R2017a (The Mathworks, Inc., Natick, MA, USA). The bin width of the created histograms was fixed at 8 nm and the smoothing with Gaussian kernel with σ equal to 1 was applied.
Software tool implementation
Input data
TEM ExosomeAnalyzer supports TIFF image file format containing either floating-point or 8-bit and 16-bit integer grayscale data. The dimensions of the individual images from a Morgagni 268D microscope (FEI) were 2,048 × 2,048 pixels, with scales ranging from 0.3 to 3.9 nanometres per pixel and the dimensions of the individual images from a Tecnai G2 microscope (FEI) were 4,096 × 4,096 pixels with scales ranging from 0.1 to 1.4 nanometres per pixel. However, for timewise performance reasons, resolution around 500 × 500 pixels is ideal.
Algorithm
An updated version of an algorithm described previously [Citation9] has been used. The algorithm considers the variability in EVs appearance in the input images by exploiting EV borders and their roughly oval shape as the discriminative features. It is based on a morphological seeded watershed, with the proper identification of EVs as the intermediate step of the algorithm. In short, after reducing the amount of noise and enhancing the EV borders using edge-enhancing diffusion (EED), a sequence of hysteresis thresholdings is applied on the gradient magnitude of the preprocessed input image to identify candidate objects. Next, the candidate objects are filtered out based on their shape, and possibly split when clustered, using a HCONVEX transform [Citation10] over their Euclidean distance maps. This ideally yields a single detection seed for each individual EV. Finally, the image is segmented using a morphological seeded watershed with the gradient magnitude of the input image as the segmentation function, and the objects measuring at least 30 nm in diameter are output as EVs. However, this default parameter can be modified according to user`s needs.
Software tool workflow
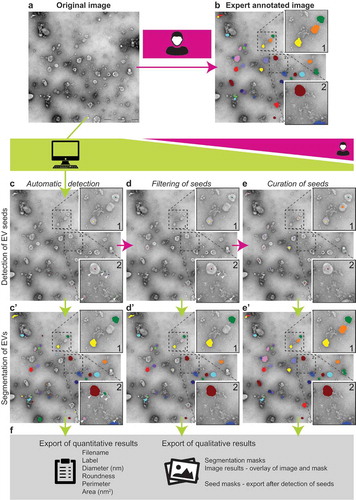
Common workflow is described in detail on the TEM ExosomeAnalyzer homepage http://cbia.fi.muni.cz/exosome-analyzer. The web page contains also video tutorial. Schematic representation of the workflow is shown in . First, the user opens images () stored in the TIFF file format with correct pixel size information (in microns). shows results of a manual outlining of the same image for comparison. The images are then processed in a detection step with a user-tunable parameter configuration. For all three of our analyses we used default settings (i.e. lambda = 0.005, alpha = 0.15, roundness threshold 0.75, maximum relative cluster size = 1, relative size of expected EVs = 1) and minimum object diameter 0.03 μm. The detection step yields intermediate EV seeds (), from which the segmentation step can proceed (’). At this point, manual editing is possible to delete or adjust spurious seeds (), or to add seeds of EVs which were not detected automatically (), thus better guiding the segmentation. In the segmentation step that follows, EV borders are determined, and these can also be edited manually later. Finally, qualitative as well as quantitative results can be exported: intermediate seeds or final segmentation masks, composite image results, and quantitative results containing Filename, Label number, Diameter (nm), Roundness, Perimeter (nm) and Area (nm2). The quantitative results (in CSV format) can subsequently be used for further analysis by various statistical packages ().
Figure 1. TEM ExosomeAnalyzer workflow overview.
Usually, TEM images (a) of EVs are manually analysed, which is time consuming. TEM ExosomeAnalyzer is able to detect EVs with almost no input from the user. (b) EVs manually labelled by experts; these images served as the references for the software tool performance being evaluated in three different modes (with decreasing levels of automatic analysis and concurrently with increasing levels of human interaction). The Fully automatic mode (left column – c and c’), Filtered seeds mode (middle column – d and d’) and Curated seeds mode (right column – e and e’). Lime green colour highlights processes performed by the software tool, while magenta colour corresponds to processes performed by the user. In the first step of automatic detection, seeds (= centres) of EVs are found (c) and in the second step EVs are segmented (= their borders are found) (c’). Seeds of EVs which do not meet the requirements set in “Parameters” prior analysis are filtered out in segmentation step. An example is shown in box 2; in detection step, five seeds were found (white arrowheads) (c), but after segmentation (c’), only three EVs remained and two original seeds (dark blue and light green) were filtered out due to their size lower than 30 nm (default value, adjustable). If the user is not satisfied with detected seeds, the seeds at wrong positions can be manually deleted (d), and then segmented (d’), pink and dark green seeds in box 2 serve as an example. Moreover, if some seeds are missing, they can be manually added (e) and then segmented (e’), orange seed in box 1 serves as an example. If the user is not satisfied with segmentation results, they can be also modified prior the export of results. Finally, qualitative (images and masks) and quantitative results including diameter, roundness, perimeter and area of EVs are exported (f).
Results
Performance of the software
Test datasets
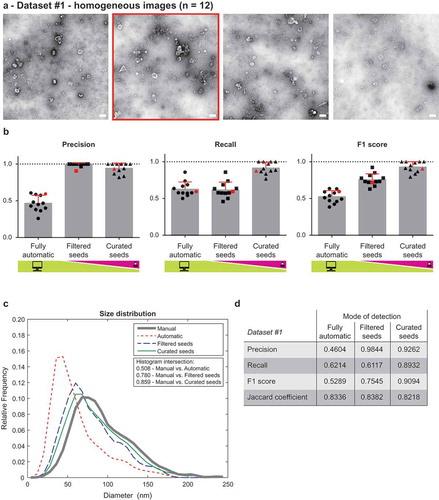
We evaluated the performance of TEM ExosomeAnalyzer using two datasets. Dataset #1 consisted of 12 images of EVs isolated from two patient ascites and imaged on the same day with identical (28,000 ×) magnification. These images contain many EVs of roughly oval shapes and different sizes, examples from Dataset #1 are shown in and complete dataset is available as Supplementary Information 1.
Figure 2. Performance of TEM ExosomeAnalyzer – homogeneous dataset.
The performance of TEM ExosomeAnalyzer was compared with images manually annotated by experts. (a) Four representative images from a small (12 images) homogeneous dataset with all samples prepared and images taken on the same day using identical magnification. The white bar represents 200 nm in each image. (b) Graphs showing performance of the software tool in three categories – Precision (left panel), Recall (middle panel) and F1 score (right panel), each time for three different modes (fully automatic, filtered seeds and curated seeds – as described in ). Each symbol in the graphs corresponds to result for one image. Red colour highlights performance of the software tool for the second image from (a) which was chosen as an example. In Filtered seeds all wrong seeds are removed, therefore all the remaining ones are correct leading to nearly perfect Precision, however, some EVs have still not been detected (no seeds had been added), therefore there is no improvement in terms of number of correctly recognised EVs (Recall), which can be observed as no difference between Fully automatic and Filtered seeds in Recall. (c) The software tool performance depicted as histogram of relative frequencies with respect to diameter of detected EVs. Histograms for manually annotated images and for images analysed by TEM ExosomeAnalyzer are shown together with intersections of manual detection with each of the evaluated modes. (d) Table summarising the results from dataset analysis at the level of individual EVs (not on image levels as in (b)).
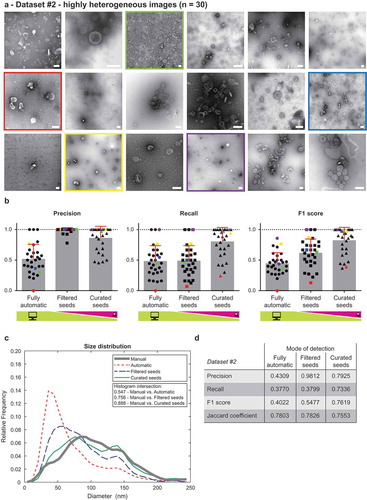
Dataset #2 contained 30 highly heterogeneous images. These were taken at various magnifications, on various days and contain EVs isolated from 15 patient ascites (both malignant and non-malignant), culture media of several cell lines and from FBS. Some of the images feature coarse and grainy background, while some have smooth background, the set includes both light EVs on dark background and dark EVs on light background, with different contributions from staining and imaging artefacts. Numbers of EVs vary from 1 to ~60 per image. This dataset was composed to be as heterogeneous as possible in terms of sources of EVs, isolation by multiple researchers and using various methods, etc. Representative images from Dataset #2 are shown in , complete dataset is available as Supplementary Information 2.
Figure 3. Performance of TEM ExosomeAnalyzer – highly heterogeneous dataset.
TEM ExosomeAnalyzer performance was compared to expert annotated images. (a) shows 18 representative images of highly heterogeneous dataset (30 images altogether) containing images of EVs from multiple sources (patient ascites and several cell cultures), isolated by multiple researchers and visualised by TEM using various magnifications and on different days. The white bar represents 200 nm in each image. (b) Graphs showing performance of the software tool in three categories – Precision, Recall and F1 score, each time for three different modes (fully automatic, filtered seeds and curated seeds – as described in ). Each symbol in the graphs corresponds to result for one image. Similarly as in , in Filtered seeds all wrong seeds are removed, therefore all the remaining ones are correct leading to nearly perfect Precision, however, some EVs have still not been detected (no seeds added), therefore there is no improvement in terms of number of correctly recognised EVs (Recall), which can be observed as no difference between Fully automatic and Filtered seeds in Recall. Five images are highlighted by colour (red, yellow, green, violet and blue) both in (a) and (b) to illustrate the performance of the software tool for individual images with different level of heterogeneity. (c) The software tool performance shown as histogram of relative frequencies with respect to diameter of detected EVs. Histograms for manually annotated images as well as for images analysed by the software tool are shown together with intersections of manual detection with each of the semi-automated analyses. Using the Curated seeds mode, we were able to detect EVs with precision higher than 85 %. (e) Table summarising the results from dataset analysis at the level of individual EVs (not on image levels as in (b)).
Detection success rate
In order to assess the capabilities of the software tool, we evaluated it in three different modes with decreasing levels of automatic analysis and concurrently increasing levels of human interaction:
Fully automatic detection and segmentation with the default parameter settings. This mode is further abbreviated as Fully automatic.
Automatic segmentation after a manually filtered detection. In this mode, the intermediate seeds corresponding to false positives (“spurious detections”) were removed by the user. This mode is further referred to as Filtered seeds.
Automatic segmentation after a manually curated detection. In this mode, the intermediate seeds not corresponding to EVs were removed, and seeds for the missed EVs were added prior to the automatic segmentation. Both adding and removing an intermediate seed can be achieved with one mouse click. This mode is referred to as Curated seeds in the following text.
The detected objects were compared with expert-annotated images. Only those EVs two human experts agreed upon were considered reference EVs. Examples of the annotated images are available in Figure 1 in Supplementary Material. We expressed the detection success rate in terms of Precision, Recall, and the combined F1 score: ,
,
, where TP is the number of True Positives, FP is the number of False Positives, and FN is the number of False Negatives. A detected object was labelled as a True Positive, if it intersected with exactly one reference EV, and no other detected object intersected with the same reference EV. In other cases, the detected objects were labelled as False Positives. The reference EVs with no corresponding True Positive (i.e. missed EVs) were counted as False Negatives. Precision, Recall, and F1 score for each of the three evaluated modes over individual images are shown in (for Dataset #1) and (for Dataset #2). The Curated seeds mode detects EVs with success rate exceeding 90% for Dataset #1 and 75% for Dataset #2.
Histograms showing the overlap of size distribution of EVs detected by these three modes with manually annotated images are shown in (for Dataset #1) and in (for Dataset #2). Histogram intersection data shows over 85% overlap between the Curated seeds mode and Manual annotation for both datasets, supporting practical applicability of our software tool for a broad spectrum of TEM images (including different magnifications).
We then expressed the segmentation accuracy using the Jaccard coefficient: , where A is the set of pixels of the reference EV, and B is the set of pixels of the segmented object. Thus,
would indicate a pixel-perfect match between A and B. The results are summarised in and , respectively, showing the Precision, Recall, F1 scores and Jaccard coefficients over True positives achieved in different modes for the two datasets collectively (i.e. the total number of detected EVs in the whole dataset).
Comparison of size distribution profiles obtained by TEM ExosomeAnalyzer and by independent methods
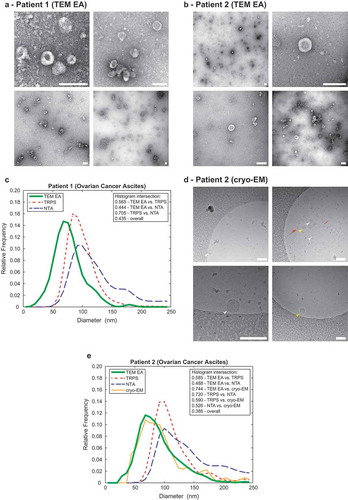
To further evaluate practical applicability of the TEM ExosomeAnalyzer software tool, we compared the size distribution profiles of EVs from two patient ascites with size distribution profiles of the same samples obtained by NTA [Citation11] and TRPS [Citation12] and for one sample also by cryo-EM [Citation13]. Example images from TEM for both patients are shown in and cryo-EM example images are shown in . The TEM ExosomeAnalyzer data was obtained using the Curated seeds mode for TEM images. Cryo-EM data was obtained by manual outlining of EVs in TEM ExosomeAnalyzer and then exporting of quantitative results. The size distribution profiles extracted by the NTA and TRPS are highly similar (histogram intersection over 70 % in both patients, . As expected, the size distribution profile obtained by TEM and cryo-EM was shifted to the left when compared to NTA and TRPS (). This is caused by the fact that EM has virtually no lower limit (~ 1,8 nm [Citation14]), and thus TEM ExosomeAnalyzer can detect and analyse even the smallest EVs in the sample, unlike NTA and TRPS, whose lower detection limits are ~55–60 nm and ~40 nm, respectively [Citation11,Citation12]. Importantly, the match between TEM and cryo-EM size distribution profiles (histogram intersection 0.744 for Patient 2) indicate, that EVs may not shrink during processing of samples for negative contrasting and TEM, an artefact which has been widely proposed previously [Citation13,Citation15,Citation16].
Figure 4. Comparison of the TEM ExosomeAnalyzer with other methods.
Representative TEM images used are shown in (a) for Patient 1 and in (b) for Patient 2, both samples are ovarian cancer ascites. The white bar represents 200 nm in each image. (c) Comparison of size distribution profiles of exs measured by TEM ExosomeAnalyzer (TEM EA), TRPS and NTA in the range applicable for all methods depicts coherent results for all approaches. Representative cryo-EM images used are shown in (d) for Patient 2, arrowheads indicate EVs. EVs containing the characteristic phospholipid bilayer (white arrowheads) as well as multi-layered vesicles (yellow arrowheads) and electron dense particles, which are likely lipoprotein particles (red arrows), were observed. (e) Comparison of size distribution profiles of EVs from Patient 2 measured by TEM ExosomeAnalyzer (TEM EA), TRPS, NTA and cryo-EM (data were acquired using TEM EA, each EV was manually outlined) in the range applicable for all methods depicts coherent results for all approaches. TEM EA provides comparable results to those of TRPS and NTA. Moreover, TEM EA and cryo-EM are able to analyse also vesicles smaller than the detection limit of TRPS and NTA. Interestingly, it seems that EVs do not shrink during processing for TEM as evidenced by largely overlapping histograms between TEM EA and cryo-EM.
Performance of TEM ExosomeAnalyzer using multiple negative staining protocols and several isolation methods of EVs
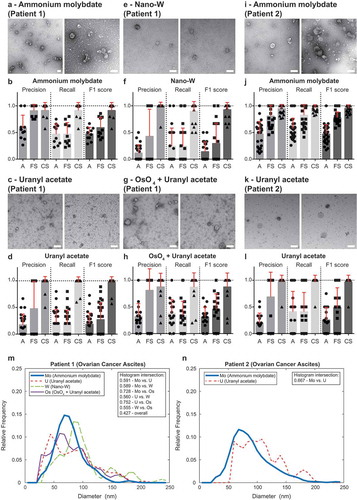
The data presented so far was obtained using ammonium molybdate as a negative stain, thus, we analysed the compatibility of the software with other staining protocols widely utilised in TEM of EVs, such as uranyl acetate, tungstate and osmium tetroxide. TEM ExosomeAnalyzer reproduced similar results with all negative staining approaches tested on EVs isolated from ascites of Patient 1 and 2 ( and Figure 2 in Supplementary Material). Finally, we also tested the software on a set of control images – “buffer only” (no EVs) images, lipoprotein particles, immunogold-labelled EVs, pellet of ascites EVs after ultracentrifugation (no floatation step resulting in “dirty” isolates of EVs) and EVs isolated by size exclusion chromatography (qEV column) from patient ascites and plasma. While there are usually no EVs detected in “buffer only” negative control (Figure 3A in Supplementary Material), the use of software is well compatible with analysis of lipoprotein particles (Figure 3B in Supplementary Material) and immunogold labelling (Figure 3C in Supplementary Material) and EVs isolated using qEV column (Figure 3D–E in Supplementary Material). “Dirty isolations” of EVs result in number of false positives detected by the software, however, these can be easily filtered out even by unexperienced user based on their “suspicious appearance” (Figure 3F in Supplementary Material). These results justify the feasibility of TEM ExosomeAnalyzer for the most commonly used negative staining methods and protocols used to isolate EVs.
Figure 5. Performance of TEM ExosomeAnalyzer – different negative staining methods.
The performance of TEM ExosomeAnalyzer with respect to different negative staining protocols was performed. The white bar represents 200 nm in each image. Representative images and performance of the software in three modes (A – fully automatic, FS – filtered seeds, CS – curated seeds) are shown for EVs isolated from patient ovarian cancer ascites. Each symbol in the graphs corresponds to result for one image. Patient 1 ascites EVs were stained with ammonium molybdate (a and b), uranyl acetate (c and d), nano-W (e and f) and osmium tetroxide + uranyl acetate (g and h). Patient 2 ascites EVs were stained only by ammonium molybdate (i and j) and uranyl acetate (k and l). Comparison of size distribution profiles of EVs obtained by TEM ExosomeAnalyzer (in CS mode) using different staining techniques (m – patient 1, n – patient 2). High level of performance and similar size distribution profiles of EVs were achieved with all protocols tested.
Discussion
Even though the field of EV research is growing extremely fast and new approaches for EVs, isolation and characterisation are being developed, traditional methods such as EM are still of key importance. EM is superior in visualisation of small EVs. Nevertheless, EM alone is not very suitable as a method for quantitative evaluation of EVs, since analysis of sufficient numbers of TEM images is time-consuming if performed manually. Therefore, image analysis tools for (semi-)automated quantitative evaluation of EVs in TEM images are demanded. The high variability of the input images and their inherent graininess call for a segmentation approach that would succeed across a wide range of scenarios. Since some of the EVs are lighter than their surroundings, while others are darker, or of similar intensity as the background, the EV border and their roughly oval shape (and not intensity) were the consistently reliable discriminating features. Thus, the backbone of our segmentation method is based on morphological watershed, with the identification of the EV seeds being an important intermediate step.
We compared the performance of our software tool with available approaches that might be used for EV segmentation. We tried three machine-learning-based approaches: (1) ilastik object classification with training data generated by algebraic curve fitting [Citation17,Citation18], (2) ilastik pixel + object classification with training data prepared manually [Citation18] and (3) Trainable WEKA pixel classification with training data prepared manually [Citation19]. The common bottleneck of all machine-learning-based approaches is the lack of sufficient amount of training data [Citation19], which was also our case. Supervised deep learning algorithms achieve acceptable performance with thousands of labelled examples per category [Citation20]. TEM ExosomeAnalyzer does not employ any machine-learning step, therefore no annotated data is needed. Recently, a novel image processing procedure for analysis of EVs by EM was described [Citation13]. However, no ready-to-use implementation of the algorithm used is publicly available, and thus the algorithm cannot be easily employed by scientists with minimal programming skills.
The default settings are a compromise between Precision and Recall, and by adjusting the Parameters, the user can direct the analysis towards the preferred option. We also expect the users to prefer computer-assisted mode of usage (exemplified here by automatic segmentation after a manually filtered/curated detection – the modes Filtered seeds and Curated seeds), as it provides high level of control as well as performance (in both F1 scores and Jaccard coefficient for Dataset #1 and even for Dataset #2 which represents highly variable input data). Usually, the EV borders after proper EV seeding (manual deleting of false positives and inserting of false negatives – missed EVs) do not need to be adjusted, justifying the approach used. Also, multiple images can be analysed in a batch (the tool can be run in the background or overnight) to speed up and simplify data handling. Nevertheless, even the fully automatic mode, which requires almost no input from the user, yields acceptable results and substantially reduces hands-on time. Typically, the tens of minutes spent on manual analysis of a single image with ~ 20–50 EVs can be reduced to minutes.
Such minor requirements on the user provoke application of TEM ExosomeAnalyzer also for semi-quantitative EVs measurements, such as size distribution profiles. Although this software tool can clearly help with the analysis of EVs below the detection limit of NTA and TRPS, the inherent factors of TEM must be considered, such as, the EVs are viewed after adhesion to a surface and this may not be uniform in terms of adherence to the formwar coating as well as spatial distribution of EVs [Citation15], due to the high magnification used only a very limited portion of the grid can be analysed, thus the choice of the representative areas of EM grid is greatly influenced by the operator and finally the EVs may shrink during the staining procedure [Citation13,Citation15,Citation16,Citation21]. The estimations of size reduction caused by preparation of samples for TEM are between 12 % [Citation15] to 21 % [Citation22], however, we did not observe such reduction in size of EVs when we compared TEM images with cryo-EM images. We believe this is due to the fact that we did not use aldehyde fixatives nor alcohols to dehydrate EVs during staining on the grid, which are common steps of most of the whole-mount staining protocols as well as protocols involving ultrathin sectioning of EVs embedded in resins [Citation21]. Nevertheless, we cannot exclude that there is a minor shrinkage in size of EVs because heavy metal stains also act as fixatives [Citation14]. Cryo-EM was used as a reference as it is the only method directly visualising the natural structure of the EVs as well as their accurate size since it does not require prior fixation or contrasting of EVs with heavy metals [Citation23]. Out of curiosity, we also tried using our software for analysis of cryo-EM images. Not surprisingly, it was not able to identify EVs in the cryo-EM images due to their intrinsically lower contrast when compared to TEM images. This is caused mostly by lower interactions of electrons with biological matter compared to heavy metals [Citation24]. Nevertheless, we successfully used TEM ExosomeAnalyzer for analysis of EVs in cryo-EM images in a “manual” mode, where we manually outlined the borders of EVs and then exported quantitative data to compare the size distribution profiles of EVs with TEM, NTA and TRPS.
Using cryo-EM for the EVs isolated from patient ascites, we were able to observe microparticles with phospholipid bilayer, an attribute of EVs, as well as other vesicular microparticles surrounded by phospholipid monolayer, which we believe are lipoprotein particles [Citation25]. Lipoproteins resemble EVs in their physical features, including size and buoyant density, which leads to their co-purification with EVs. In fact, lipoproteins may significantly outnumber EVs in isolates from clinical samples, such as plasma [Citation25,Citation26]. Malignant ascites is a body fluid which similarly as blood contains high amount of plasma proteins and lipoprotein particles [Citation27] and our isolation protocol (ultracentrifugation coupled to sucrose cushion) [Citation5] most likely results in contamination of EVs with lipoprotein particles [Citation28]. Common negative stainings for TEM (ammonium molybdate, tungstate and uranyl acetate) are not able to distinguish between EVs and lipoproteins [Citation25], thus we employed also osmium tetroxide to visualise lipoproteins [Citation25], in our EVs preparations. However, we did not observe the high electron density characteristic of lipoprotein particles in TEM images. Unfortunately, due to limited amount of Patient 1 sample we were unable to directly compare osmium tetroxide staining to cryo-EM. Nevertheless, we did not observe many lipoprotein particles in cryo-EM images of EVs from Patient 2. Given the fact that EVs and lipoproteins share identifying features, they are readily detected by TEM ExosomeAnalyzer. To further verify this, we tested liposomes and found they are detected with similar efficiency as EVs. Thus the decision as to what is EV and what is lipoprotein particle remains on the user and his or her choice of prior isolation steps of EVs and negative staining methods used. Our software tool is compatible and yields similar results with common negative staining approaches and isolation methods. However, we highly advocate for protocols yielding EVs of high purity, which is also better for the software tool. Isolates of EVs that are impure (such as results of ultracentrifugation without a floating step) often lead to identification of false positives. However, these false positives have usually such bizarre shapes that they can be easily filtered-out by the user.
Finally, the TEM ExosomeAnalyzer can be used to study virtually any vesicular particles found not only in body fluids, including large size vesicles (e.g. oncosomes) as they have similar identifying features in TEM images (and correspondingly the minimum diameter limit for detection and relative size of expected EVs can be changed in the Parameter settings), therefore the application of TEM ExosomeAnalyzer for microparticles other than EVs is also possible and welcome.
Conclusion
To the best of our knowledge, we present here a first stand-alone, ready-to-use and user-friendly software for basic analyses of TEM images of EVs. We believe that the key advantage of TEM ExosomeAnalyzer over publicly available, state-of-the-art approaches [Citation13,Citation17–Citation19] lies in its readiness to be used, as it does not rely on the availability of training data. The algorithm is based on a morphological seeded watershed, where the seeds are identified by performing a series of hysteresis thresholdings, followed by size and shape filtering. User shall check and easily modify either the seeds and/or the later segmentation masks to fully guide and control the computer-assisted process to yield optimal results.
The method can detect EVs both lighter and darker than their surroundings, and distinguish them from common artefacts in TEM images, such as precipitated stain, protein aggregates, and other impurities that are frequently present in sample preparations. However, the software cannot distinguish between EVs and lipoprotein particles, which may constitute a significant portion of the sample, because EVs and lipoprotein particles share features upon which their detection is based. Nevertheless, our software tool provides basic features of the segmented vesicles: number, diameter, perimeter, area, and roundness, offering a semi-automated way to study and evaluate EV preparations both for research and clinical purposes. As such it can be used for qualitative and semi-quantitative evaluation of even smallest EVs, which are below the detection limit of NTA, TRPS or flow cytometry.
We believe the ever-growing EV research would benefit from the presented tool and we welcome users’ feedback in order to further improve the TEM ExosomeAnalyzer software tool, which is publicly available at http://cbia.fi.muni.cz/exosome-analyzer, free of charge for non-commercial and research purposes. The web page contains also instruction manual and video tutorial for the software tool.
Supplemental Material
Download (111.3 MB)Supplemental Material
Download (107.5 MB)Supplemental Material
Download (94 MB)Acknowledgments
We thank Oncogynaecologic Center, University Hospital Brno, CZ, especially to medical doctors Vít Weinberger, Igor Crha, Luboš Minář, Markéta Bednaříková and Eva Jandáková, for patient ascites and plasma samples.
We also thank to Central European Institute of Technology Core Facility of Cryo-Electron Microscopy and Tomography supported by the Czech Infrastructure for Integrative Structural Biology research project (LM2015043 funded by the Ministry of Education, Youth and sports of the Czech Republic) for their assistance in obtaining the scientific data presented in this paper. Especially, we thank to Anatolij Filimonenko for technical assistance with osmium tetroxide staining.
Disclosure statement
The authors reported no potential conflict of interest.
Supplementary material
Supplemental data for this article can be accessed here.
Additional information
Funding
Notes on contributors
Anna Kotrbová
VP, VB and PM conceived and designed the research. AK, ZD and VP isolated the EVs, AK and VP served as experts for EVs annotation and evaluated the performance of TEM ExosomeAnalyzer. DK, LI and AH performed the TEM experiments using a Morgagni 268D electron microscope. MK performed all analyses using a Tecnai G2 transmission electron microscope, including cryo-EM. KŠ, MM and JJP developed and tested the software tool as well as designed and made the web page. KŠ, AK, ZD and VP made the video tutorial. FH performed NTA and TRPS measurements and prepared liposomes. AK, MM, KŠ, PM and VP analysed the data. AK, KŠ, VP, VB and PM interpreted the data and wrote the manuscript. Each author reviewed and made critical comments to the manuscript.
Related Research Data
References
- Yanez-Mo M, Siljander PR, Andreu Z, et al. Biological properties of extracellular vesicles and their physiological functions. J Extracell Vesicles. 2015;4:27066. PubMed PMID: 25979354; PubMed Central PMCID: PMC4433489.
- Steinbichler TB, Dudas J, Riechelmann H, et al. The role of exosomes in cancer metastasis. Semin Cancer Biol. 2017 Jun;44:170–13. PubMed PMID: 28215970.
- Raposo G, Stoorvogel W. Extracellular vesicles: exosomes, microvesicles, and friends. J Cell Biol. 2013 Feb 18;200(4):373–383. . PubMed PMID: 23420871; PubMed Central PMCID: PMC3575529.
- Mirzaei H, Sahebkar A, Jaafari MR, et al. Diagnostic and therapeutic potential of exosomes in cancer: the beginning of a new tale? J Cell Physiol. 2017 Dec;232(12):3251–3260. PubMed PMID: 27966794.
- Pospichalova V, Svoboda J, Dave Z, et al. Simplified protocol for flow cytometry analysis of fluorescently labeled exosomes and microvesicles using dedicated flow cytometer. J Extracell Vesicles. 2015;4:25530. PubMed PMID: 25833224; PubMed Central PMCID: PMC4382613.
- Traikia M, Warschawski DE, Recouvreur M, et al. Formation of unilamellar vesicles by repetitive freeze-thaw cycles: characterization by electron microscopy and 31P-nuclear magnetic resonance. Eur Biophys J. 2000;29(3):184–195. PubMed PMID: 10968210.
- Maas SL, de Vrij J, van der Vlist EJ, et al. Possibilities and limitations of current technologies for quantification of biological extracellular vesicles and synthetic mimics. J Control Release. 2015 Feb 28;200:87–96. PubMed PMID: 25555362; PubMed Central PMCID: PMC4324667.
- Maas SL, De Vrij J, Broekman ML. Quantification and size-profiling of extracellular vesicles using tunable resistive pulse sensing. J vis exp. 2014 Oct 19;(92):e51623. PubMed PMID: 25350417; PubMed Central PMCID: PMC4335984. Doi:10.3791/51623
- Štěpka K, Maška M, Pálenik JJ. et al. Automatic detection and segmentation of exosomes in transmission electron microscopy. In: Hua G, Jégou H. editors. Computer vision – ECCV 2016 workshops. Amsterdam, The Netherlands: Springer International Publishing, 2016:318–325. October 8-10 and 15-16, 2016, Proceedings, Part I. Cham.
- Soille P. Morphological Image Analysis. Vol. 2. Heidelberg, Germany: Springer-Verlag Berlin Heidelberg; 2004.
- Dragovic RA, Gardiner C, Brooks AS, et al. Sizing and phenotyping of cellular vesicles using nanoparticle tracking analysis. Nanomed. 2011 Dec;7(6):780–788. PubMed PMID: 21601655; PubMed Central PMCID: PMC3280380.
- Coumans FA, van der Pol E, Boing AN, et al. Reproducible extracellular vesicle size and concentration determination with tunable resistive pulse sensing. J Extracell Vesicles. 2014;3:25922. PubMed PMID: 25498889; PubMed Central PMCID: PMC4263901.
- Cizmar P, Yuana Y. Detection and characterization of extracellular vesicles by transmission and cryo-transmission electron microscopy. Methods Mol Biol. 2017;1660:221–232. PubMed PMID: 28828660.
- Scarff CA, Fuller MJG, Thompson RF, et al. Variations on negative stain electron microscopy methods: tools for tackling challenging systems. J vis exp. 2018 Feb 6; 132: PubMed PMID: 29443097; PubMed Central PMCID: PMC5912373. doi: 10.3791/57199.
- van der Pol E, Coumans FA, Grootemaat AE, et al. Particle size distribution of exosomes and microvesicles by transmission electron microscopy, flow cytometry, nanoparticle tracking analysis, and resistive pulse sensing. J Thromb Haemost. 2014 May 13 PubMed PMID: 24818656. DOI:10.1111/jth.12602.
- van Niel G, D’Angelo G, Raposo G. Shedding light on the cell biology of extracellular vesicles. Nat Rev Mol Cell Biol. 2018 Apr;19(4):213–228. . PubMed PMID: 29339798.
- Seyedhosseini M, Ellisman MH, Tasdizen T. Segmentation of mitochondria in electron microscopy images using algebraic curves. Proc IEEE Int Symp Biomed Imaging. 2013;2013: 860–863. PubMed PMID: 25132915; eng.
- Sommer C, Straehle C, Köthe U, et al., editors. Ilastik: interactive learning and segmentation toolkit. 2011 IEEE International Symposium on Biomedical Imaging: From Nano to Macro; 2011 March 30, 2011-April 2; Chicago, IL, USA; 2011.
- Arganda-Carreras I, Kaynig V, Rueden C, et al. Trainable Weka segmentation: a machine learning tool for microscopy pixel classification. Bioinformatics. 2017 Aug 1;33(15):2424–2426. PubMed PMID: 28369169.
- Goodfellow I, Bengio. Y, Courville A. Deep Learning. Cambridge, MA: MIT Press; 2016.
- Thery C, Amigorena S, Raposo G. et al. Isolation and characterization of exosomes from cell culture supernatants and biological fluids. Curr Protoc Cell Biol. Juan S Bonifacino [et al]. 2006 Apr; Chapter 3: Unit3 22. doi: 10.1002/0471143030.cb0322s30. PubMed PMID: 18228490
- Jensen OA, Prause JU, Laursen H. Shrinkage in preparatory steps for SEM. A study on rabbit corneal endothelium. Albrecht Von Graefes Arch Klin Exp Ophthalmol. 1981;215(4): 233–242. PubMed PMID: 6164307.
- Yuana Y, Koning RI, Kuil ME, et al. Cryo-electron microscopy of extracellular vesicles in fresh plasma. J Extracell Vesicles. 2013 Dec;31:2. PubMed PMID: 24455109; PubMed Central PMCID: PMC3895263.
- Thompson RF, Walker M, Siebert CA, et al. An introduction to sample preparation and imaging by cryo-electron microscopy for structural biology. Methods. 2016 May 1;100:3–15. PubMed PMID: 26931652; PubMed Central PMCID: PMC4854231.
- Sodar BW, Kittel A, Paloczi K, et al. Low-density lipoprotein mimics blood plasma-derived exosomes and microvesicles during isolation and detection. Sci Rep. 2016 Apr 18;6:24316. PubMed PMID: 27087061; PubMed Central PMCID: PMC4834552.
- Simonsen JB. What are we looking at? Extracellular vesicles, lipoproteins, or both? Circ Res. 2017 Sep 29;121(8):920–922. PubMed PMID: 28963190.
- Kipps E, Tan DS, Kaye SB. Meeting the challenge of ascites in ovarian cancer: new avenues for therapy and research. Nat Rev Cancer. 2013 Apr;13(4):273–282. . PubMed PMID: 23426401.
- Karimi N, Cvjetkovic A, Jang SC, et al. Detailed analysis of the plasma extracellular vesicle proteome after separation from lipoproteins. Cell Mol Life Sci. 2018 Aug;75(15):2873–2886. 10.1007/s00018-018-2773-4. PubMed PMID: 29441425; PubMed Central PMCID: PMC6021463.